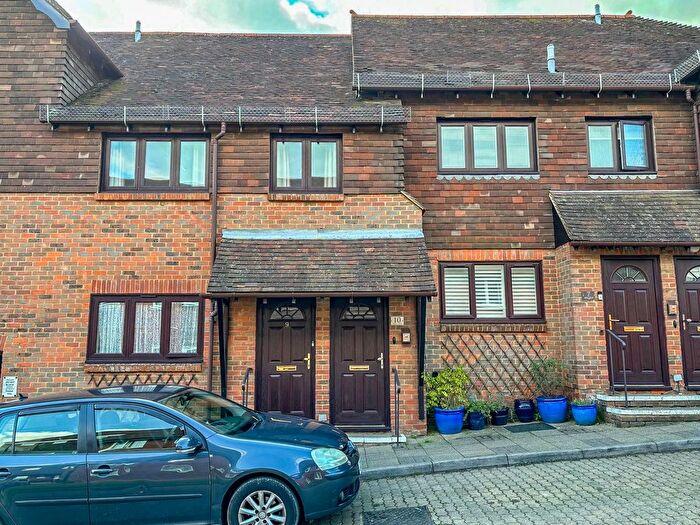
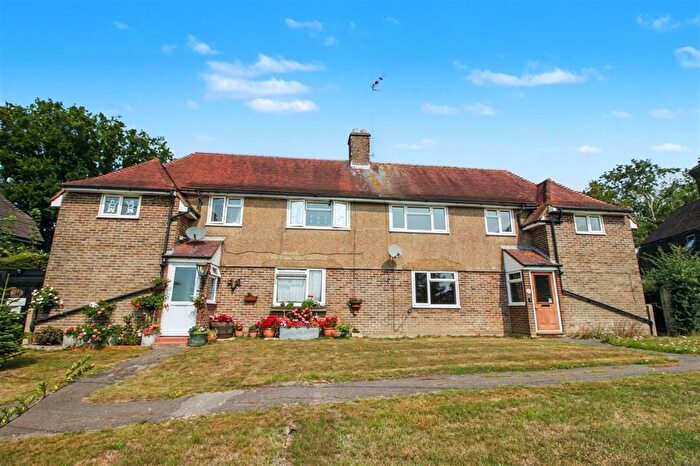
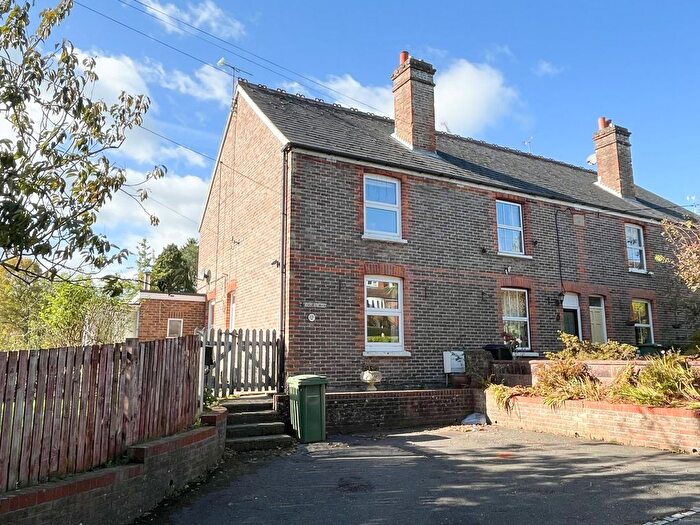
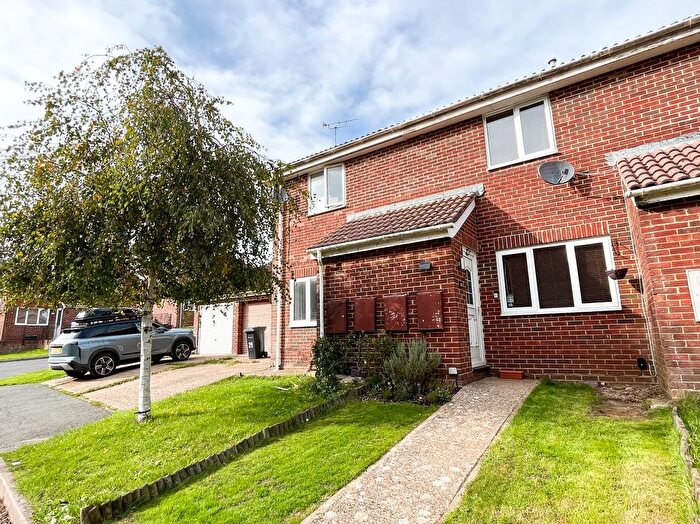
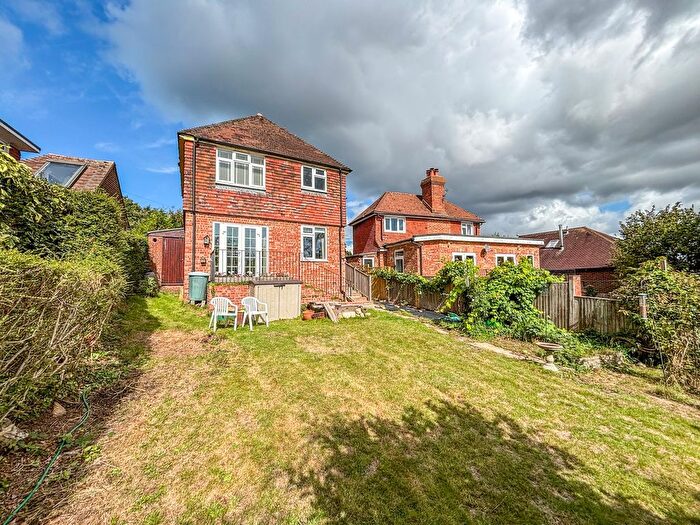
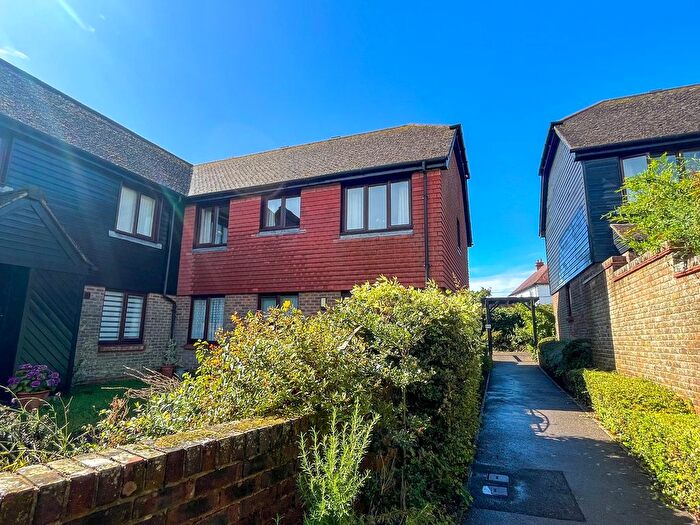
Houses for sale & to rent in Battle Town, Battle
House Prices in Battle Town
Properties in Battle Town have an average house price of £404,742.00 and had 305 Property Transactions within the last 3 years¹.
Battle Town is an area in Battle, East Sussex with 2,262 households², where the most expensive property was sold for £1,400,000.00.
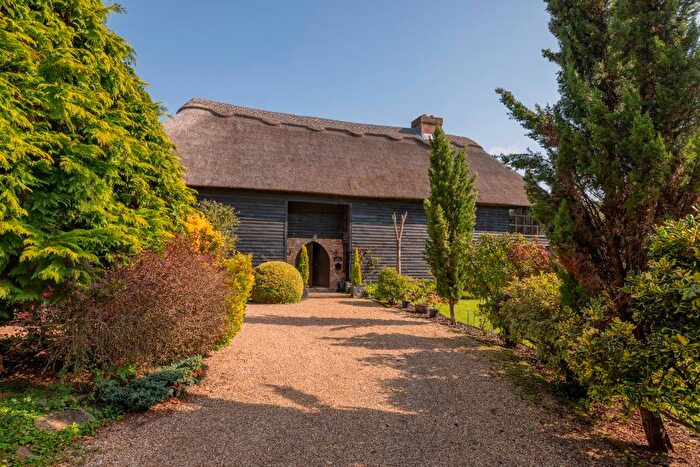
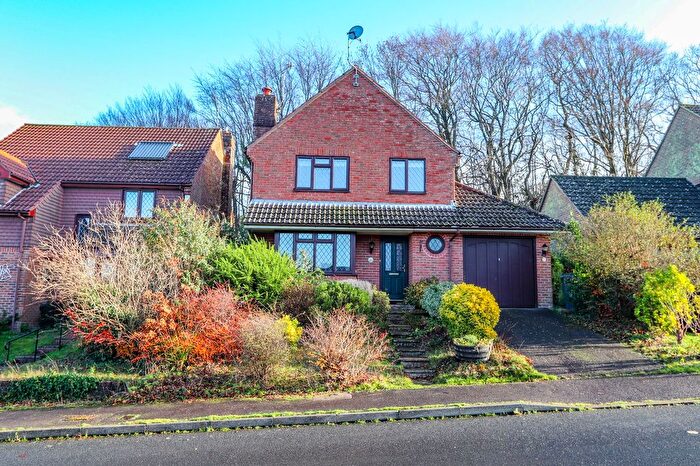
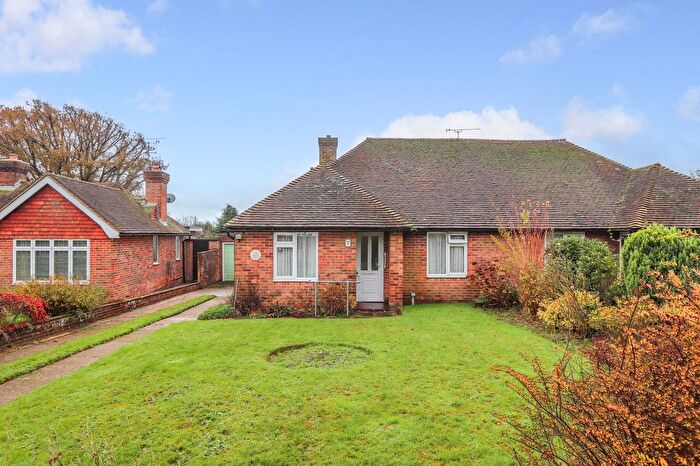
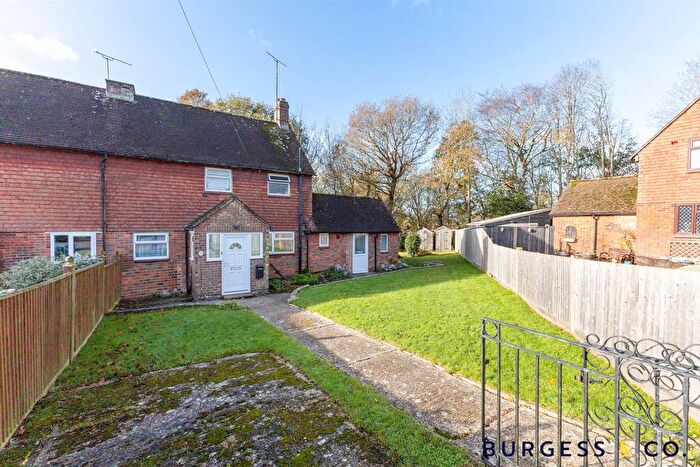
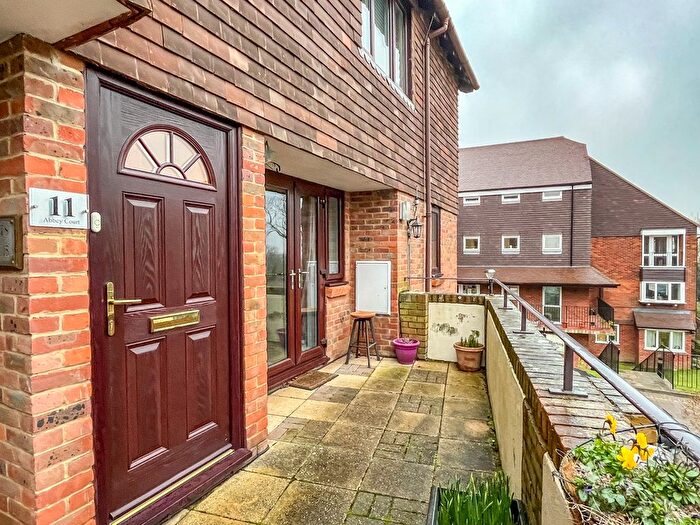
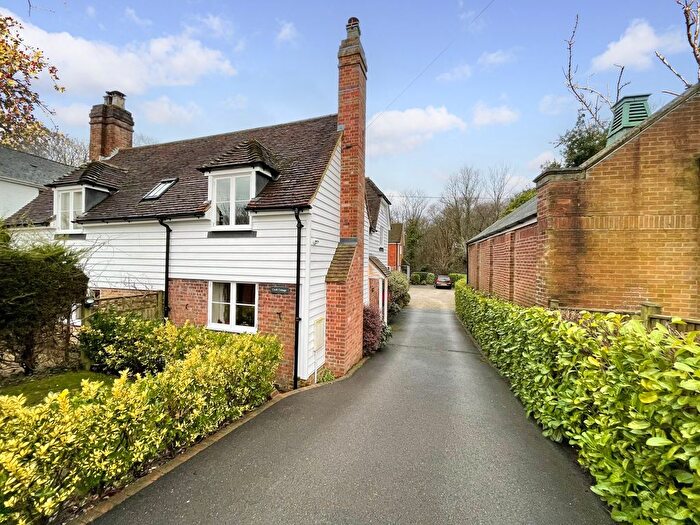
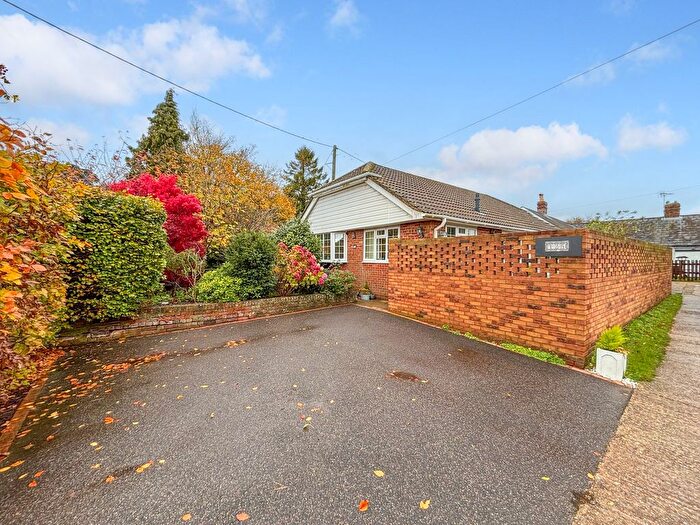
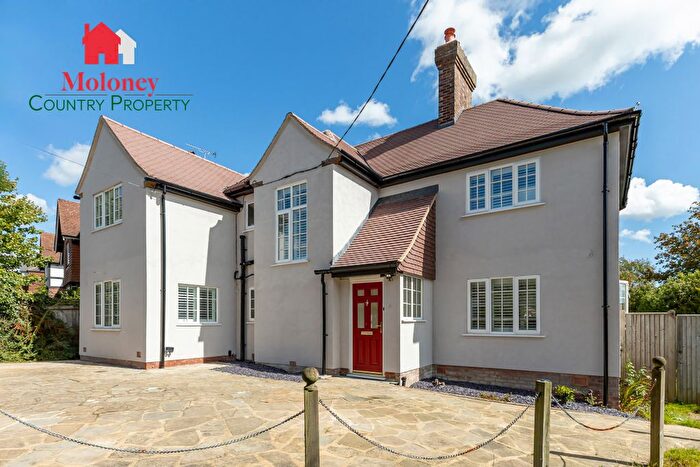
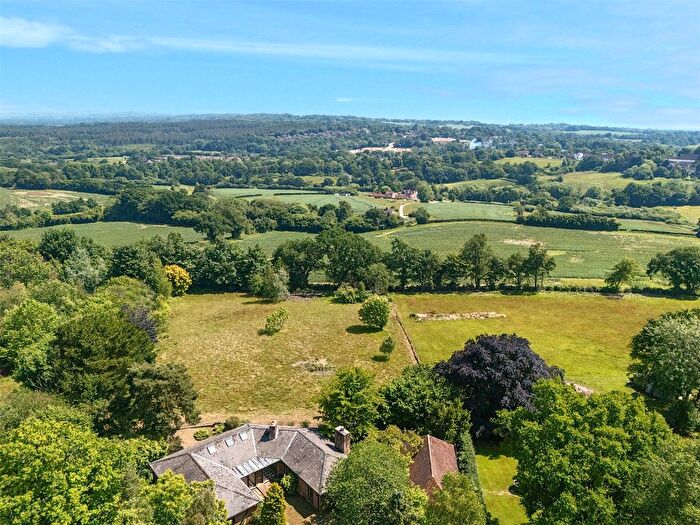
Properties for sale in Battle Town
Previously listed properties in Battle Town
Roads and Postcodes in Battle Town
Navigate through our locations to find the location of your next house in Battle Town, Battle for sale or to rent.
| Streets | Postcodes |
|---|---|
| Abbey Way | TN33 0XD |
| Abbots Close | TN33 0BZ |
| Almonry Fields | TN33 0HX |
| Asten Fields | TN33 0HP TN33 0HR |
| Battle Gates | TN33 0JD |
| Battle Hill | TN33 0BN TN33 0BT TN33 0BX TN33 0DA |
| Bowmans Drive | TN33 0LT TN33 0LU |
| Caldbec Hill | TN33 0JS TN33 0JT TN33 0JU TN33 0JX TN33 0JY |
| Canadia Road | TN33 0LR |
| Chain Lane | TN33 0HG |
| Claverham Close | TN33 0JF |
| Claverham Way | TN33 0JE |
| Coronation Gardens | TN33 0DN TN33 0DW |
| Dukes Hill | TN33 0LD |
| Falconers Drive | TN33 0DT TN33 0DX TN33 0DZ |
| Farthings Lane | TN33 9BA |
| Frederick Thatcher Place | TN33 0HW |
| George Mews | TN33 0EA |
| Glengorse | TN33 0LJ TN33 0TX |
| Granary Cottages | TN33 0DE |
| Hampden Close | TN33 0JB |
| Harold Terrace | TN33 0BP |
| Hastings Road | TN33 0TA TN33 0TB |
| High Street | TN33 0AE TN33 0AG TN33 0AQ TN33 0EE TN33 0EN |
| Highgrove | TN33 0EL |
| Isherwood | TN33 0EJ |
| Kane Hythe Road | TN33 9QU |
| Kingsdale Close | TN33 0DP |
| Knights Meadow | TN33 0EW |
| Lamberts Cottages | TN33 0BL |
| Langton Close | TN33 0XH |
| Laurel Gardens | TN33 0FD |
| London Road | TN33 0EU TN33 0LP TN33 0LS |
| Lower Lake | TN33 0AT TN33 0BE |
| Market Road | TN33 0XA |
| Market Square | TN33 0XB |
| Marley Close | TN33 0DH |
| Marley Gardens | TN33 0DJ |
| Marley Lane | TN33 0BA TN33 0BB TN33 0DQ TN33 0RA TN33 0RB TN33 0RE |
| Marley Rise | TN33 0DL |
| Meadow Bank | TN33 0DG |
| Mitre Way | TN33 0BQ |
| Mount Street | TN33 0EG TN33 0EP TN33 0ER TN33 0LX |
| Mountjoy | TN33 0EQ |
| Netherfield Road | TN33 0HH TN33 0HJ TN33 0HL |
| Norman Close | TN33 0BD |
| North Trade Road | TN33 0EX TN33 0HA TN33 0HB TN33 0HN TN33 0HS TN33 0HU TN33 9LJ |
| Oakhurst Road | TN33 0JL |
| Old Mill Walk | TN33 0AR |
| Olivers Mews | TN33 0DS |
| Parks Yard | TN33 0ED |
| Peppering Eye | TN33 0ST |
| Picardy Close | TN33 0AZ |
| Powdermill Lane | TN33 0SP TN33 0SU TN33 0SX TN33 0SY |
| Prospect Cottages | TN33 0JR |
| Raven Court | TN33 0DD |
| Rowbarns | TN33 0JQ |
| Rue De Bayeux | TN33 0EB TN33 0EF |
| Saxonwood Road | TN33 0EY |
| Senlac Gardens | TN33 0AX |
| Shirlea View | TN33 0UU |
| St Martins Way | TN33 0TZ |
| St Marys Terrace | TN33 0BU |
| St Marys Villas | TN33 0BY |
| Starrs Green Lane | TN33 0TD |
| Starrs Mead | TN33 0UB TN33 0UG TN33 0UH |
| Station Approach | TN33 0BG |
| Sunny Rise | TN33 0GF |
| Swallow Drive | TN33 0DY |
| Tanyard Cottages | TN33 0BH |
| Telham Lane | TN33 0SR |
| The Cloisters | TN33 0JW |
| The Coppice | TN33 0UJ |
| The Grove | TN33 0UN |
| The Nook | TN33 0BJ |
| The Spinney | TN33 0UL |
| Tollgates | TN33 0JA |
| Uckham Lane | TN33 0JP TN33 0LY TN33 0LZ |
| Upper Lake | TN33 0AN TN33 0AW |
| Vale Road | TN33 0HE |
| Virgins Croft | TN33 0JJ |
| Virgins Lane | TN33 0JH |
| Walden Terrace | TN33 0AU |
| Wattles Wish | TN33 0JG |
| Wellington Gardens | TN33 0HD |
| Western Avenue | TN33 0ES |
| Whatlington Road | TN33 0JN |
| William Terrace | TN33 0BW |
| Woodhams Close | TN33 0XE |
| Wren Court | TN33 0DU |
| TN33 0AY |
Transport near Battle Town
- FAQ
- Price Paid By Year
- Property Type Price
Frequently asked questions about Battle Town
What is the average price for a property for sale in Battle Town?
The average price for a property for sale in Battle Town is £404,742. This amount is 16% lower than the average price in Battle. There are 747 property listings for sale in Battle Town.
What streets have the most expensive properties for sale in Battle Town?
The streets with the most expensive properties for sale in Battle Town are Chain Lane at an average of £1,400,000, Powdermill Lane at an average of £926,250 and The Coppice at an average of £725,000.
What streets have the most affordable properties for sale in Battle Town?
The streets with the most affordable properties for sale in Battle Town are St Martins Way at an average of £143,620, Rue De Bayeux at an average of £177,208 and Woodhams Close at an average of £187,428.
Which train stations are available in or near Battle Town?
Some of the train stations available in or near Battle Town are Battle, Crowhurst and Robertsbridge.
Property Price Paid in Battle Town by Year
The average sold property price by year was:
| Year | Average Sold Price | Price Change |
Sold Properties
|
|---|---|---|---|
| 2025 | £476,985 | 12% |
51 Properties |
| 2024 | £420,451 | 10% |
63 Properties |
| 2023 | £379,473 | -0,4% |
95 Properties |
| 2022 | £381,058 | -13% |
96 Properties |
| 2021 | £431,670 | 2% |
138 Properties |
| 2020 | £423,315 | 18% |
91 Properties |
| 2019 | £349,190 | 10% |
67 Properties |
| 2018 | £315,184 | -6% |
97 Properties |
| 2017 | £333,602 | 8% |
108 Properties |
| 2016 | £307,311 | 8% |
115 Properties |
| 2015 | £282,510 | -3% |
128 Properties |
| 2014 | £291,555 | 3% |
121 Properties |
| 2013 | £281,626 | 8% |
111 Properties |
| 2012 | £258,843 | 0,4% |
90 Properties |
| 2011 | £257,708 | -8% |
101 Properties |
| 2010 | £279,151 | 19% |
98 Properties |
| 2009 | £226,158 | -9% |
100 Properties |
| 2008 | £246,657 | -1% |
65 Properties |
| 2007 | £249,015 | 2% |
172 Properties |
| 2006 | £243,787 | 14% |
151 Properties |
| 2005 | £210,216 | -17% |
106 Properties |
| 2004 | £245,254 | 26% |
133 Properties |
| 2003 | £182,600 | 7% |
136 Properties |
| 2002 | £170,532 | 13% |
174 Properties |
| 2001 | £148,146 | 7% |
145 Properties |
| 2000 | £137,382 | 6% |
122 Properties |
| 1999 | £128,936 | 19% |
169 Properties |
| 1998 | £104,446 | 8% |
125 Properties |
| 1997 | £95,644 | 14% |
132 Properties |
| 1996 | £82,415 | 3% |
102 Properties |
| 1995 | £80,204 | - |
83 Properties |
Property Price per Property Type in Battle Town
Here you can find historic sold price data in order to help with your property search.
The average Property Paid Price for specific property types in the last three years are:
| Property Type | Average Sold Price | Sold Properties |
|---|---|---|
| Semi Detached House | £390,361.00 | 72 Semi Detached Houses |
| Detached House | £622,597.00 | 97 Detached Houses |
| Terraced House | £332,301.00 | 57 Terraced Houses |
| Flat | £202,621.00 | 79 Flats |

