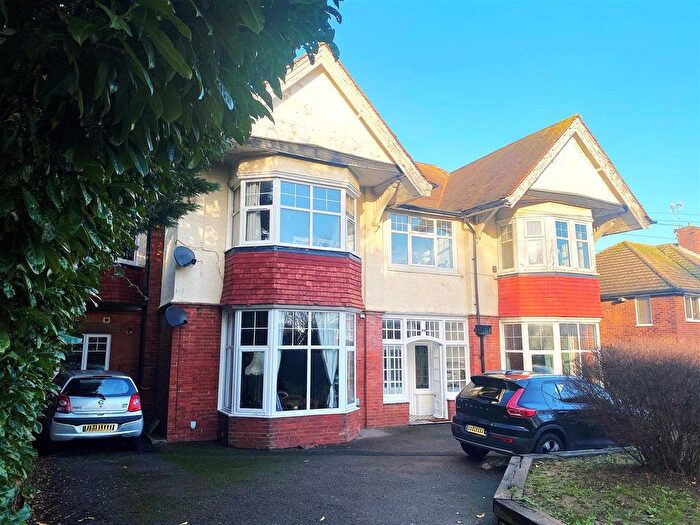
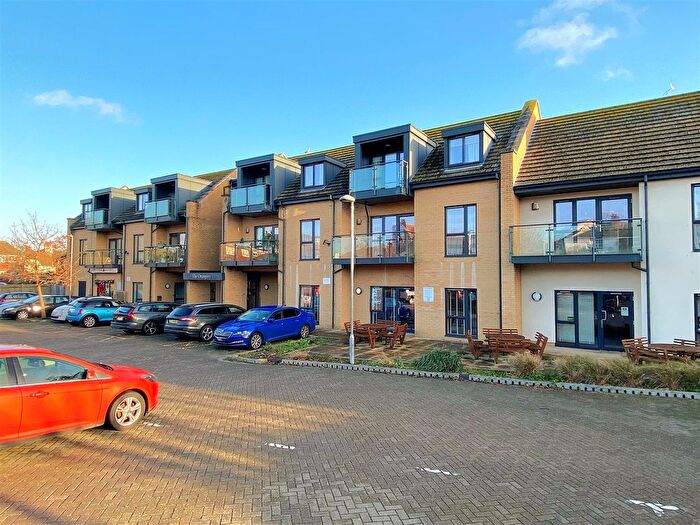
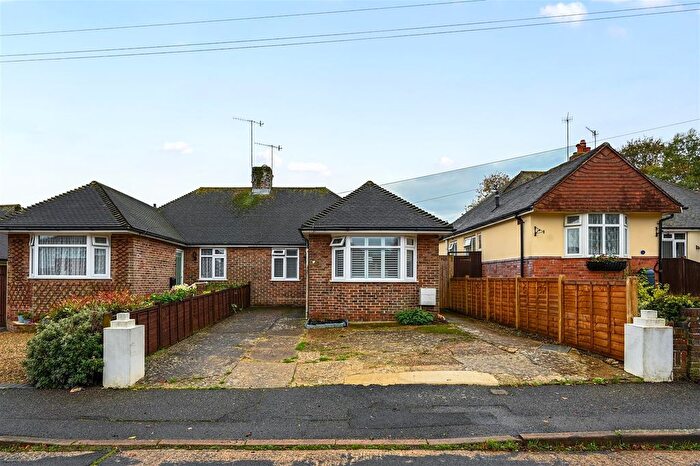
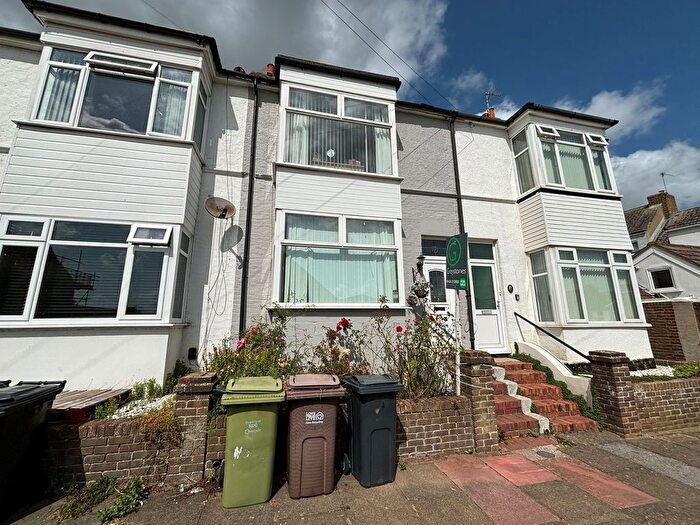
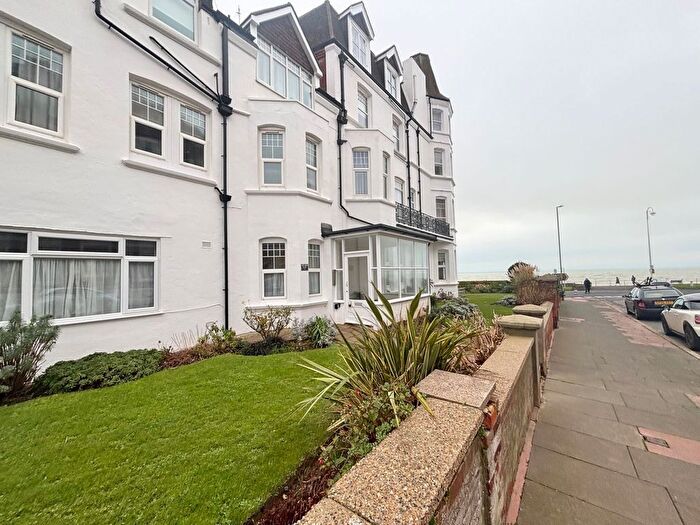
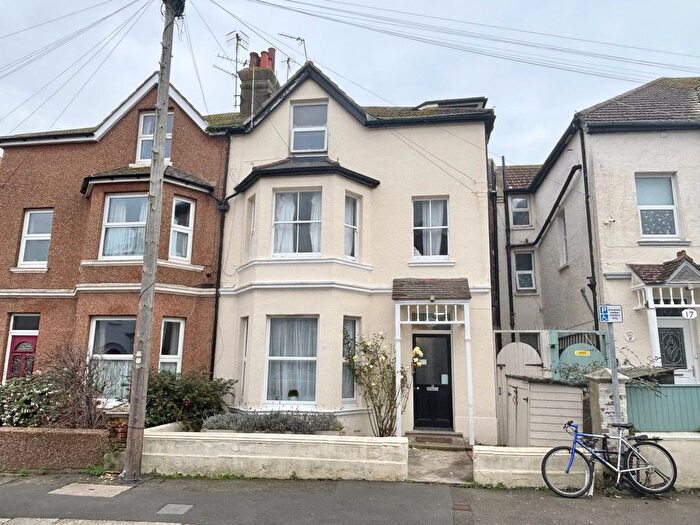
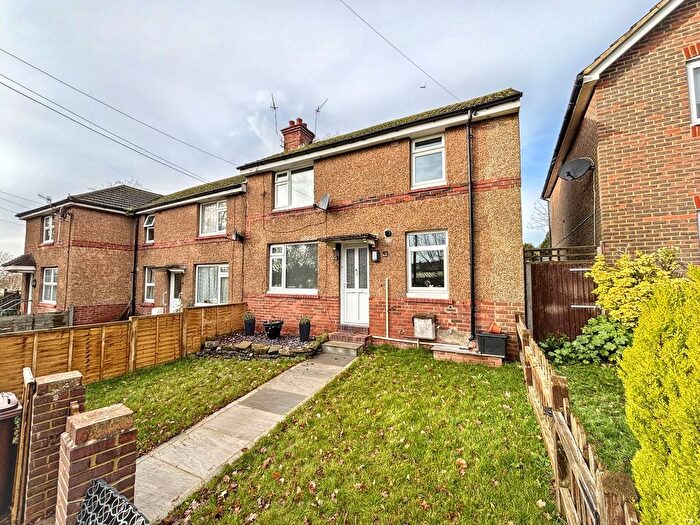
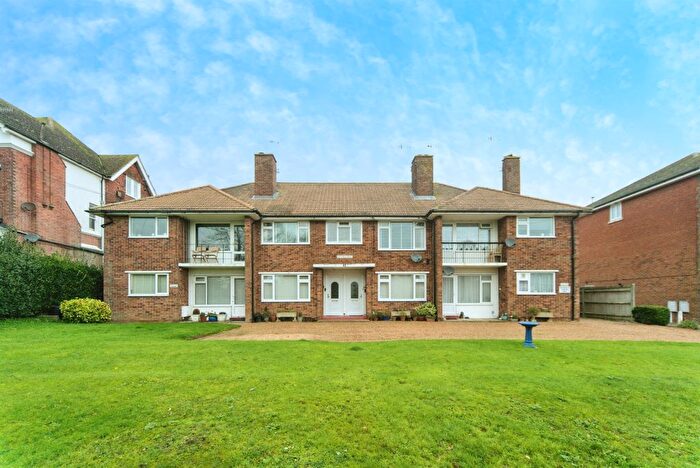
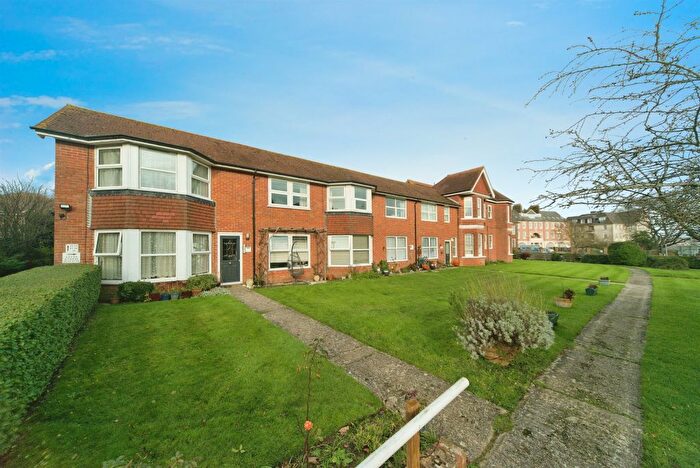
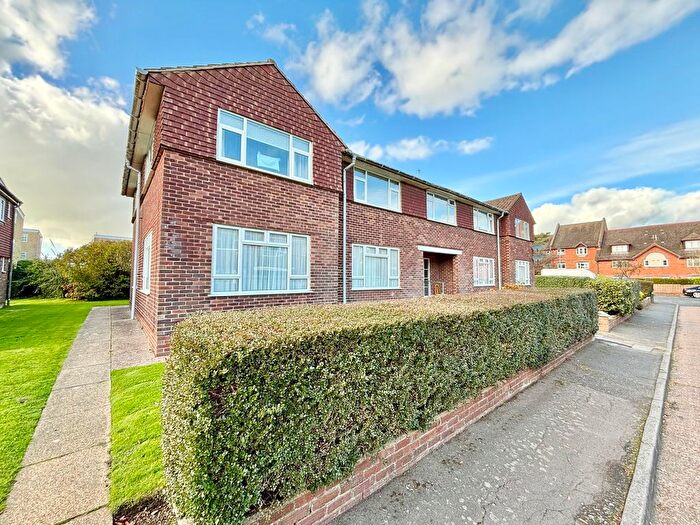
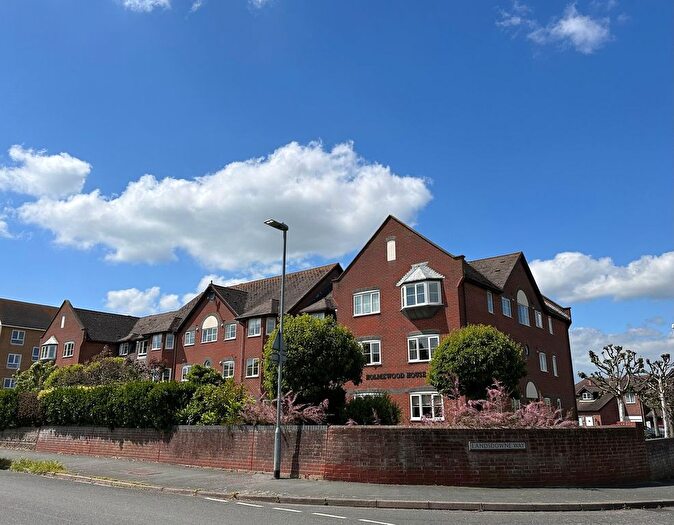
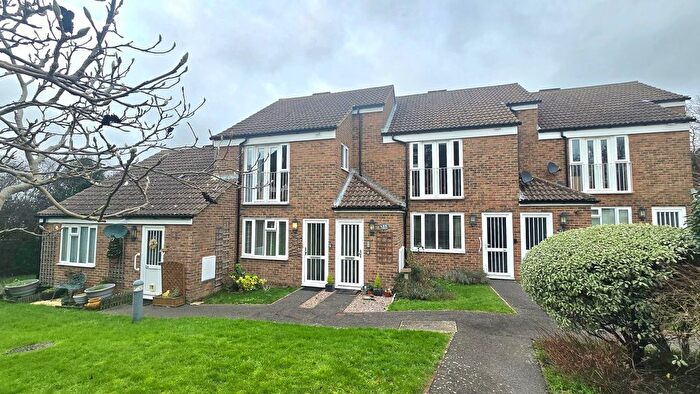
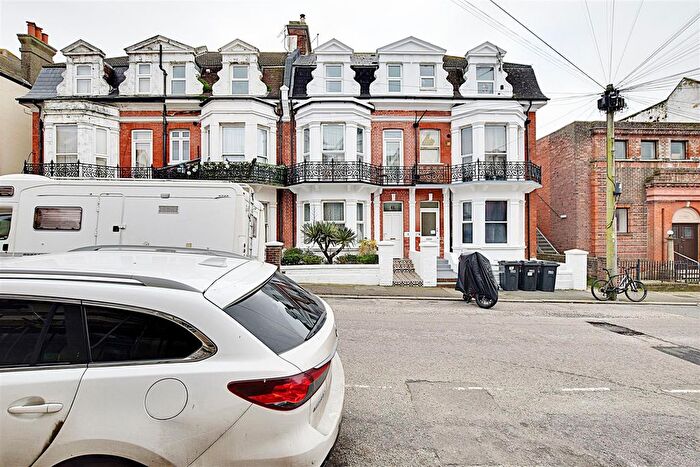
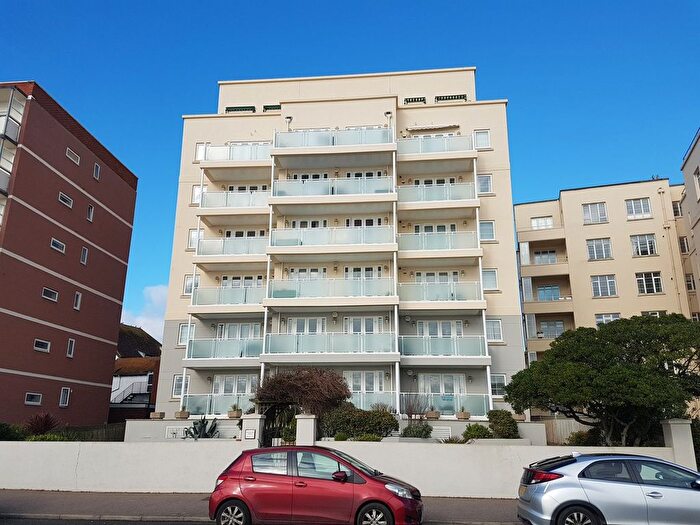
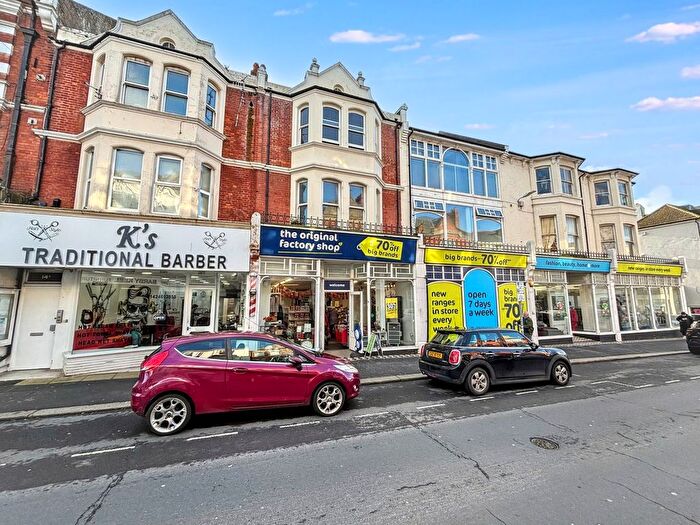
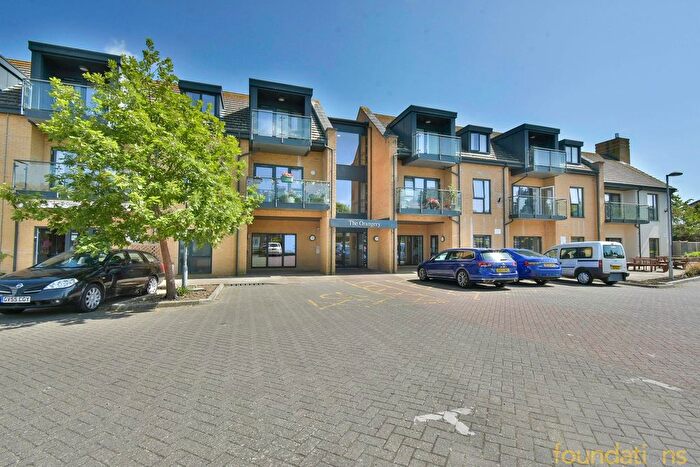
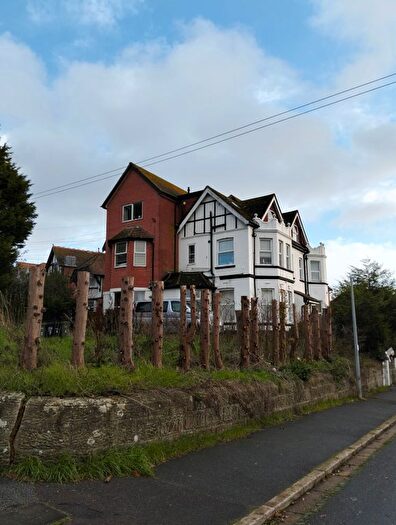
Houses for sale & to rent in Old Town, Bexhill-on-sea
House Prices in Old Town
Properties in Old Town have an average house price of £328,935.00 and had 264 Property Transactions within the last 3 years¹.
Old Town is an area in Bexhill-on-sea, East Sussex with 1,604 households², where the most expensive property was sold for £980,510.00.
Properties for sale in Old Town
Previously listed properties in Old Town
Roads and Postcodes in Old Town
Navigate through our locations to find the location of your next house in Old Town, Bexhill-on-sea for sale or to rent.
| Streets | Postcodes |
|---|---|
| Abbey View | TN40 2LR |
| Barrack Road | TN40 2AT TN40 2AZ |
| Belle Hill | TN40 2AP |
| Bodiam Avenue | TN40 2LS |
| Camber Close | TN40 2NA |
| Chantry Avenue | TN40 2EA TN40 2EB |
| Chartres | TN40 2NG |
| Chartres Close | TN40 2NQ |
| Church Street | TN40 2EU TN40 2HE |
| Church Vale Road | TN40 2ED |
| Constable Way | TN40 2UH |
| De La Warr Road | TN40 2HG |
| Gainsborough Road | TN40 2UL |
| Georgian Close | TN40 2NN |
| Goodwood Close | TN40 2EQ |
| Hanover Close | TN40 2AU |
| Hastings Road | TN40 2HJ TN40 2HL TN40 2HY TN40 2LX TN40 2LY TN40 2NH TN40 2NJ |
| Havelock Road | TN40 2BY TN40 2BZ |
| High Street | TN40 2HA |
| Holliers Hill | TN40 2DD TN40 2DH TN40 2DR TN40 2DT TN40 2DU TN40 2DY |
| Hunting Close | TN40 2AS |
| Landsdowne Way | TN40 2UR |
| Lansdowne Way | TN40 2UJ TN40 2UN |
| London Road | TN39 4AH TN39 4AJ |
| Lychgates Close | TN40 2EW |
| Maberley Road | TN40 2DB |
| Orchard Close | TN40 2HD |
| Orchard Road | TN40 2DQ |
| Paddock Close | TN40 2EG |
| Pipers Close | TN40 2AX |
| Plumpton Close | TN40 2DG |
| Portfield Close | TN40 2ER |
| Rafati Way | TN40 2EX |
| Rectory Way | TN40 2EN |
| Renown Close | TN40 2LQ |
| Reynolds Drive | TN40 2UP |
| Sandown Way | TN40 2NL |
| Sedgewick Road | TN40 2DA |
| Silvester Road | TN40 2AY |
| St Annes Close | TN40 2EL |
| St James Avenue | TN40 2DN TN40 2DW |
| St James Close | TN40 2DP |
| St James Crescent | TN40 2DL |
| St James Road | TN40 2DE TN40 2DF TN40 2DJ |
| St Johns Road | TN40 2EE TN40 2EF |
| St Peters Crescent | TN40 2EH TN40 2EJ |
| Sycamore Walk | TN40 2FD |
| Tamarisk Gardens | TN40 2NP |
| The Briary | TN40 2ET |
| The Glades | TN40 2NE TN40 2NF |
| Turner Close | TN40 2UG |
| Wrestwood Close | TN40 2LW |
| Wrestwood Road | TN40 2LJ TN40 2LL TN40 2LN TN40 2LP TN40 2LT |
| Wychurst Gardens | TN40 2EP |
Transport near Old Town
- FAQ
- Price Paid By Year
- Property Type Price
Frequently asked questions about Old Town
What is the average price for a property for sale in Old Town?
The average price for a property for sale in Old Town is £328,935. This amount is 3% lower than the average price in Bexhill-on-sea. There are 2,406 property listings for sale in Old Town.
What streets have the most expensive properties for sale in Old Town?
The streets with the most expensive properties for sale in Old Town are Gainsborough Road at an average of £552,500, Belle Hill at an average of £517,500 and Pipers Close at an average of £465,000.
What streets have the most affordable properties for sale in Old Town?
The streets with the most affordable properties for sale in Old Town are Georgian Close at an average of £187,600, Hastings Road at an average of £220,623 and Orchard Road at an average of £230,000.
Which train stations are available in or near Old Town?
Some of the train stations available in or near Old Town are Bexhill, Collington and Cooden Beach.
Property Price Paid in Old Town by Year
The average sold property price by year was:
| Year | Average Sold Price | Price Change |
Sold Properties
|
|---|---|---|---|
| 2025 | £338,331 | 2% |
37 Properties |
| 2024 | £331,069 | 4% |
86 Properties |
| 2023 | £316,905 | -4% |
52 Properties |
| 2022 | £329,996 | 13% |
89 Properties |
| 2021 | £286,911 | 8% |
102 Properties |
| 2020 | £264,427 | 5% |
69 Properties |
| 2019 | £250,968 | -5% |
82 Properties |
| 2018 | £264,081 | 6% |
83 Properties |
| 2017 | £249,209 | 5% |
85 Properties |
| 2016 | £237,236 | 12% |
90 Properties |
| 2015 | £208,522 | 8% |
104 Properties |
| 2014 | £191,688 | 7% |
90 Properties |
| 2013 | £178,687 | 1% |
72 Properties |
| 2012 | £176,681 | 1% |
63 Properties |
| 2011 | £175,482 | -4% |
58 Properties |
| 2010 | £182,047 | 8% |
58 Properties |
| 2009 | £168,104 | -8% |
68 Properties |
| 2008 | £180,899 | -3% |
63 Properties |
| 2007 | £186,798 | 10% |
133 Properties |
| 2006 | £167,291 | -1% |
137 Properties |
| 2005 | £168,400 | 3% |
102 Properties |
| 2004 | £162,852 | 9% |
126 Properties |
| 2003 | £148,846 | 17% |
108 Properties |
| 2002 | £124,078 | 13% |
130 Properties |
| 2001 | £107,629 | 25% |
132 Properties |
| 2000 | £80,185 | 13% |
92 Properties |
| 1999 | £70,016 | 11% |
148 Properties |
| 1998 | £62,093 | -1% |
102 Properties |
| 1997 | £62,663 | 12% |
103 Properties |
| 1996 | £54,873 | -2% |
106 Properties |
| 1995 | £55,834 | - |
88 Properties |
Property Price per Property Type in Old Town
Here you can find historic sold price data in order to help with your property search.
The average Property Paid Price for specific property types in the last three years are:
| Property Type | Average Sold Price | Sold Properties |
|---|---|---|
| Semi Detached House | £343,833.00 | 77 Semi Detached Houses |
| Detached House | £415,491.00 | 95 Detached Houses |
| Terraced House | £291,258.00 | 37 Terraced Houses |
| Flat | £183,919.00 | 55 Flats |

