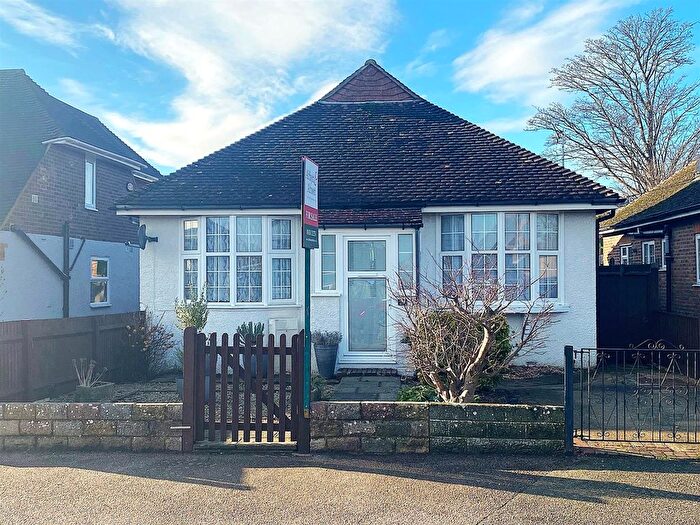
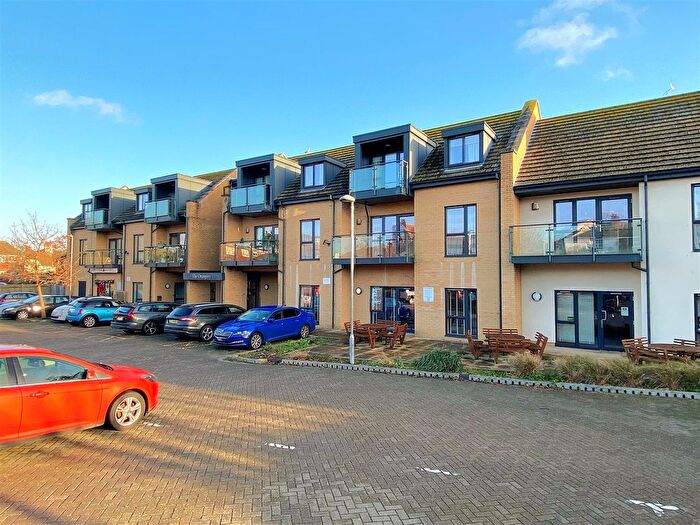
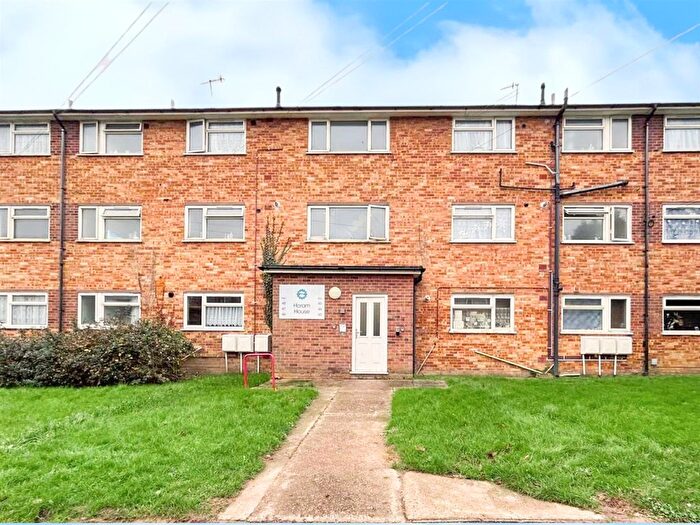
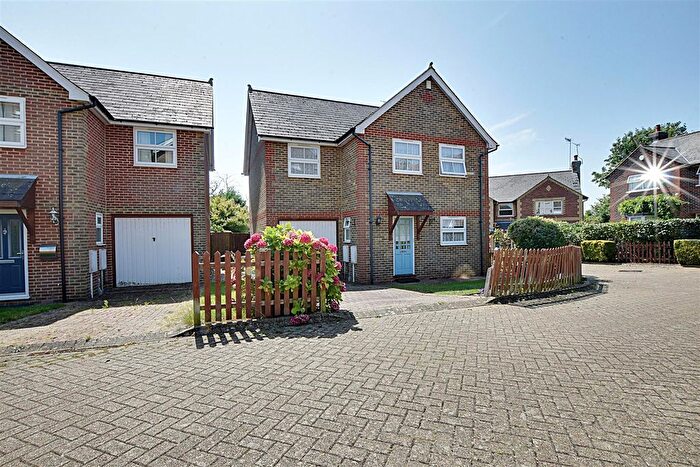
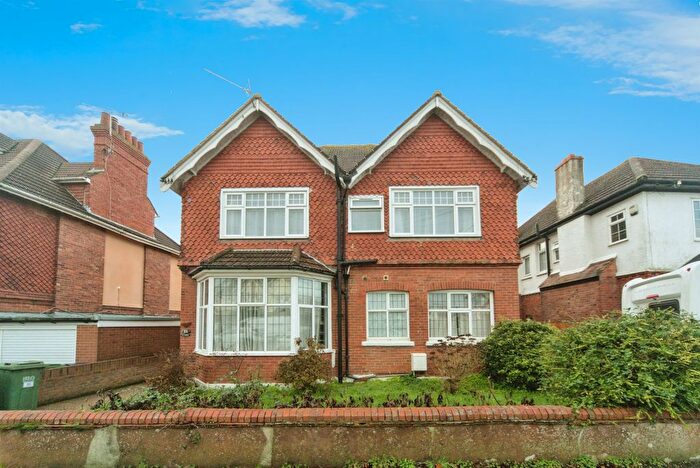
Houses for sale & to rent in St Stephens, Bexhill-on-sea
House Prices in St Stephens
Properties in St Stephens have an average house price of £349,994.00 and had 322 Property Transactions within the last 3 years¹.
St Stephens is an area in Bexhill-on-sea, East Sussex with 2,096 households², where the most expensive property was sold for £1,120,000.00.
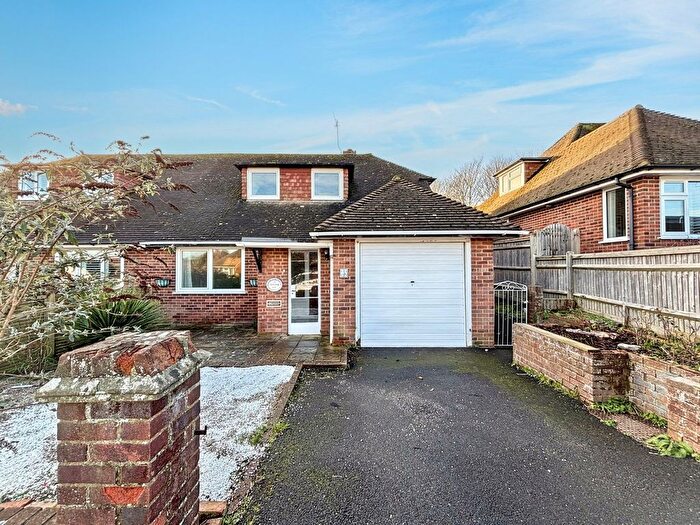
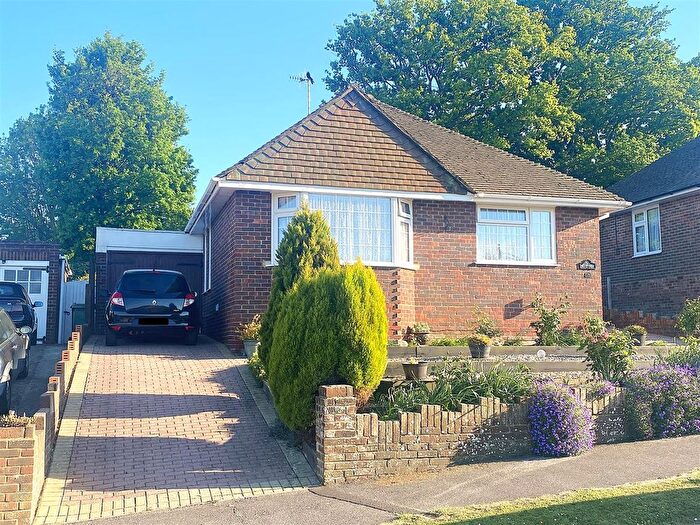
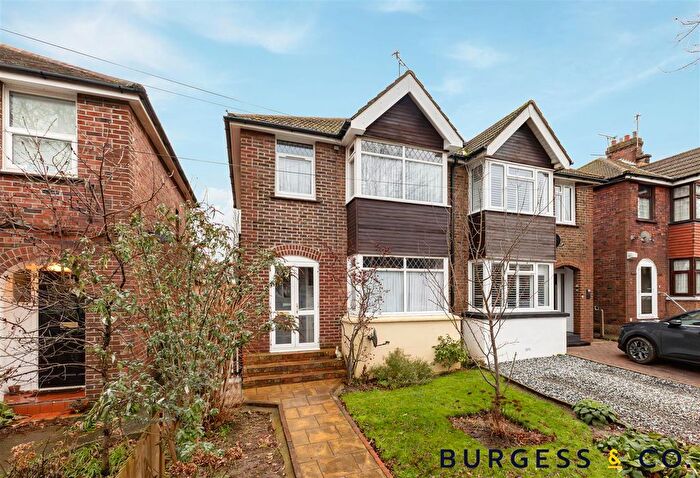
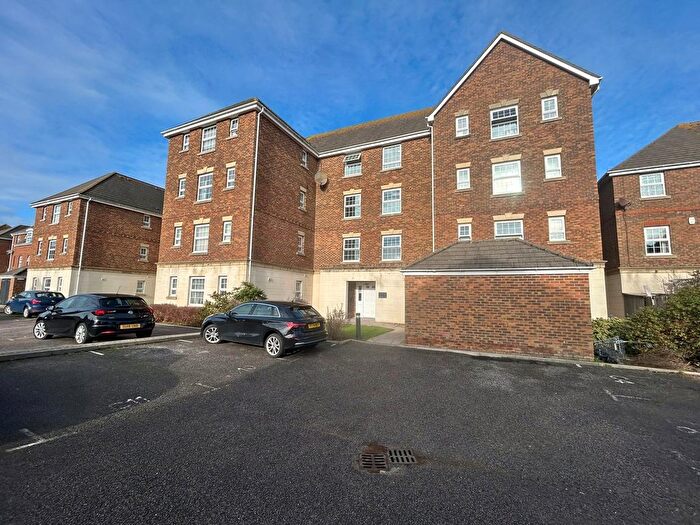
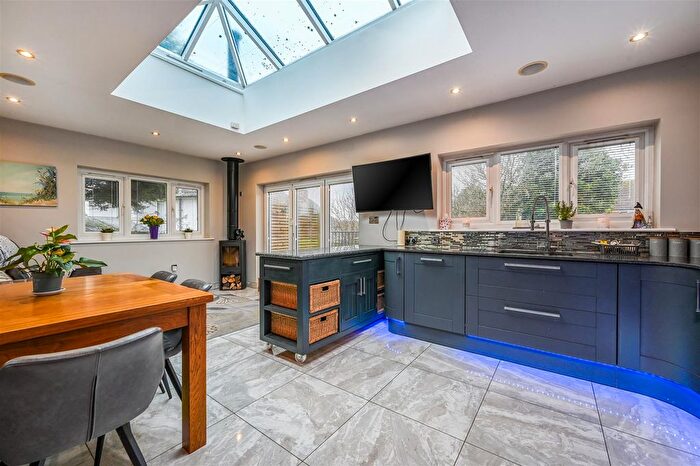
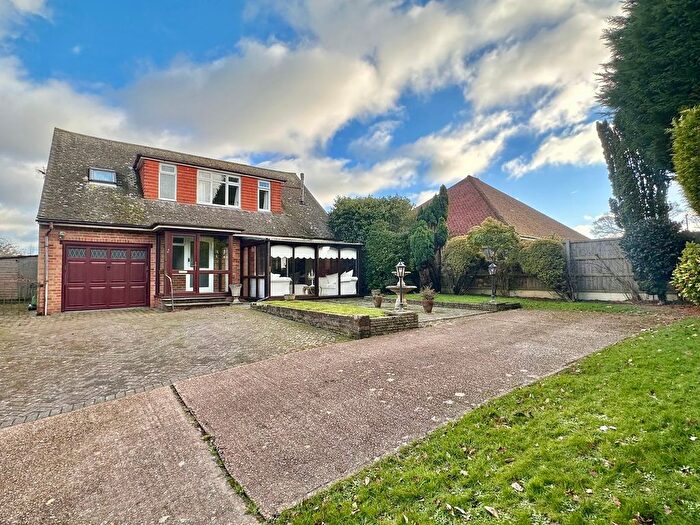
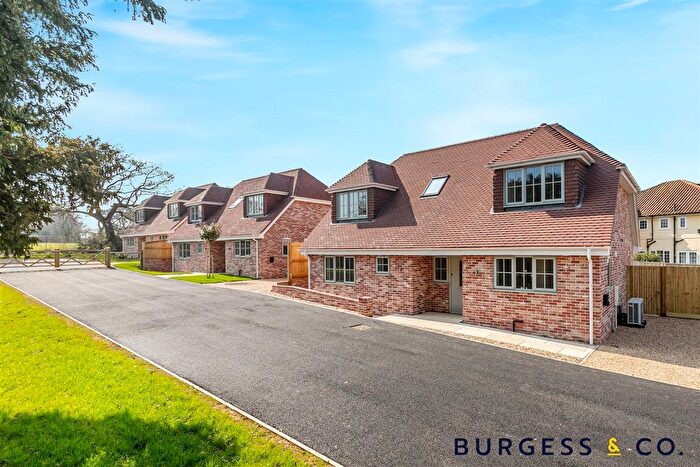
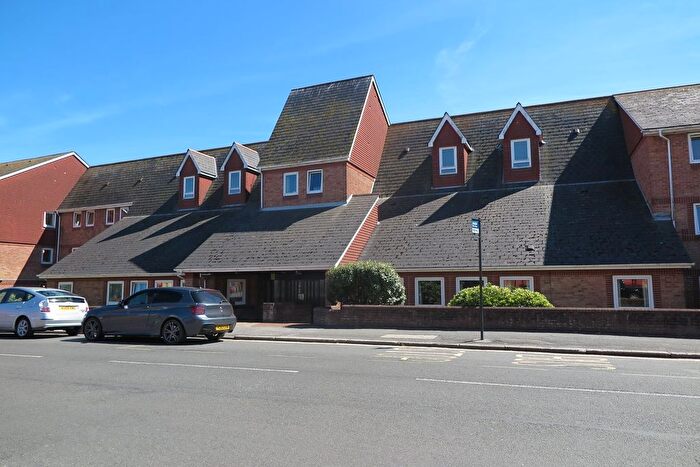
Properties for sale in St Stephens
Roads and Postcodes in St Stephens
Navigate through our locations to find the location of your next house in St Stephens, Bexhill-on-sea for sale or to rent.
| Streets | Postcodes |
|---|---|
| Alder Gardens | TN39 5JY |
| Bancroft Road | TN39 4AG TN39 4AQ |
| Bayencourt North | TN40 2AJ |
| Bayencourt South | TN40 2AH |
| Beaconsfield Road | TN40 2BN TN40 2BW |
| Beatrice Walk | TN39 4EW |
| Bending Crescent | TN40 2AL |
| Bidwell Avenue | TN39 4DB TN39 4DD |
| Bowrey Place | TN40 2AW |
| Broad Oak Lane | TN39 4HE |
| Broad View | TN39 4HN TN39 4HW |
| Buxton Drive | TN39 4AS |
| Cambridge Road | TN40 2BU |
| Chapel Path | TN40 2AA |
| Chichester Close | TN39 4DH |
| Clevedon Road | TN39 4EL |
| Concorde Close | TN39 4LS |
| Crowmere Avenue | TN40 2BA |
| Crowmere Terrace | TN40 2BD |
| Dalehurst Road | TN39 4BN |
| Danecourt Close | TN39 4AR |
| Daresbury Close | TN39 4DR |
| Deans Close | TN39 4DF |
| Deans Drive | TN39 4DE |
| Down Road | TN39 4HD |
| Edinburgh Road | TN40 2AB |
| Ellerslie Lane | TN39 4LJ |
| Elm Close | TN39 5JX |
| Fryatts Way | TN39 4LW |
| Gatelands Drive | TN39 4DP |
| Glenleigh Avenue | TN39 4EG TN39 4EQ |
| Glenleigh Park Road | TN39 4EE TN39 4EH |
| Gordon Place | TN39 4DW |
| Grange Court Drive | TN39 4AY TN39 4AZ |
| Grangecourt Drive | TN39 4AX |
| Greenways | TN39 5HS |
| Gunters Lane | TN39 4EB TN39 4EN TN39 4EP |
| Hazel Grove | TN39 5JW |
| Heatherdune Road | TN39 4HB |
| Hillcrest Avenue | TN39 4DA |
| Hillside Road | TN40 2AN |
| Homelands Close | TN39 4DJ |
| Hornbeam Avenue | TN39 5JQ TN39 5JT |
| King Offa Way | TN40 2UA |
| Kingswood Avenue | TN39 4EJ |
| Lewes Close | TN39 4DQ |
| London Road | TN39 4AA TN39 4AB TN39 4AE |
| Lucy Way | TN39 4DU |
| Mayfair Mews | TN40 2AE |
| Newlands Avenue | TN39 4HA |
| Oak Road | TN40 2BF |
| Oakwood Avenue | TN39 4BU |
| Old Farm Road | TN39 4DN |
| Old Mill Park | TN39 4UD |
| Park Lane | TN39 4DS |
| Pembury Grove | TN39 4BT TN39 4BX |
| Plemont Gardens | TN39 4HH |
| Poplar Close | TN39 5JU |
| Primrose Hill | TN39 4LP |
| Roselands | TN39 4LL |
| Salisbury Road | TN40 2AD |
| Scholars Walk | TN39 5GA TN39 5GB |
| Sewell Avenue | TN40 2BH |
| Springfield Road | TN40 2BJ TN40 2BX |
| St Andrews Road | TN40 2BQ |
| St Davids Avenue | TN40 2BE |
| St Georges Road | TN40 2BG TN40 2BP |
| St Patricks Crescent | TN40 2BB |
| Summer Hill Road | TN39 4LN |
| The Fairway | TN39 4ER |
| Uplands Close | TN39 4EF |
| Ward Way | TN39 4HL |
| West Down Road | TN39 4DY |
| Whitehouse Avenue | TN39 4BS |
| Windmill Drive | TN39 4DG |
| Woodsgate Avenue | TN40 2BL |
| Woodsgate Park | TN39 4AP TN39 4DL TN39 4DT |
Transport near St Stephens
- FAQ
- Price Paid By Year
- Property Type Price
Frequently asked questions about St Stephens
What is the average price for a property for sale in St Stephens?
The average price for a property for sale in St Stephens is £349,994. This amount is 4% higher than the average price in Bexhill-on-sea. There are 1,768 property listings for sale in St Stephens.
What streets have the most expensive properties for sale in St Stephens?
The streets with the most expensive properties for sale in St Stephens are Beatrice Walk at an average of £703,333, Gunters Lane at an average of £675,000 and Ellerslie Lane at an average of £526,343.
What streets have the most affordable properties for sale in St Stephens?
The streets with the most affordable properties for sale in St Stephens are St Davids Avenue at an average of £145,146, King Offa Way at an average of £164,000 and Poplar Close at an average of £165,250.
Which train stations are available in or near St Stephens?
Some of the train stations available in or near St Stephens are Collington, Bexhill and Cooden Beach.
Property Price Paid in St Stephens by Year
The average sold property price by year was:
| Year | Average Sold Price | Price Change |
Sold Properties
|
|---|---|---|---|
| 2025 | £335,071 | -4% |
42 Properties |
| 2024 | £347,364 | 4% |
108 Properties |
| 2023 | £333,378 | -11% |
70 Properties |
| 2022 | £370,327 | 9% |
102 Properties |
| 2021 | £337,283 | 6% |
128 Properties |
| 2020 | £316,082 | 4% |
70 Properties |
| 2019 | £304,271 | 4% |
81 Properties |
| 2018 | £292,665 | 3% |
89 Properties |
| 2017 | £284,385 | 7% |
121 Properties |
| 2016 | £264,005 | 10% |
118 Properties |
| 2015 | £237,628 | 7% |
114 Properties |
| 2014 | £220,457 | 3% |
110 Properties |
| 2013 | £213,669 | 5% |
84 Properties |
| 2012 | £203,646 | 1% |
75 Properties |
| 2011 | £200,600 | -5% |
73 Properties |
| 2010 | £211,361 | 6% |
87 Properties |
| 2009 | £198,803 | 1% |
67 Properties |
| 2008 | £196,883 | -5% |
74 Properties |
| 2007 | £206,568 | 3% |
160 Properties |
| 2006 | £199,834 | 4% |
197 Properties |
| 2005 | £191,760 | 4% |
132 Properties |
| 2004 | £184,251 | 11% |
162 Properties |
| 2003 | £164,325 | 20% |
137 Properties |
| 2002 | £130,893 | 15% |
116 Properties |
| 2001 | £110,778 | 13% |
129 Properties |
| 2000 | £96,382 | 10% |
121 Properties |
| 1999 | £86,657 | 23% |
167 Properties |
| 1998 | £66,997 | -2% |
114 Properties |
| 1997 | £68,225 | 12% |
123 Properties |
| 1996 | £60,364 | 0,4% |
123 Properties |
| 1995 | £60,101 | - |
82 Properties |
Property Price per Property Type in St Stephens
Here you can find historic sold price data in order to help with your property search.
The average Property Paid Price for specific property types in the last three years are:
| Property Type | Average Sold Price | Sold Properties |
|---|---|---|
| Semi Detached House | £335,965.00 | 96 Semi Detached Houses |
| Detached House | £446,543.00 | 137 Detached Houses |
| Terraced House | £273,176.00 | 38 Terraced Houses |
| Flat | £174,284.00 | 51 Flats |

