
Houses for sale & to rent in Eastbourne, East Sussex
House Prices in Eastbourne
Properties in Eastbourne have an average house price of £319,186.00 and had 6,941 Property Transactions within the last 3 years.¹
Eastbourne is an area in East Sussex with 48,613 households², where the most expensive property was sold for £2,200,000.00.
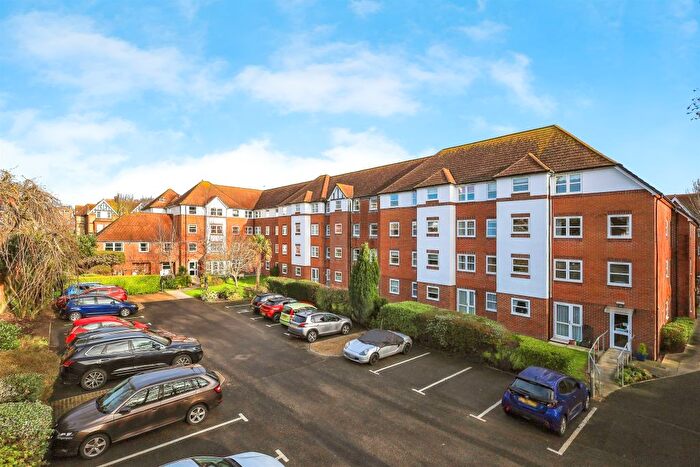
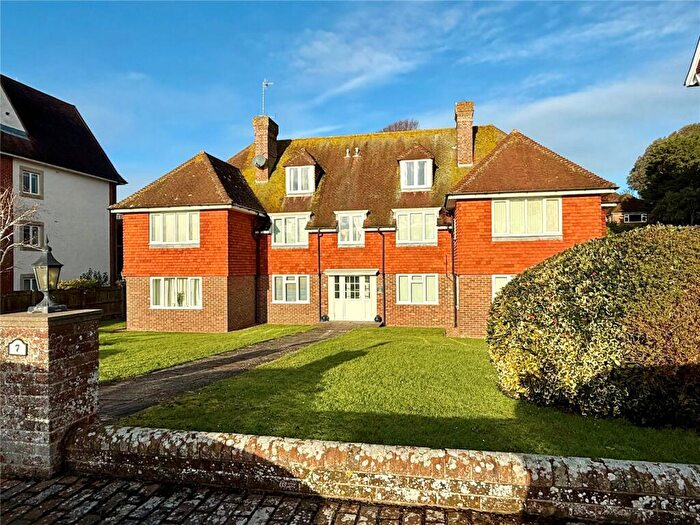
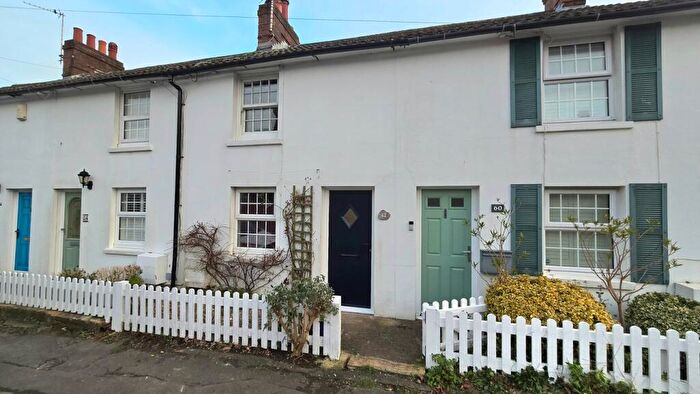
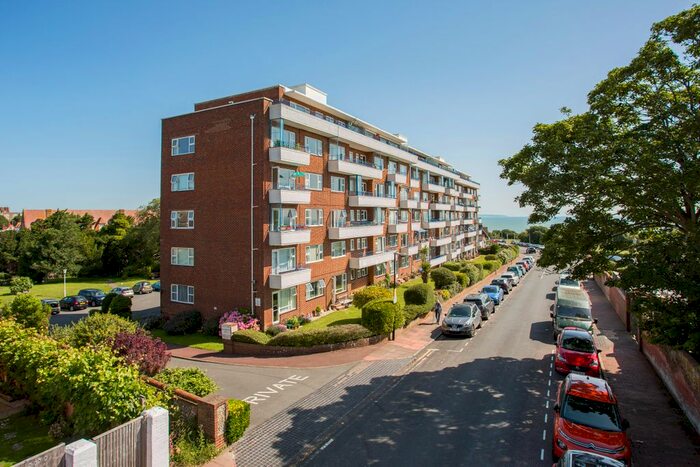
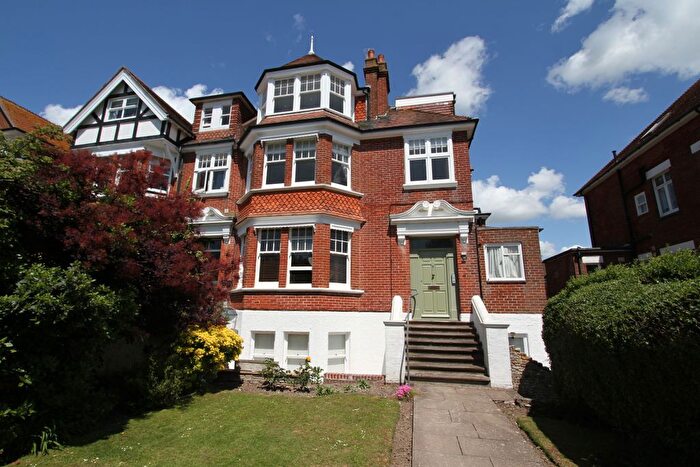
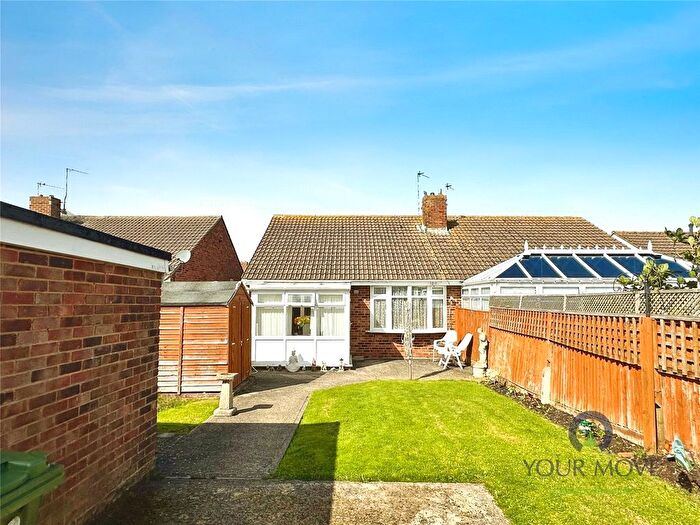
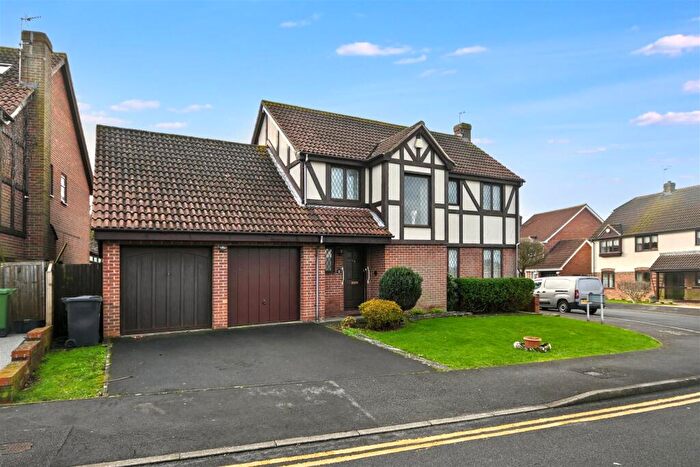
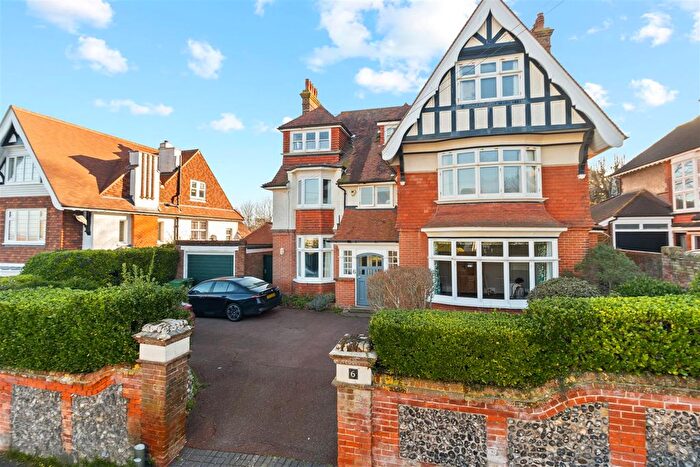
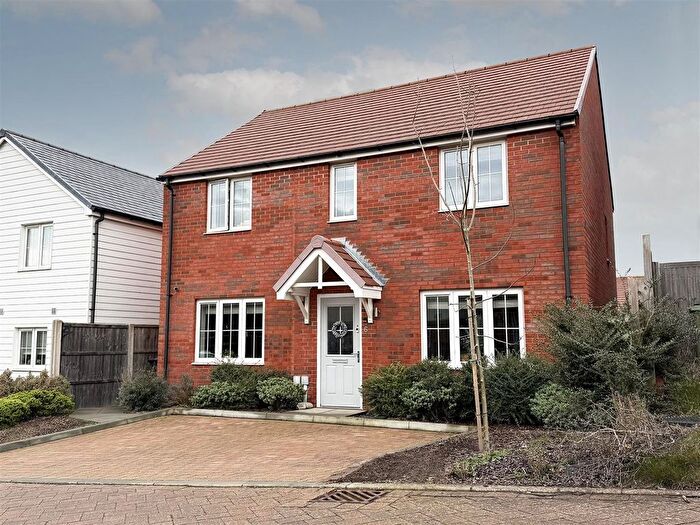
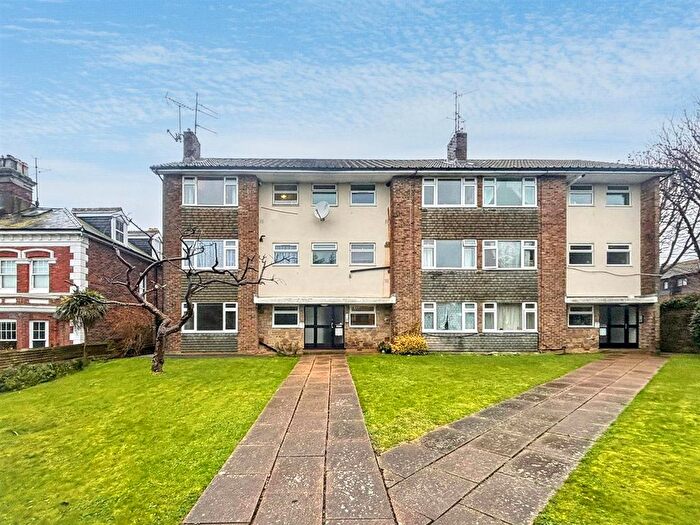
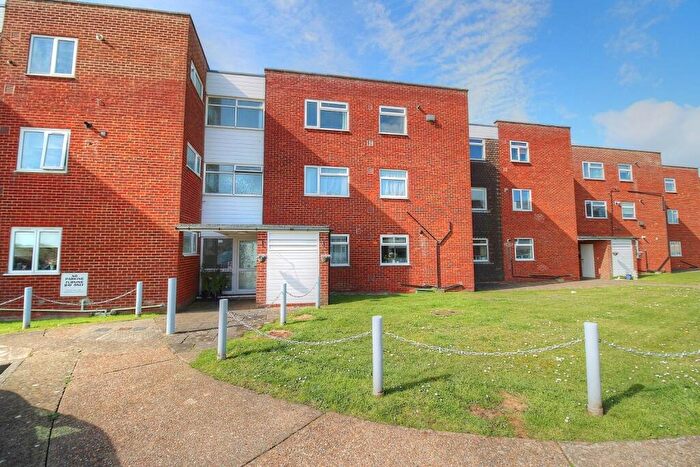
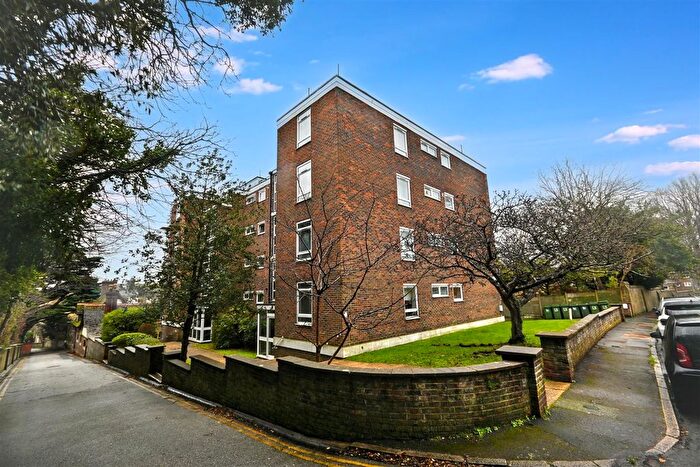
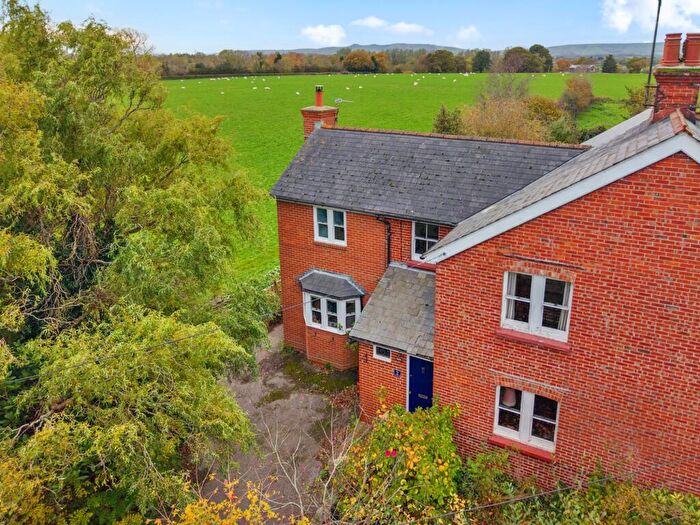
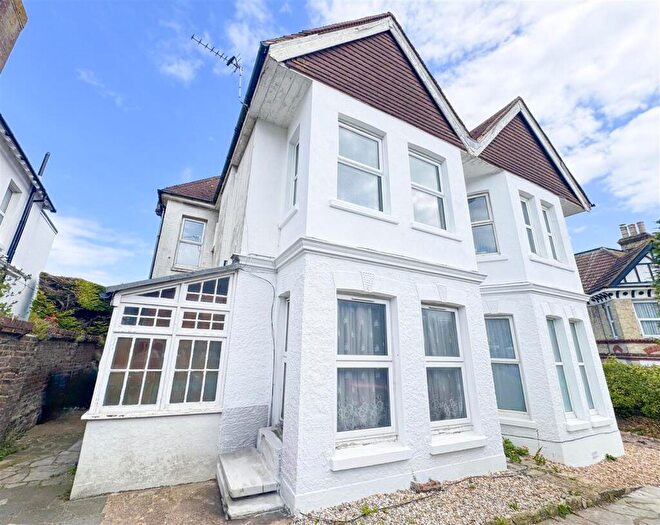
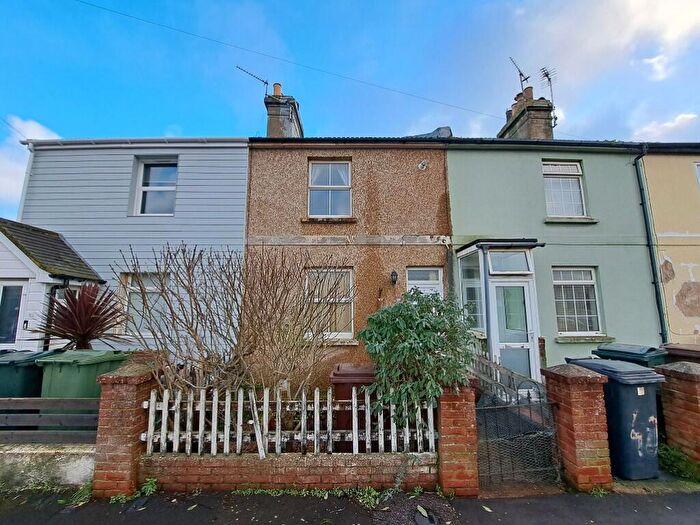
Properties for sale in Eastbourne
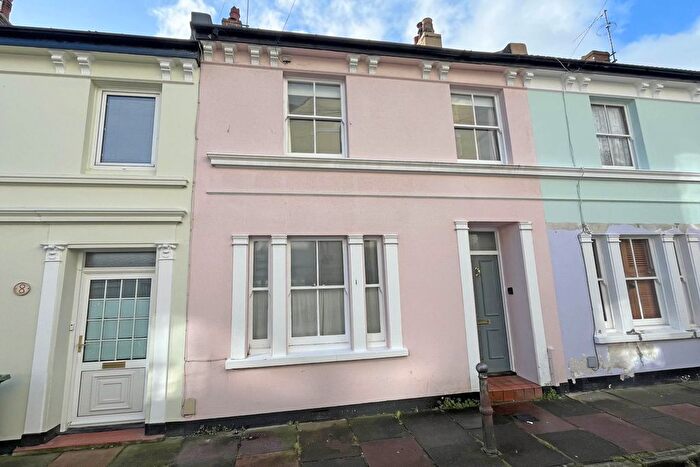
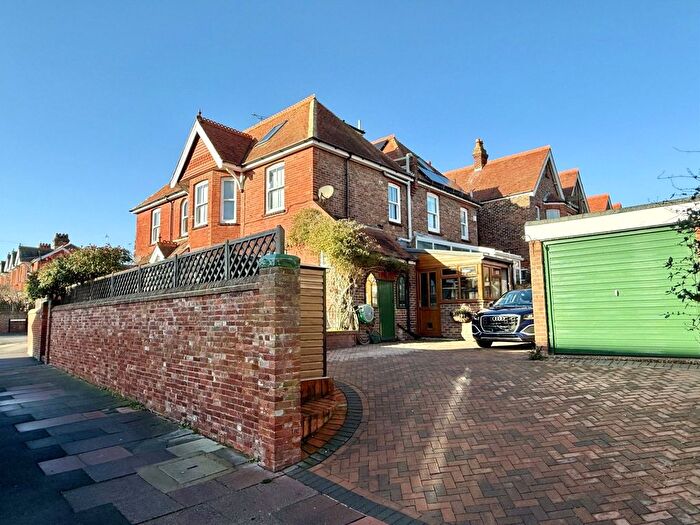
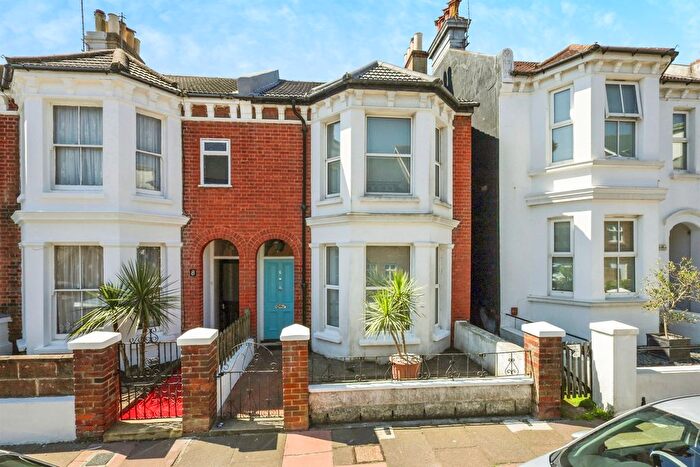
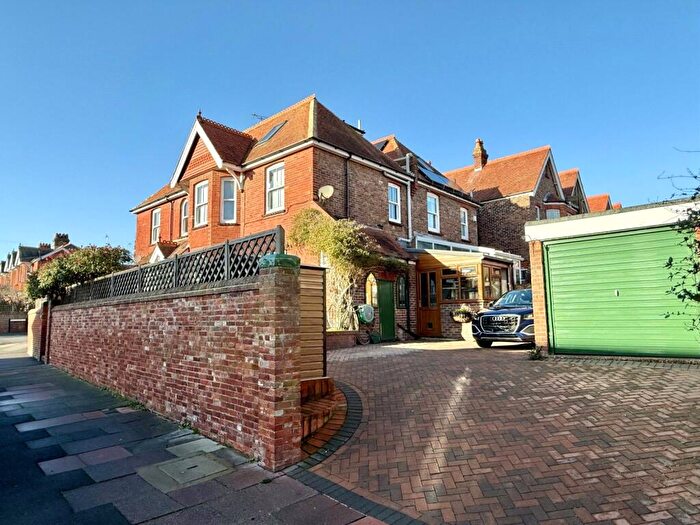
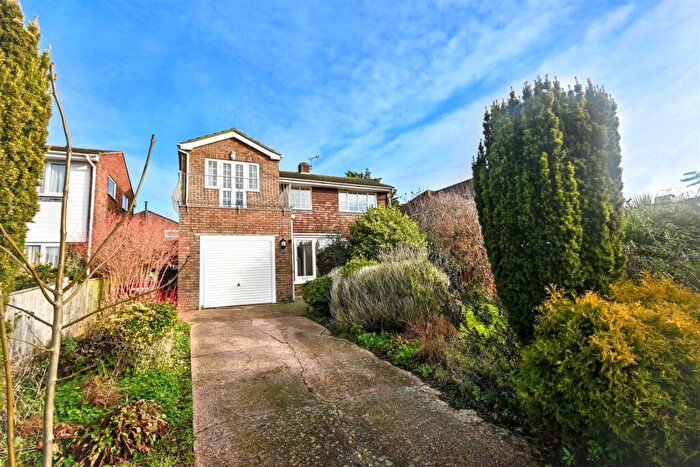
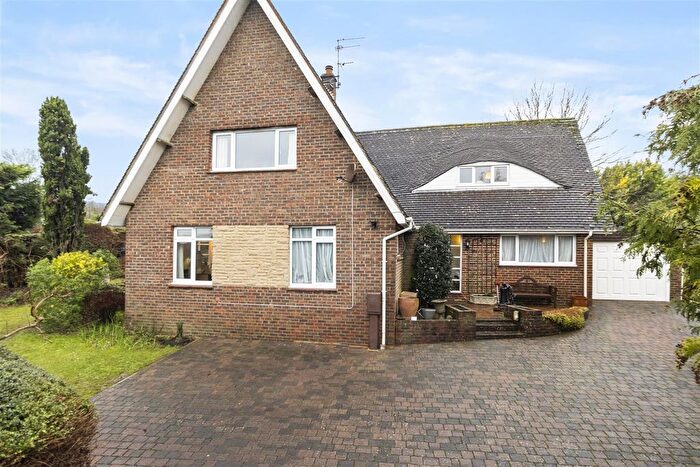
![]()
If you are looking to sell your house, let it out, or receive a property valuation, an expert can help you.
Click the button below to get started.
Neighbourhoods in Eastbourne
Navigate through our locations to find the location of your next house in Eastbourne, East Sussex for sale or to rent.
Transport in Eastbourne
Please see below transportation links in this area:

- FAQ
- Price Paid By Year
- Property Type Price
Frequently asked questions about Eastbourne
What is the average price for a property for sale in Eastbourne?
The average price for a property for sale in Eastbourne is £319,186. This amount is 18% lower than the average price in East Sussex. There are more than 10,000 property listings for sale in Eastbourne.
What locations have the most expensive properties for sale in Eastbourne?
The locations with the most expensive properties for sale in Eastbourne are South Downs at an average of £992,500, East Dean at an average of £776,060 and Ratton at an average of £421,733.
What locations have the most affordable properties for sale in Eastbourne?
The locations with the most affordable properties for sale in Eastbourne are Devonshire at an average of £244,609, Hampden Park at an average of £268,596 and Upperton at an average of £276,603.
Which train stations are available in or near Eastbourne?
Some of the train stations available in or near Eastbourne are Eastbourne, Hampden Park and Pevensey and Westham.
Property Price Paid in Eastbourne by Year
The average sold property price by year was:
| Year | Average Sold Price | Price Change |
Sold Properties
|
|---|---|---|---|
| 2025 | £307,758 | -3% |
1,173 Properties |
| 2024 | £317,344 | 0,1% |
1,843 Properties |
| 2023 | £316,908 | -4% |
1,661 Properties |
| 2022 | £328,278 | 7% |
2,264 Properties |
| 2021 | £305,736 | 5% |
2,753 Properties |
| 2020 | £290,511 | 5% |
1,791 Properties |
| 2019 | £274,838 | 2% |
1,958 Properties |
| 2018 | £270,185 | 3% |
2,123 Properties |
| 2017 | £261,857 | 5% |
2,374 Properties |
| 2016 | £249,176 | 9% |
2,609 Properties |
| 2015 | £226,505 | 3% |
2,558 Properties |
| 2014 | £219,438 | 7% |
2,592 Properties |
| 2013 | £204,789 | 0,4% |
2,281 Properties |
| 2012 | £203,962 | 1% |
1,713 Properties |
| 2011 | £202,065 | -5% |
1,751 Properties |
| 2010 | £212,609 | 9% |
1,755 Properties |
| 2009 | £193,459 | -8% |
1,899 Properties |
| 2008 | £208,581 | 1% |
1,588 Properties |
| 2007 | £206,934 | 8% |
3,450 Properties |
| 2006 | £191,223 | 1% |
3,585 Properties |
| 2005 | £188,608 | 7% |
3,104 Properties |
| 2004 | £176,289 | 7% |
3,624 Properties |
| 2003 | £164,653 | 18% |
3,452 Properties |
| 2002 | £135,457 | 16% |
4,000 Properties |
| 2001 | £114,412 | 14% |
3,658 Properties |
| 2000 | £98,957 | 18% |
3,534 Properties |
| 1999 | £80,857 | 8% |
3,591 Properties |
| 1998 | £74,105 | 10% |
2,783 Properties |
| 1997 | £66,359 | 8% |
2,985 Properties |
| 1996 | £61,054 | 1% |
2,665 Properties |
| 1995 | £60,453 | - |
1,976 Properties |
Property Price per Property Type in Eastbourne
Here you can find historic sold price data in order to help with your property search.
The average Property Paid Price for specific property types in the last three years are:
| Property Type | Average Sold Price | Sold Properties |
|---|---|---|
| Semi Detached House | £359,292.00 | 1,159 Semi Detached Houses |
| Terraced House | £315,275.00 | 1,788 Terraced Houses |
| Flat | £221,192.00 | 2,846 Flats |
| Detached House | £527,722.00 | 1,148 Detached Houses |