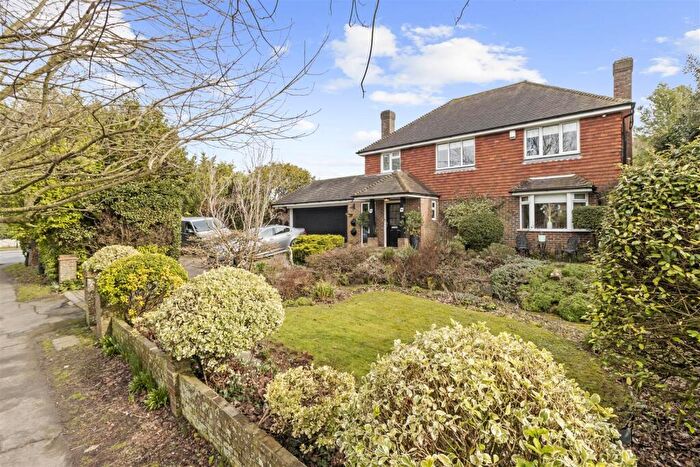
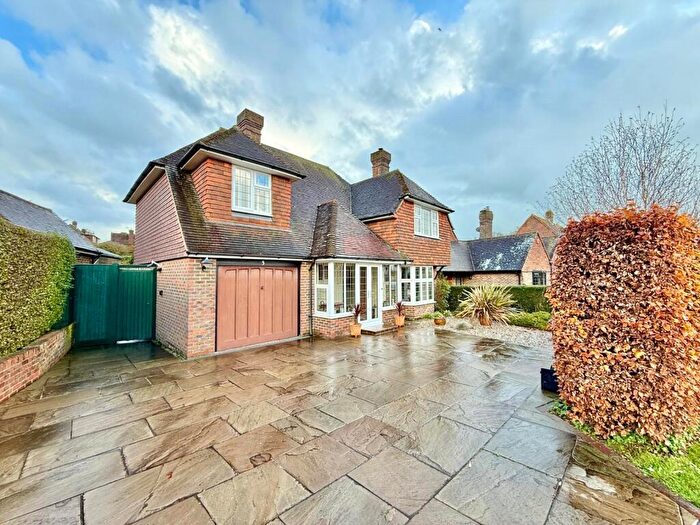
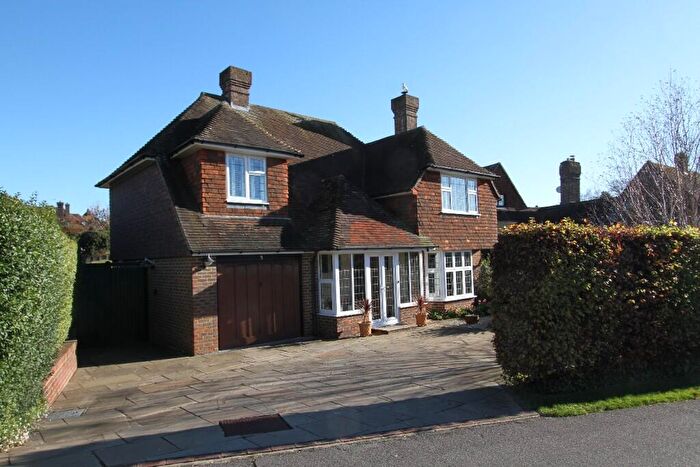
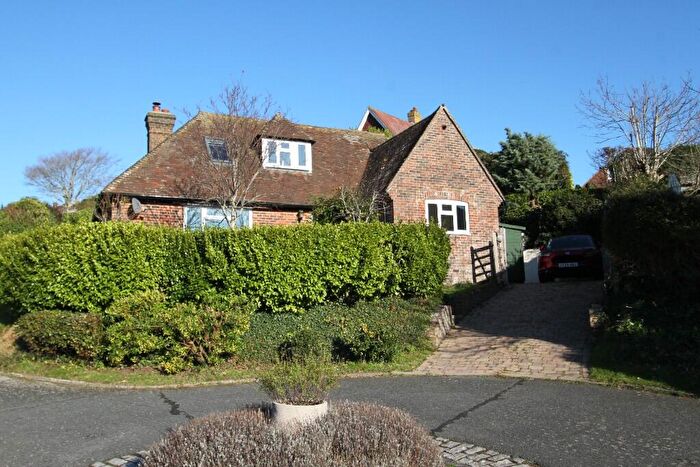
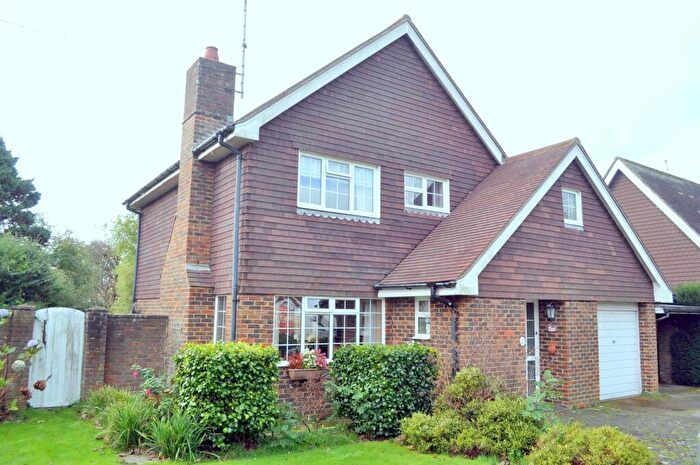
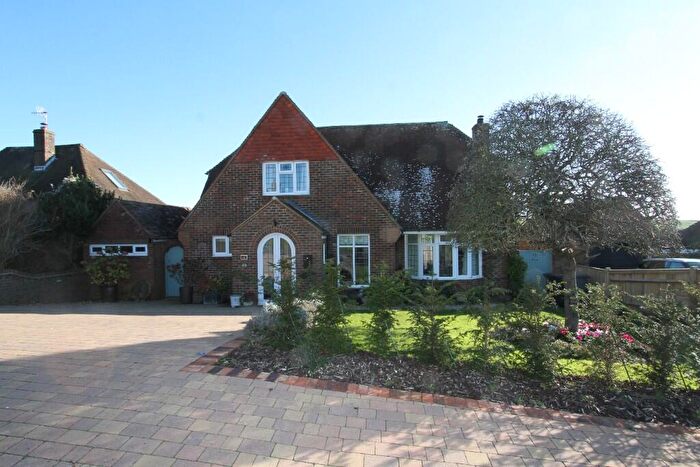
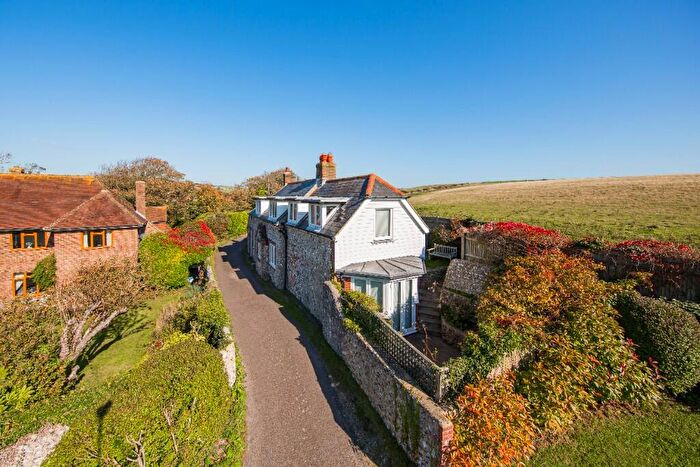
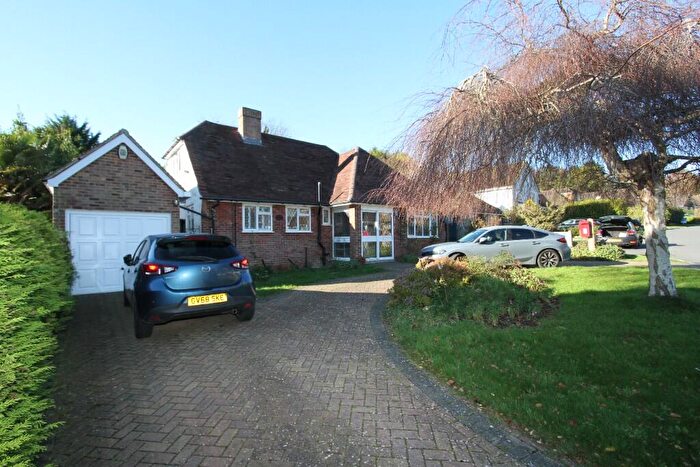
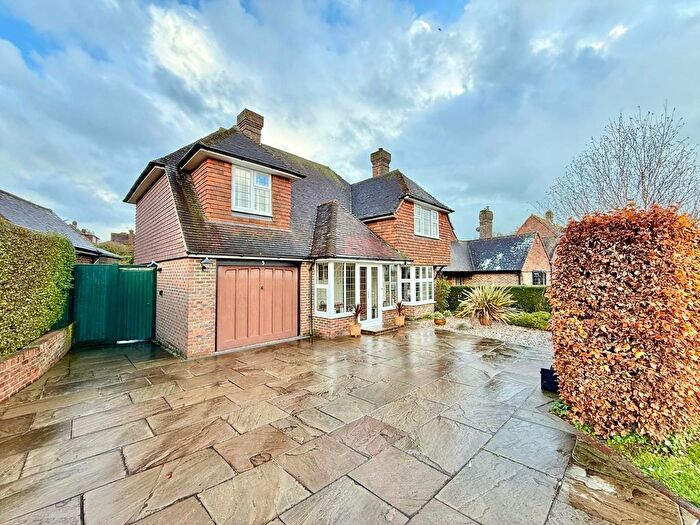
Houses for sale & to rent in East Dean, Eastbourne
House Prices in East Dean
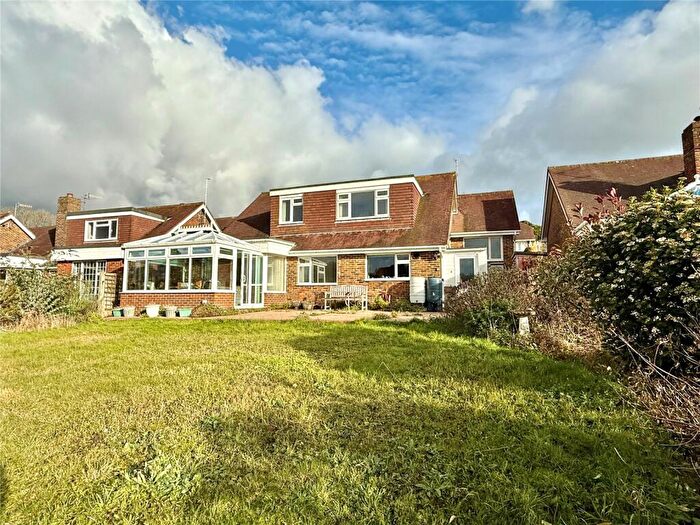
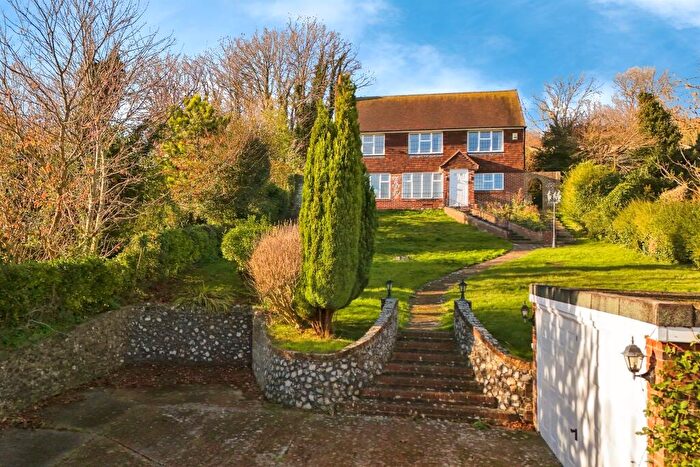
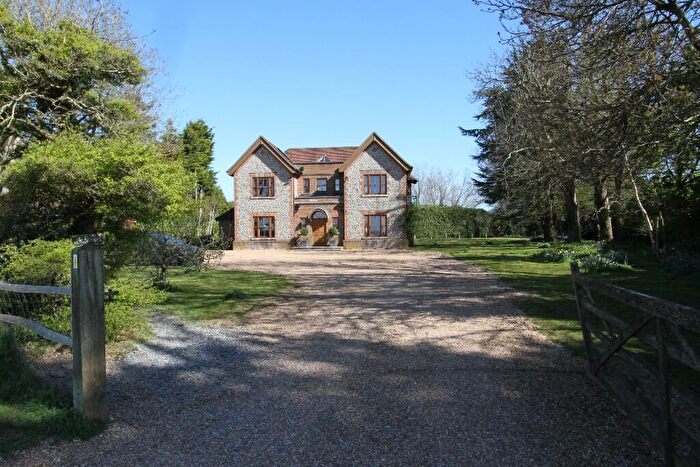
Properties in East Dean have an average house price of £776,060.00 and had 71 Property Transactions within the last 3 years¹.
East Dean is an area in Eastbourne, East Sussex with 747 households², where the most expensive property was sold for £2,200,000.00.
Properties for sale in East Dean
Previously listed properties in East Dean
Roads and Postcodes in East Dean
Navigate through our locations to find the location of your next house in East Dean, Eastbourne for sale or to rent.
| Streets | Postcodes |
|---|---|
| Birling Gap | BN20 0AB |
| Birling Gap Road | BN20 0AA |
| Churchfield | BN20 0DQ |
| Cophall Lane | BN20 0DP |
| Crowlink | BN20 0AY |
| Crowlink Cottages | BN20 0AZ |
| Crowlink Lane | BN20 0AU BN20 0AX |
| Dene Close | BN20 0JJ |
| Deneside | BN20 0HU BN20 0HX BN20 0HY BN20 0JB BN20 0JG |
| Downlands Way | BN20 0HR |
| Downs View Close | BN20 0DT |
| Downs View Lane | BN20 0DS |
| Eastbourne Road | BN20 0BL BN20 0DN |
| Elven Close | BN20 0LJ |
| Elven Lane | BN20 0LG |
| Friston Downs | BN20 0ET |
| Friston Hill | BN20 0BP BN20 0EA BN20 0EB BN20 0ED |
| Friston Place | BN20 0AL BN20 0AN BN20 0AW |
| Gilberts Drive | BN20 0DJ BN20 0DL |
| Gore Farm Close | BN20 0BD |
| High Close | BN20 0JX |
| Hillside | BN20 0HE |
| Jevington Road | BN20 0AG |
| Lindon Close | BN20 0EX |
| Little Lane | BN20 0BX |
| Lower Street | BN20 0DE |
| Michel Close | BN20 0JS |
| Michel Dene Close | BN20 0JT |
| Michel Dene Road | BN20 0HP BN20 0JH BN20 0JN BN20 0JP BN20 0JR BN20 0JU BN20 0JY BN20 0JZ BN20 0LA |
| Mill Close | BN20 0EF |
| Old Willingdon Road | BN20 0AS BN20 0AT |
| Peak Dean Close | BN20 0HZ BN20 0JA |
| Peakdean Lane | BN20 0JD BN20 0JE |
| Royston Close | BN20 0EY |
| Seaford Road | BN20 0BA |
| Summerdown Lane | BN20 0LE BN20 0LF |
| Sussex Gardens | BN20 0JF |
| The Brow | BN20 0ER BN20 0ES |
| The Close | BN20 0HB |
| The Fridays | BN20 0DG BN20 0DH |
| The Green | BN20 0BY |
| The Link | BN20 0LB |
| The Outlook | BN20 0AR |
| The Ridgeway | BN20 0EU BN20 0EZ |
| Upper Street | BN20 0BS |
| Warren Close | BN20 0EN |
| Warren Lane | BN20 0EL BN20 0EP BN20 0EW BN20 0HA BN20 0HD |
| Wayside | BN20 0HS |
| Went Lane | BN20 0JL |
| Went Way | BN20 0DB BN20 0DD |
| Wenthill Close | BN20 0HT |
| Windmill Lane | BN20 0EE BN20 0EJ |
Transport near East Dean
- FAQ
- Price Paid By Year
- Property Type Price
Frequently asked questions about East Dean
What is the average price for a property for sale in East Dean?
The average price for a property for sale in East Dean is £776,060. This amount is 143% higher than the average price in Eastbourne. There are 147 property listings for sale in East Dean.
What streets have the most expensive properties for sale in East Dean?
The streets with the most expensive properties for sale in East Dean are The Brow at an average of £1,660,000, Royston Close at an average of £1,300,000 and The Ridgeway at an average of £1,244,000.
What streets have the most affordable properties for sale in East Dean?
The streets with the most affordable properties for sale in East Dean are Eastbourne Road at an average of £228,750, The Fridays at an average of £365,000 and Sussex Gardens at an average of £435,600.
Which train stations are available in or near East Dean?
Some of the train stations available in or near East Dean are Eastbourne, Hampden Park and Polegate.
Property Price Paid in East Dean by Year
The average sold property price by year was:
| Year | Average Sold Price | Price Change |
Sold Properties
|
|---|---|---|---|
| 2025 | £826,250 | 19% |
9 Properties |
| 2024 | £672,420 | -22% |
18 Properties |
| 2023 | £822,866 | 3% |
15 Properties |
| 2022 | £800,603 | 16% |
29 Properties |
| 2021 | £668,997 | 7% |
37 Properties |
| 2020 | £621,802 | 2% |
25 Properties |
| 2019 | £606,742 | -5% |
28 Properties |
| 2018 | £636,915 | 19% |
30 Properties |
| 2017 | £516,601 | 2% |
38 Properties |
| 2016 | £507,178 | 1% |
37 Properties |
| 2015 | £500,381 | -4% |
21 Properties |
| 2014 | £522,068 | 12% |
44 Properties |
| 2013 | £461,377 | 8% |
34 Properties |
| 2012 | £425,680 | -3% |
25 Properties |
| 2011 | £438,415 | 7% |
22 Properties |
| 2010 | £406,508 | 12% |
49 Properties |
| 2009 | £357,793 | -34% |
29 Properties |
| 2008 | £479,108 | 12% |
17 Properties |
| 2007 | £420,826 | 14% |
34 Properties |
| 2006 | £362,509 | 7% |
38 Properties |
| 2005 | £337,070 | 2% |
47 Properties |
| 2004 | £331,192 | -0,2% |
28 Properties |
| 2003 | £331,873 | 17% |
45 Properties |
| 2002 | £276,214 | 10% |
43 Properties |
| 2001 | £248,965 | 20% |
43 Properties |
| 2000 | £198,553 | -3% |
31 Properties |
| 1999 | £205,115 | 14% |
41 Properties |
| 1998 | £176,041 | 5% |
43 Properties |
| 1997 | £167,004 | 18% |
32 Properties |
| 1996 | £136,498 | -32% |
43 Properties |
| 1995 | £180,120 | - |
29 Properties |
Property Price per Property Type in East Dean
Here you can find historic sold price data in order to help with your property search.
The average Property Paid Price for specific property types in the last three years are:
| Property Type | Average Sold Price | Sold Properties |
|---|---|---|
| Semi Detached House | £635,000.00 | 7 Semi Detached Houses |
| Detached House | £854,086.00 | 56 Detached Houses |
| Terraced House | £427,625.00 | 4 Terraced Houses |
| Flat | £279,000.00 | 4 Flats |

