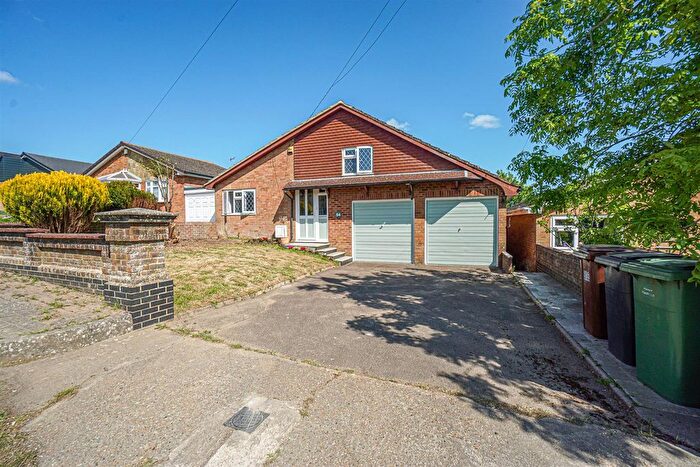
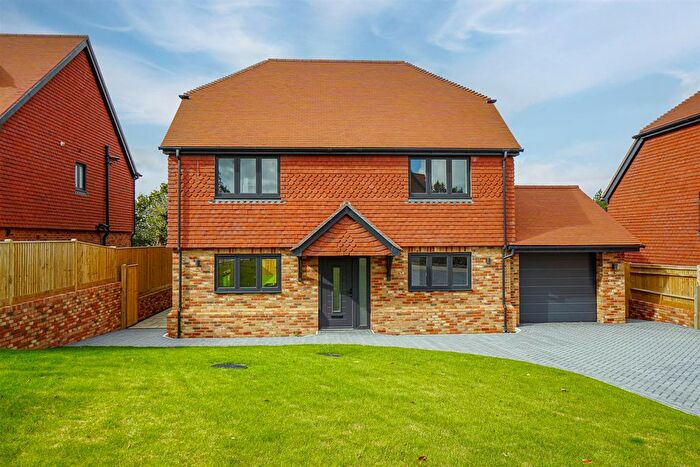
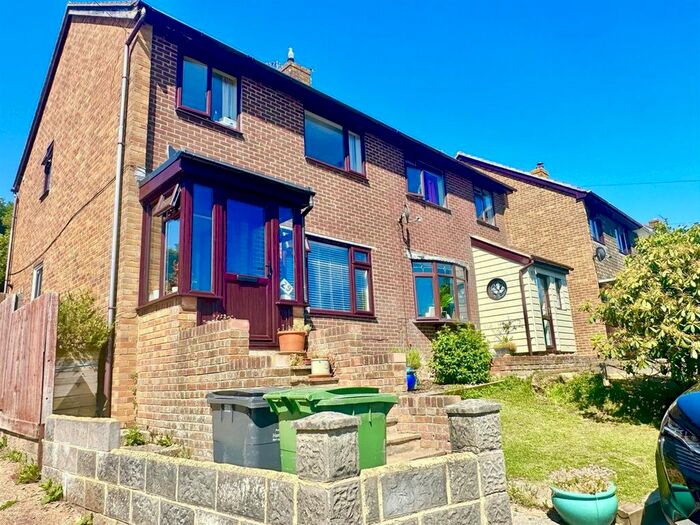
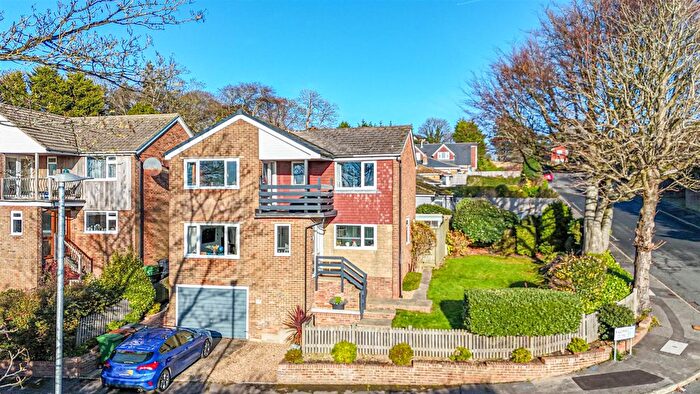
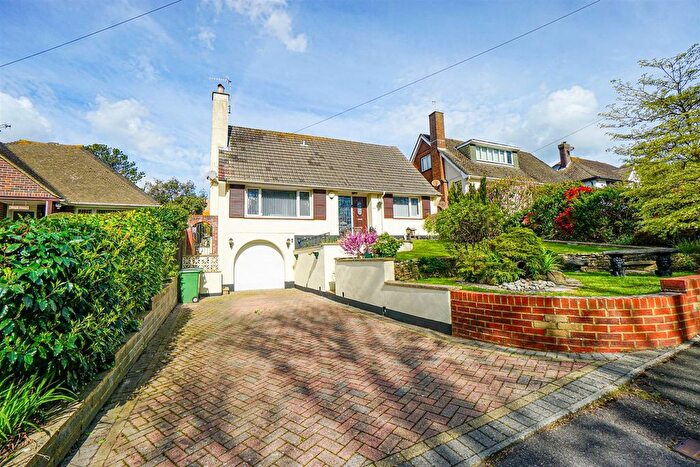
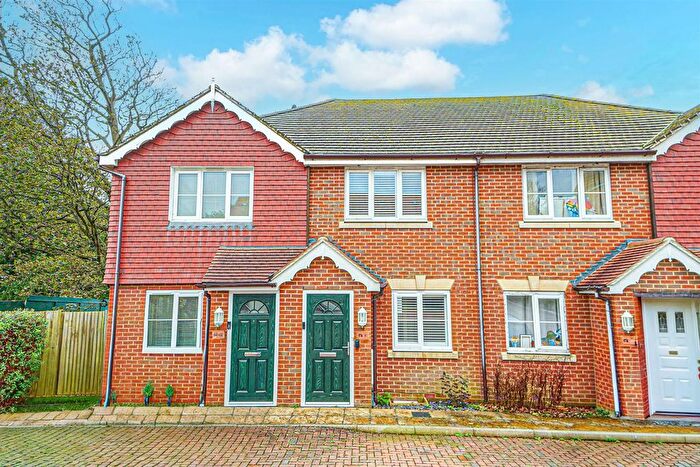
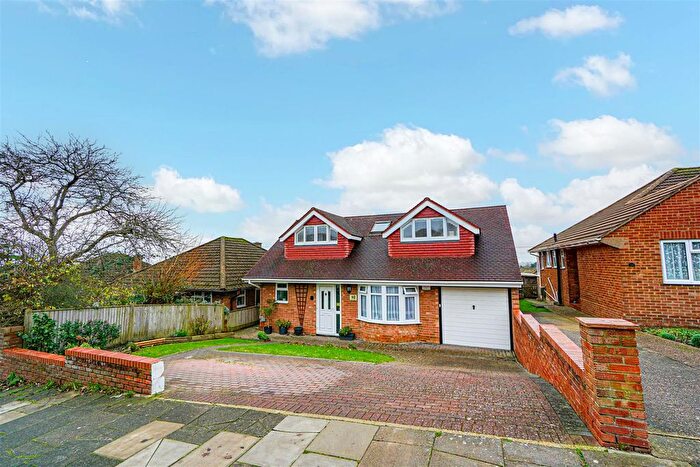
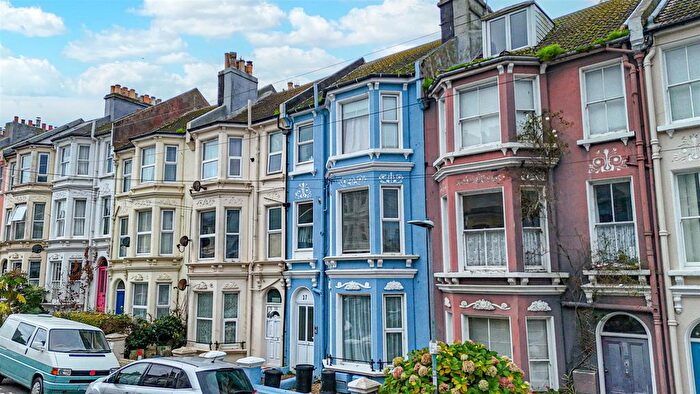
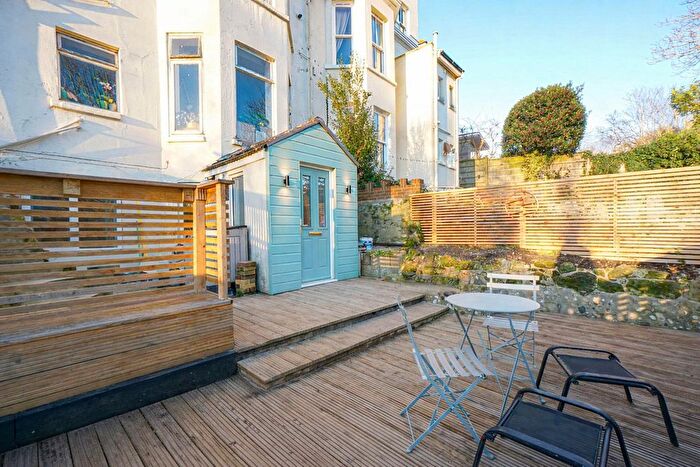
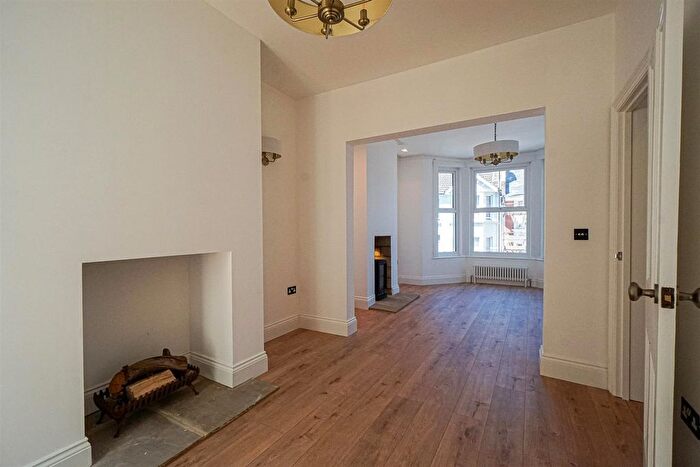
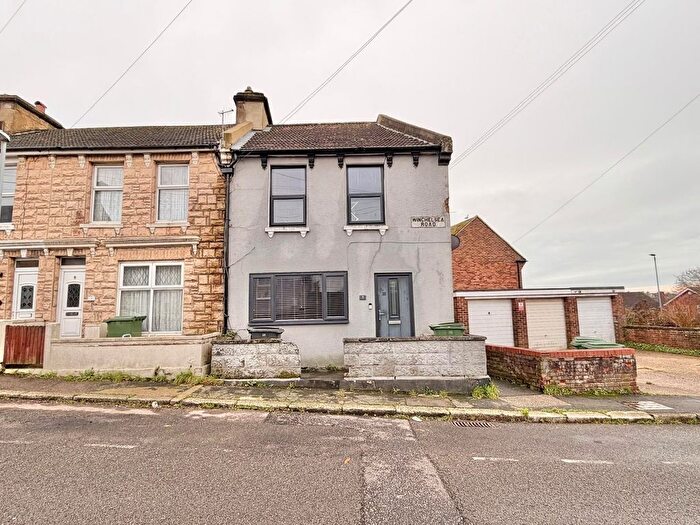
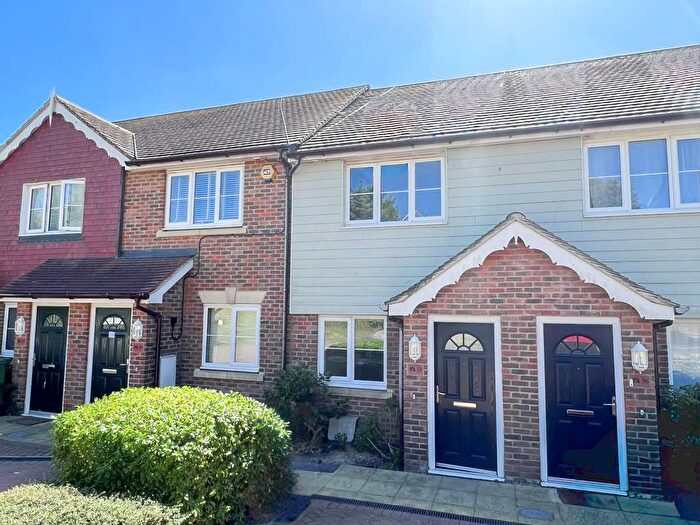
Houses for sale & to rent in Ore, Hastings
House Prices in Ore
Properties in Ore have an average house price of £267,035.00 and had 289 Property Transactions within the last 3 years¹.
Ore is an area in Hastings, East Sussex with 2,288 households², where the most expensive property was sold for £770,000.00.
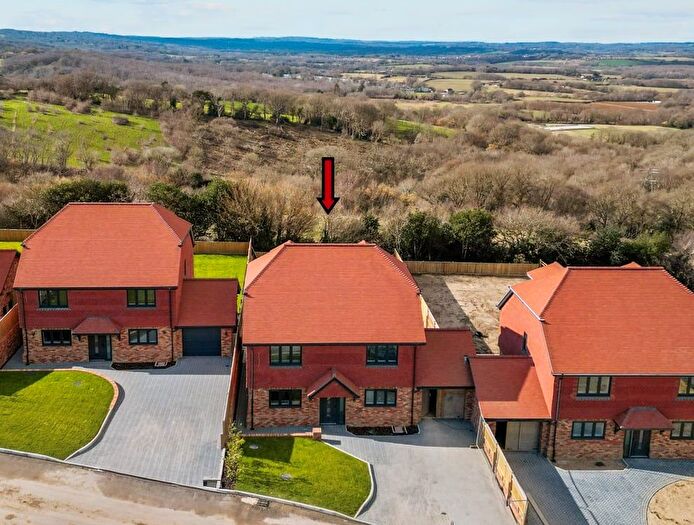
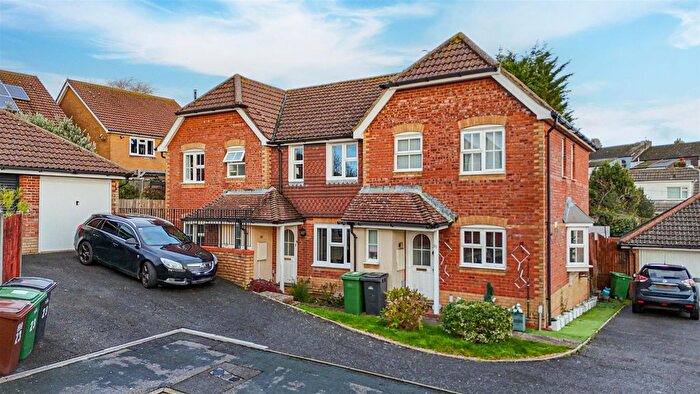
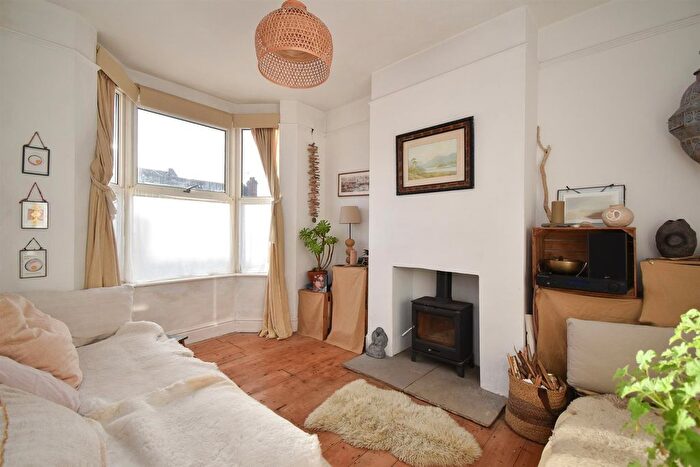
Properties for sale in Ore
Roads and Postcodes in Ore
Navigate through our locations to find the location of your next house in Ore, Hastings for sale or to rent.
| Streets | Postcodes |
|---|---|
| Barley Lane | TN35 5DU TN35 5DX |
| Beacon Road | TN35 5ER |
| Brackendale | TN35 5HN |
| Brightling Avenue | TN35 5EG TN35 5EQ |
| Broadlands | TN35 4JY |
| Canute Road | TN35 5HT TN35 5HU |
| Churchill Avenue | TN35 4LB TN35 4LD |
| Crowborough Road | TN35 5EE TN35 5EF TN35 5FT |
| Ditchling Drive | TN35 5EX |
| Edith Road | TN35 5HL |
| Fairlight Avenue | TN35 5HS |
| Fairlight Place | TN35 5DT |
| Fairlight Road | TN35 4AA TN35 5EA TN35 5ED TN35 5EJ TN35 5EL |
| Fairstone Close | TN35 5EZ |
| Firle Close | TN35 5ET |
| Glenview Close | TN35 5DZ |
| Granger Way | TN35 5FH |
| Grove Road | TN35 4JS |
| Hamilton Gardens | TN35 5HQ |
| Harold Road | TN35 5HG TN35 5NE TN35 5NF TN35 5PE |
| Hawthorn Road | TN35 5HW TN35 5GG |
| Hemingford Rise | TN35 5PG |
| Jenners Lane | TN35 4LH |
| Lords Lane | TN35 5EB |
| Lower Coastguard Lane | TN35 4AD |
| Manhattan Gardens | TN35 5DQ |
| Martineau Lane | TN35 5DR TN35 5DS |
| Middle Road | TN35 5DL TN35 5PF |
| Mill Close | TN35 5EY |
| Mill Lane | TN35 4LJ TN35 5DP TN35 5EU |
| Montgomery Road | TN35 4LA |
| Mountbatten Close | TN35 4LE |
| New Road | TN35 5HA |
| Newmans Way | TN35 5EW |
| Nook Close | TN35 5RA |
| Offa Road | TN35 5HR |
| Old London Road | TN35 5BB TN35 5BD TN35 5BG TN35 5BH TN35 5BL TN35 5BN TN35 5BP |
| Old Top Road | TN35 5DJ |
| Pinders Road | TN35 5HE TN35 5JG TN35 5PW |
| Pinders Walk | TN35 5HD |
| Red Lake Terrace | TN35 4JR |
| Richland Close | TN35 5ES |
| Rock Close | TN35 4JW |
| Rock Lane | TN35 4JN |
| Rye Road | TN35 4LL TN35 4LN TN35 5DA TN35 5DB TN35 5DD TN35 5DG TN35 5DH TN35 5DN |
| Saxon Road | TN35 5HH TN35 5HJ TN35 5HP |
| Shaw Close | TN35 5PL |
| Tedder Terrace | TN35 4JP |
| The Broadway | TN35 5EH |
| The Heights | TN35 5EP |
| The Ridge | TN34 2AA TN34 2AB |
| Tilekiln Lane | TN35 5EN |
| Victoria Avenue | TN35 5BZ |
| View Bank | TN35 5HB |
| Winchelsea Lane | TN35 4LG |
| Winchelsea Road | TN35 4JT TN35 4JU TN35 4JX |
| TN35 5FA |
Transport near Ore
- FAQ
- Price Paid By Year
- Property Type Price
Frequently asked questions about Ore
What is the average price for a property for sale in Ore?
The average price for a property for sale in Ore is £267,035. This amount is 15% lower than the average price in Hastings. There are 2,217 property listings for sale in Ore.
What streets have the most expensive properties for sale in Ore?
The streets with the most expensive properties for sale in Ore are The Heights at an average of £511,666, Fairlight Avenue at an average of £492,802 and Mill Lane at an average of £433,300.
What streets have the most affordable properties for sale in Ore?
The streets with the most affordable properties for sale in Ore are Crowborough Road at an average of £142,250, Pinders Road at an average of £181,666 and Brackendale at an average of £187,166.
Which train stations are available in or near Ore?
Some of the train stations available in or near Ore are Ore, Three Oaks and Hastings.
Property Price Paid in Ore by Year
The average sold property price by year was:
| Year | Average Sold Price | Price Change |
Sold Properties
|
|---|---|---|---|
| 2025 | £257,483 | 5% |
37 Properties |
| 2024 | £244,486 | -14% |
73 Properties |
| 2023 | £279,738 | 1% |
74 Properties |
| 2022 | £277,126 | 12% |
105 Properties |
| 2021 | £243,701 | 14% |
116 Properties |
| 2020 | £208,438 | -4% |
100 Properties |
| 2019 | £216,135 | -8% |
78 Properties |
| 2018 | £233,293 | 13% |
98 Properties |
| 2017 | £203,375 | 1% |
99 Properties |
| 2016 | £200,713 | 9% |
107 Properties |
| 2015 | £183,147 | 9% |
105 Properties |
| 2014 | £166,722 | 7% |
103 Properties |
| 2013 | £155,776 | -5% |
68 Properties |
| 2012 | £163,093 | 15% |
67 Properties |
| 2011 | £139,008 | -8% |
66 Properties |
| 2010 | £149,935 | -10% |
70 Properties |
| 2009 | £165,210 | 17% |
63 Properties |
| 2008 | £136,445 | -17% |
55 Properties |
| 2007 | £159,184 | 7% |
121 Properties |
| 2006 | £148,070 | -2% |
114 Properties |
| 2005 | £150,463 | -3% |
112 Properties |
| 2004 | £154,955 | 25% |
117 Properties |
| 2003 | £116,986 | 20% |
112 Properties |
| 2002 | £93,338 | 16% |
149 Properties |
| 2001 | £78,481 | 15% |
158 Properties |
| 2000 | £66,323 | 23% |
133 Properties |
| 1999 | £51,396 | -6% |
141 Properties |
| 1998 | £54,545 | 12% |
120 Properties |
| 1997 | £48,120 | 12% |
123 Properties |
| 1996 | £42,367 | -1% |
97 Properties |
| 1995 | £42,897 | - |
114 Properties |
Property Price per Property Type in Ore
Here you can find historic sold price data in order to help with your property search.
The average Property Paid Price for specific property types in the last three years are:
| Property Type | Average Sold Price | Sold Properties |
|---|---|---|
| Semi Detached House | £286,228.00 | 71 Semi Detached Houses |
| Detached House | £433,606.00 | 32 Detached Houses |
| Terraced House | £250,232.00 | 143 Terraced Houses |
| Flat | £167,267.00 | 43 Flats |

