
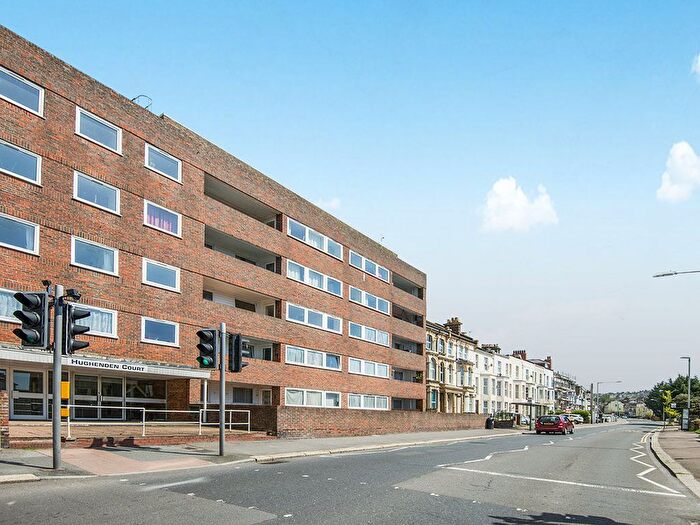
Houses for sale & to rent in Hastings, East Sussex
House Prices in Hastings
Properties in Hastings have an average house price of £310k and had 2,241 Property Transactions within the last 3 years.¹
Hastings is an area in East Sussex with 21,527 households², where the most expensive property was sold for £1.7M.
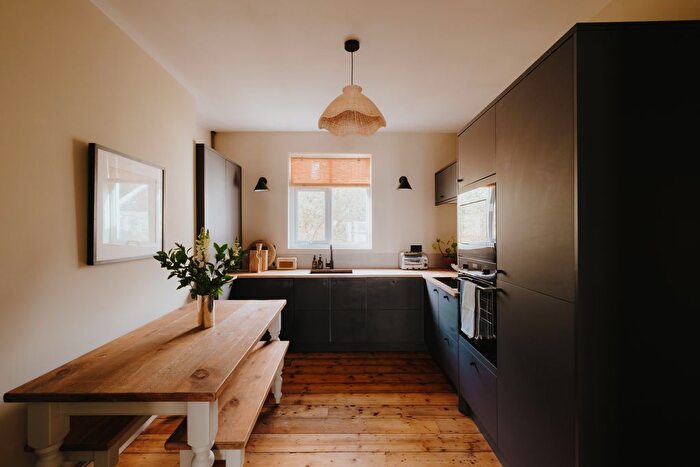
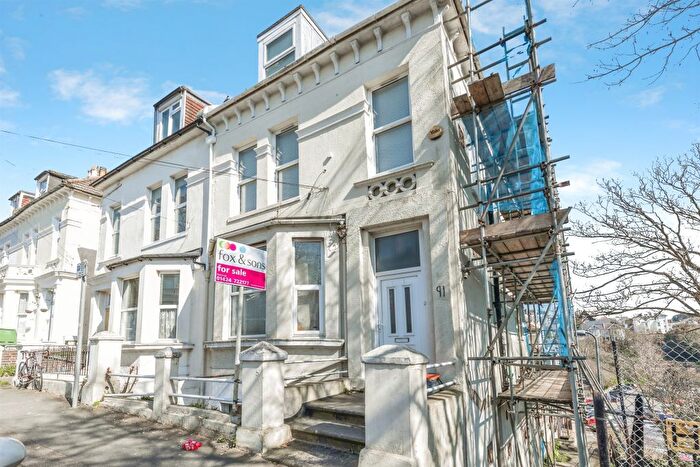
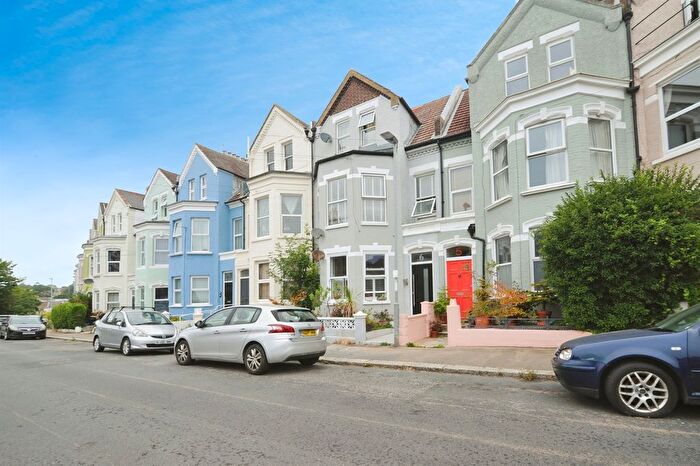
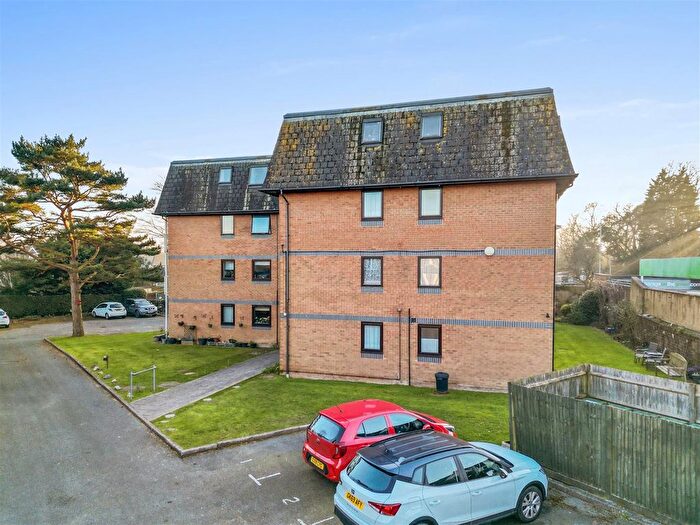
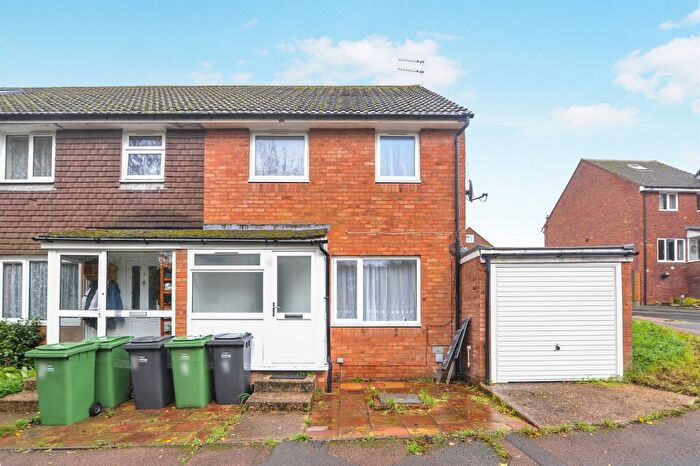
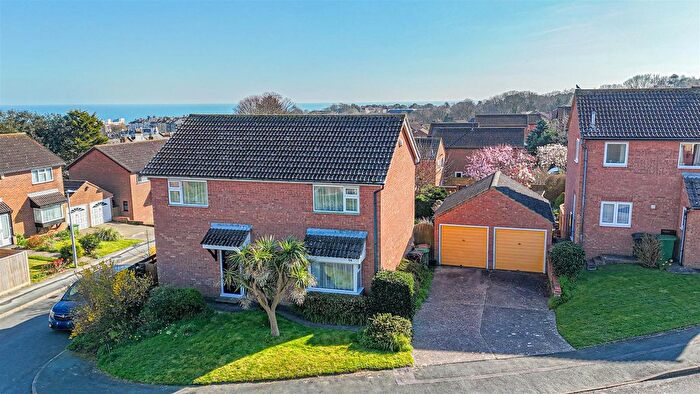
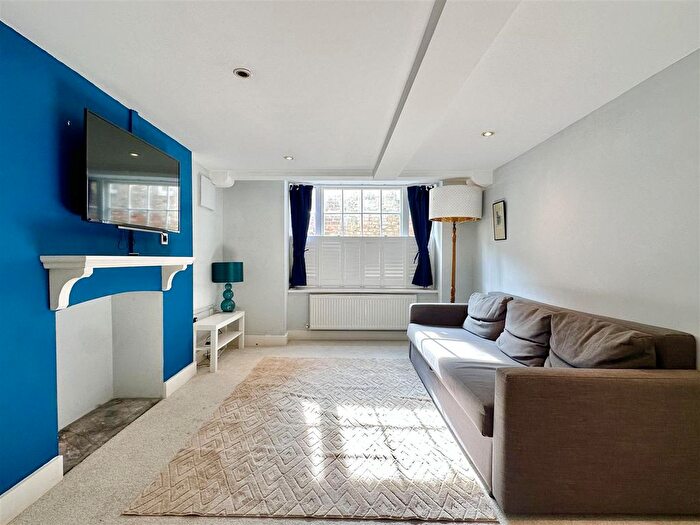
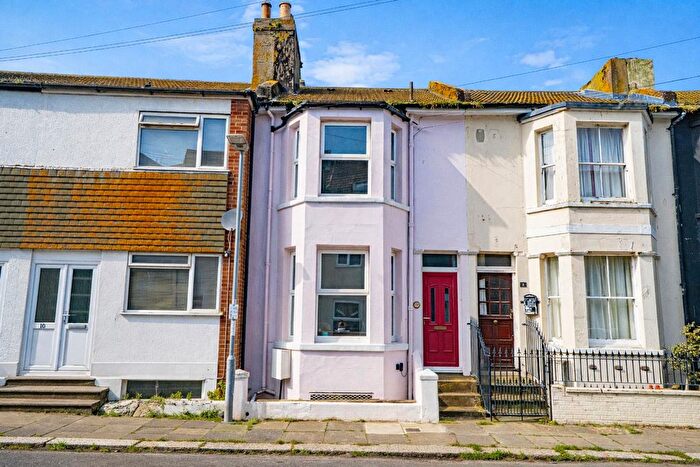
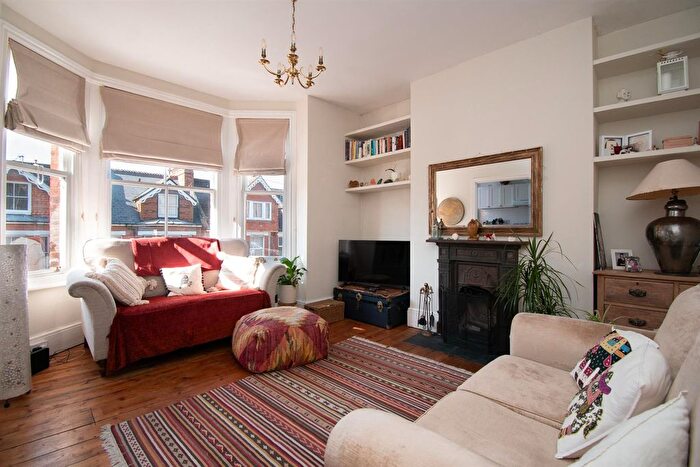
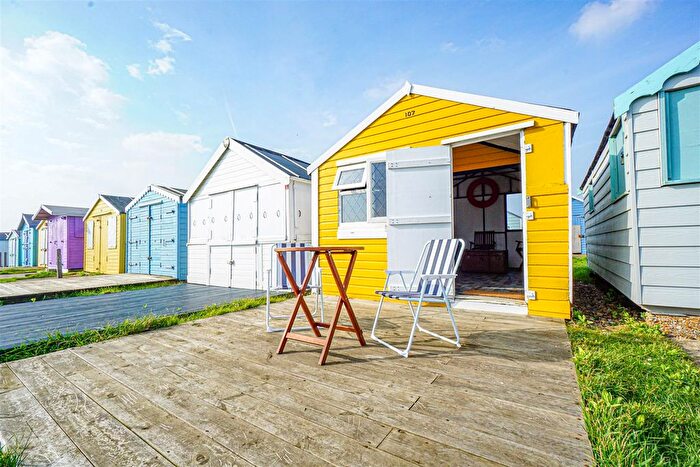
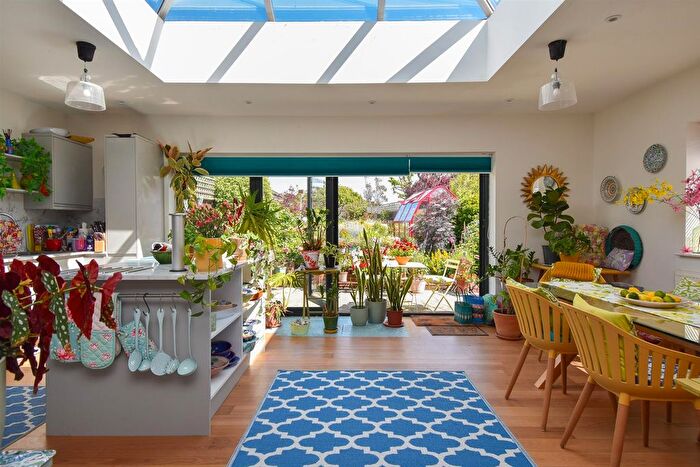
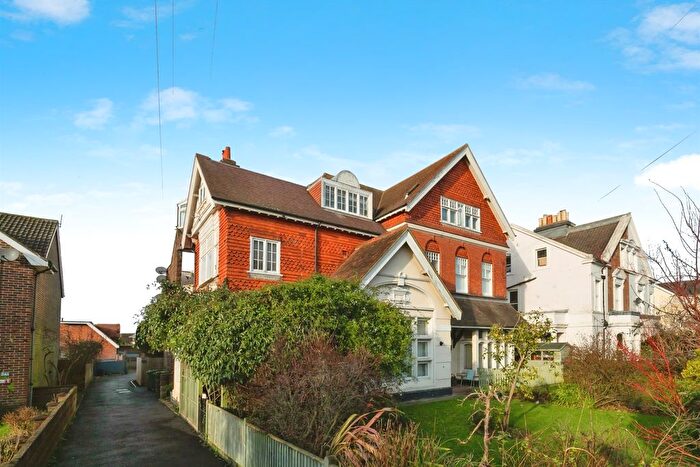
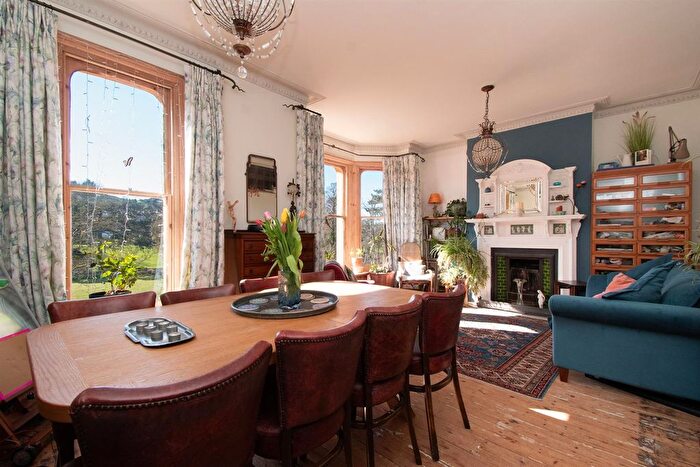
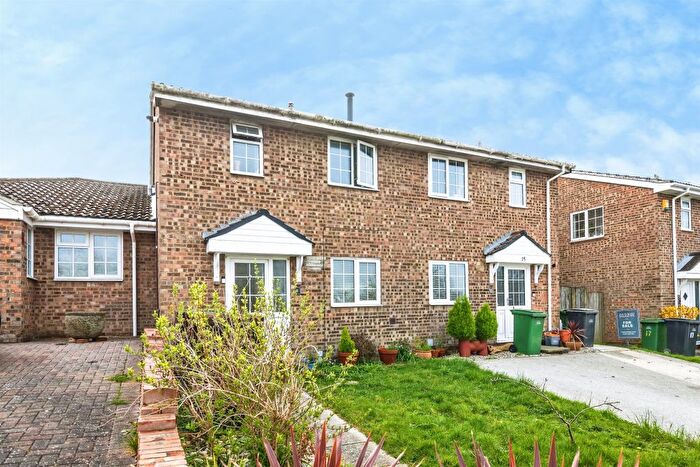
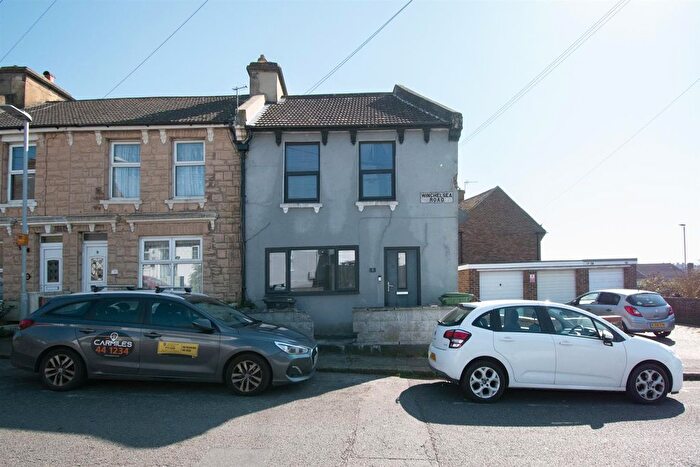
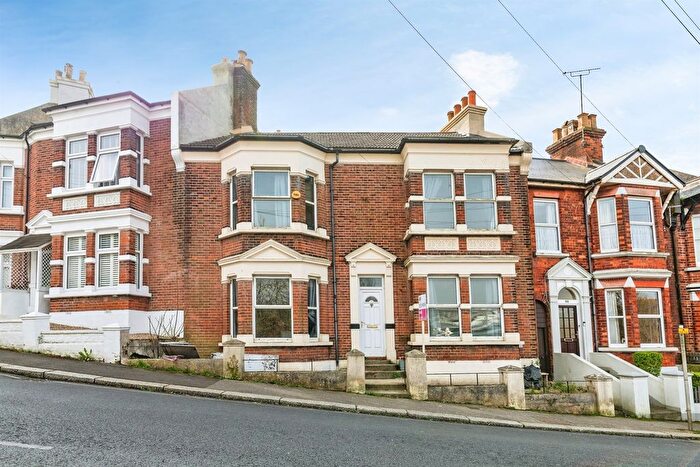
Properties for sale in Hastings
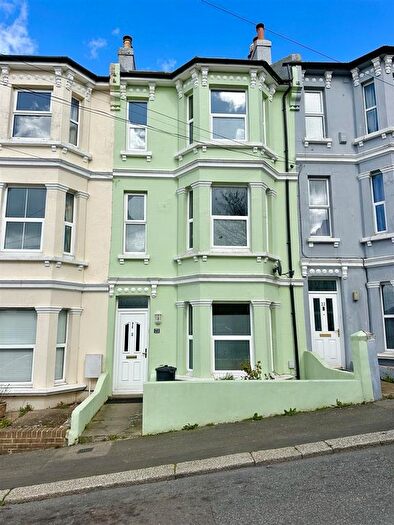
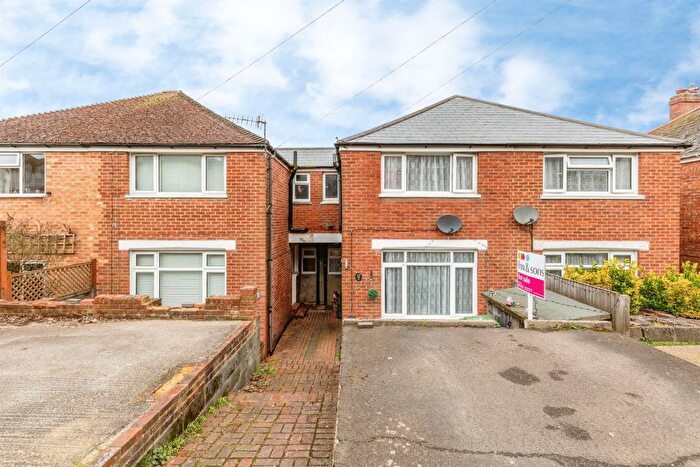
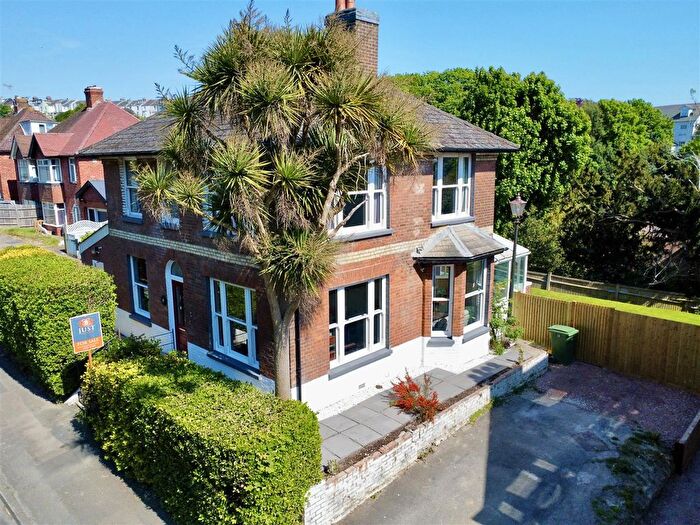
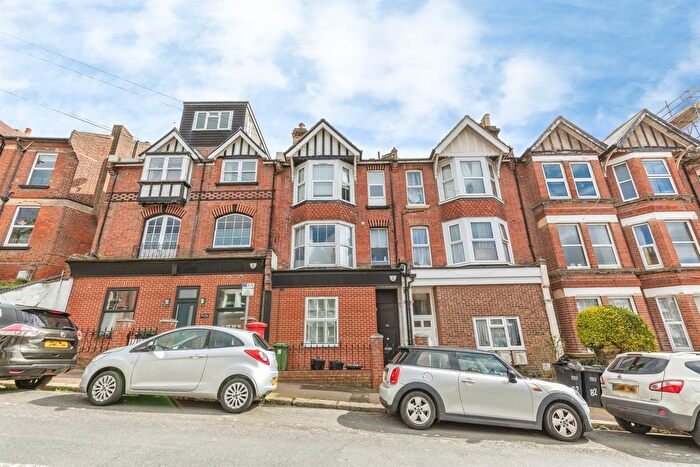
![]()
If you are looking to sell your house, let it out, or receive a property valuation, an expert can help you.
Click the button below to get started.
Neighbourhoods in Hastings
Navigate through our locations to find the location of your next house in Hastings, East Sussex for sale or to rent.
Transport in Hastings
Please see below transportation links in this area:
-
 Ore Station
 -
Hastings Station
-
St.Leonards Warrior Square Station
-
Three Oaks Station
-
West St Leonards Station
- FAQ
- Price Paid By Year
- Property Type Price
Frequently asked questions about Hastings
What is the average price for a property for sale in Hastings?
The average price for a property for sale in Hastings is £310,065. This amount is 19% lower than the average price in East Sussex. There are 9,661 property listings for sale in Hastings.
What locations have the most expensive properties for sale in Hastings?
The locations with the most expensive properties for sale in Hastings are Marsham at an average of £503,908, Brede Valley at an average of £436,492 and Sedlescombe & Westfield at an average of £399,059.
What locations have the most affordable properties for sale in Hastings?
The locations with the most affordable properties for sale in Hastings are Castle at an average of £224,135, Tressell at an average of £244,517 and Ore at an average of £260,482.
Which train stations are available in or near Hastings?
Some of the train stations available in or near Hastings are Ore, Hastings and St.Leonards Warrior Square.
Property Price Paid in Hastings by Year
The average sold property price by year was:
| Year | Average Sold Price | Price Change |
Sold Properties
|
|---|---|---|---|
| 2026 | £279,580 | -13% |
18 Properties |
| 2025 | £315,588 | 1% |
658 Properties |
| 2024 | £312,077 | 3% |
789 Properties |
| 2023 | £304,044 | -8% |
776 Properties |
| 2022 | £329,547 | 2% |
953 Properties |
| 2021 | £322,251 | 13% |
1,204 Properties |
| 2020 | £279,460 | 7% |
780 Properties |
| 2019 | £260,176 | -0,3% |
933 Properties |
| 2018 | £260,995 | 3% |
924 Properties |
| 2017 | £252,749 | 9% |
1,095 Properties |
| 2016 | £230,842 | 8% |
1,131 Properties |
| 2015 | £211,865 | 6% |
1,074 Properties |
| 2014 | £199,306 | 6% |
1,051 Properties |
| 2013 | £187,622 | -1% |
831 Properties |
| 2012 | £188,840 | 3% |
688 Properties |
| 2011 | £183,983 | -3% |
713 Properties |
| 2010 | £189,554 | 5% |
608 Properties |
| 2009 | £180,126 | -3% |
644 Properties |
| 2008 | £184,642 | -0,1% |
684 Properties |
| 2007 | £184,897 | 9% |
1,366 Properties |
| 2006 | £168,361 | 4% |
1,289 Properties |
| 2005 | £162,036 | 4% |
1,106 Properties |
| 2004 | £155,959 | 15% |
1,302 Properties |
| 2003 | £133,098 | 17% |
1,289 Properties |
| 2002 | £110,076 | 21% |
1,602 Properties |
| 2001 | £87,484 | 10% |
1,502 Properties |
| 2000 | £79,132 | 10% |
1,310 Properties |
| 1999 | £71,057 | 14% |
1,298 Properties |
| 1998 | £61,138 | 6% |
1,241 Properties |
| 1997 | £57,714 | 11% |
1,223 Properties |
| 1996 | £51,385 | 5% |
1,016 Properties |
| 1995 | £48,806 | - |
892 Properties |
Property Price per Property Type in Hastings
Here you can find historic sold price data in order to help with your property search.
The average Property Paid Price for specific property types in the last three years are:
| Property Type | Average Sold Price | Sold Properties |
|---|---|---|
| Semi Detached House | £347,070.00 | 421 Semi Detached Houses |
| Terraced House | £297,613.00 | 710 Terraced Houses |
| Detached House | £496,757.00 | 464 Detached Houses |
| Flat | £165,540.00 | 646 Flats |