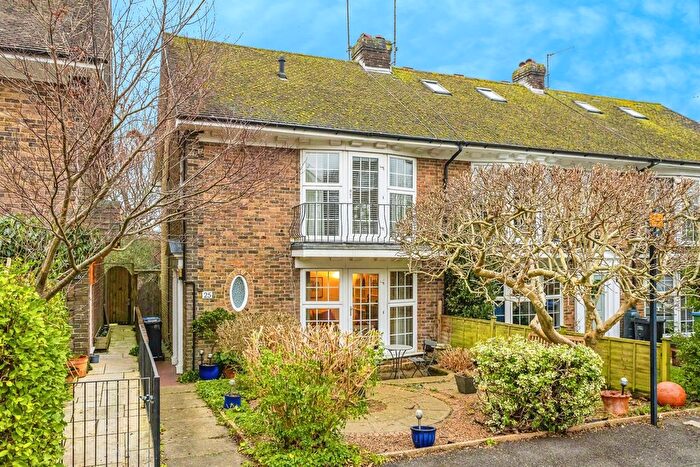
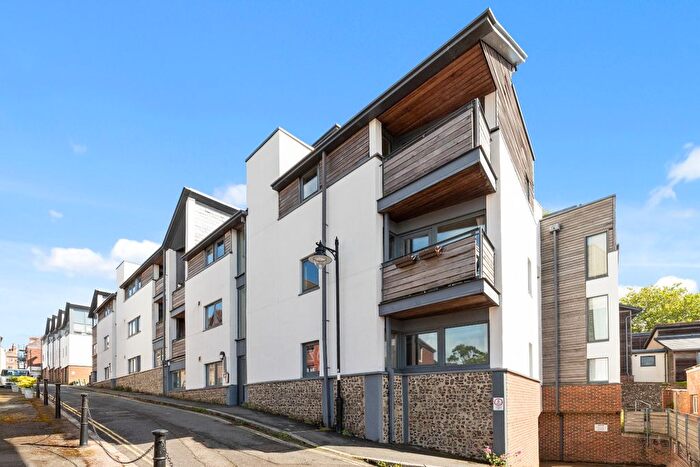
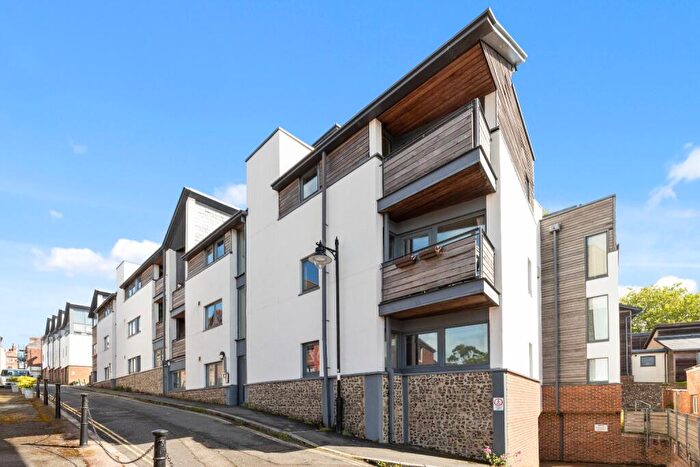
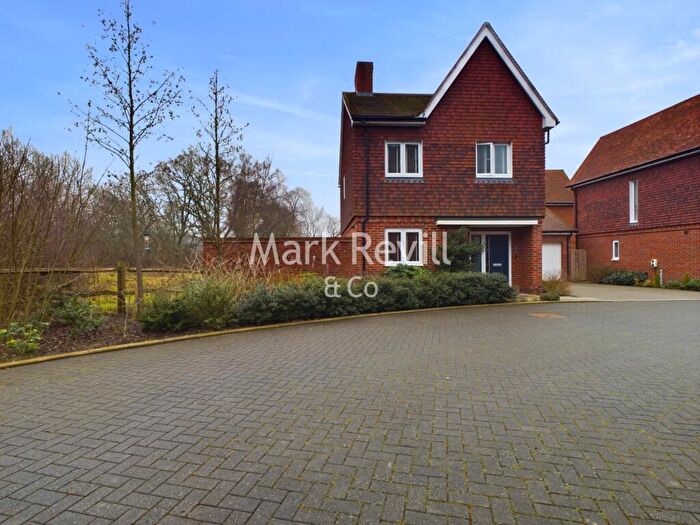
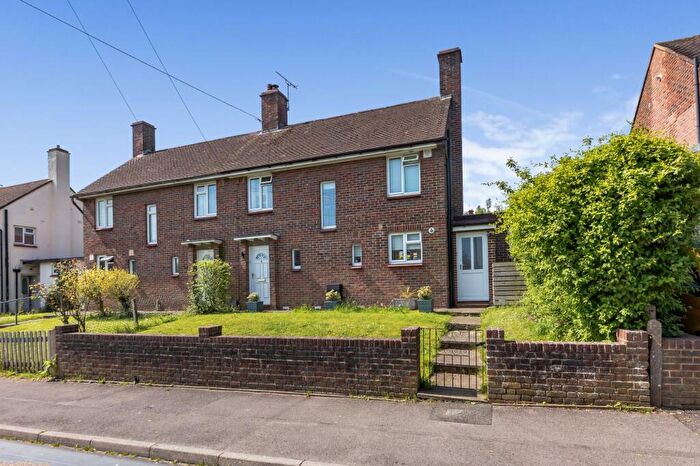
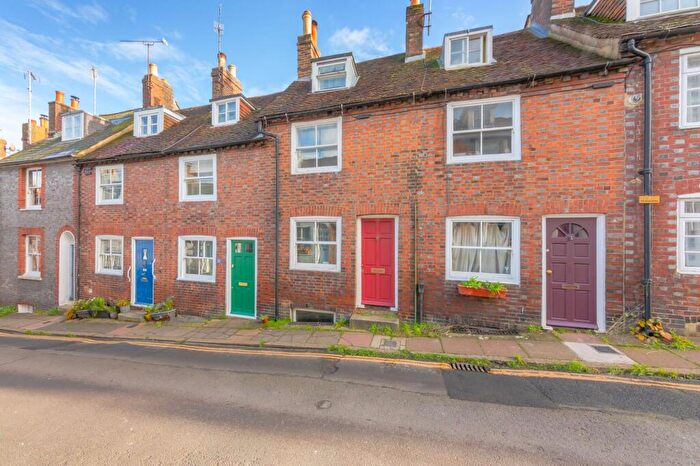
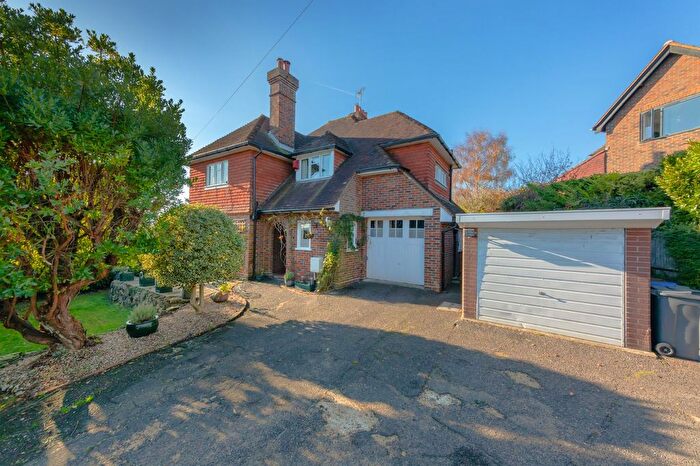
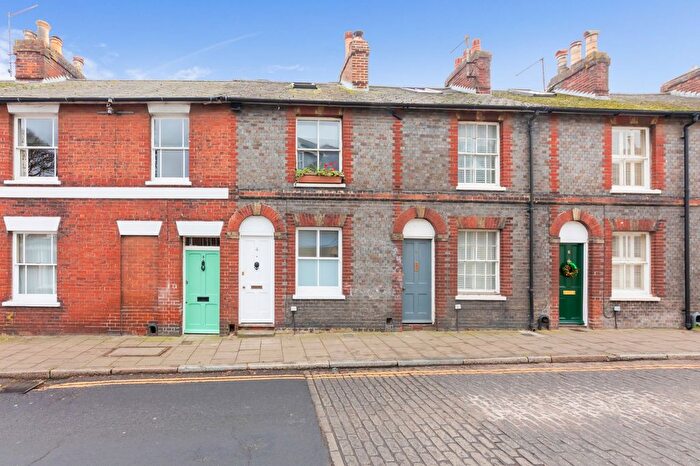
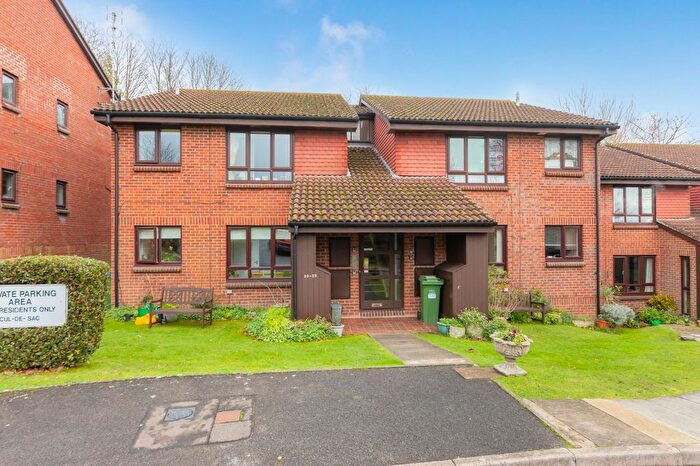
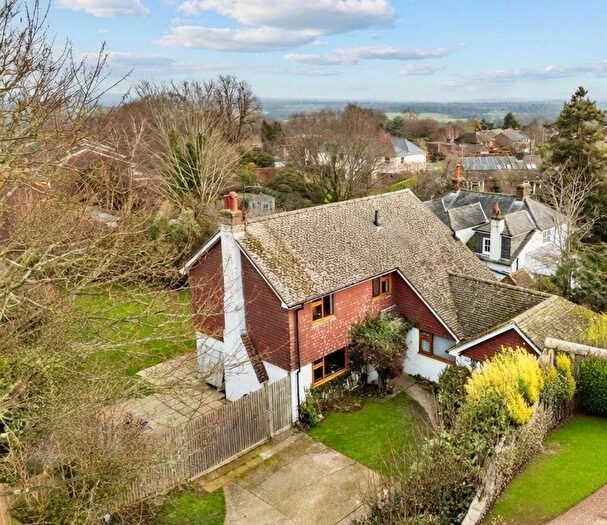
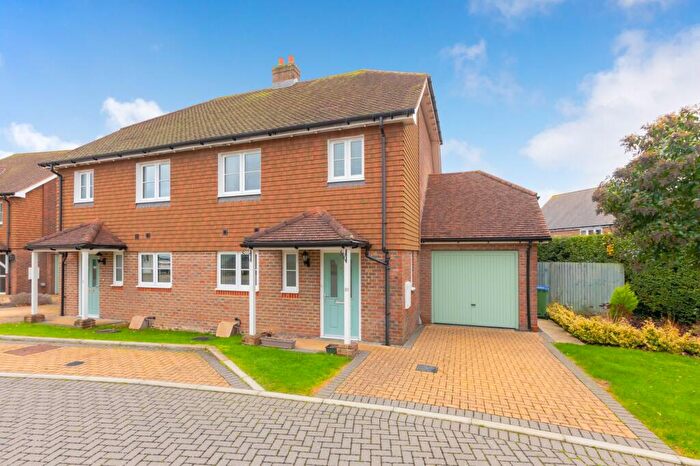
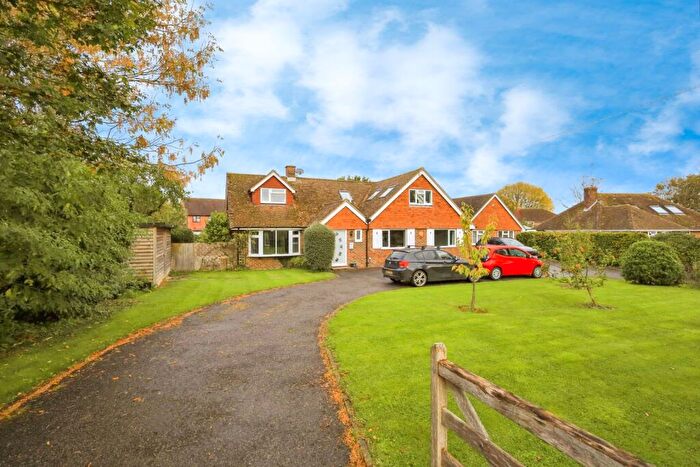
Houses for sale & to rent in Barcombe And Hamsey, Lewes
House Prices in Barcombe And Hamsey
Properties in Barcombe And Hamsey have an average house price of £624,025.00 and had 55 Property Transactions within the last 3 years¹.
Barcombe And Hamsey is an area in Lewes, East Sussex with 758 households², where the most expensive property was sold for £1,700,000.00.
Properties for sale in Barcombe And Hamsey
Roads and Postcodes in Barcombe And Hamsey
Navigate through our locations to find the location of your next house in Barcombe And Hamsey, Lewes for sale or to rent.
| Streets | Postcodes |
|---|---|
| Anchor Lane | BN8 5EA |
| Bank Cottages | BN7 3QH |
| Barcombe Mills | BN8 5BS BN8 5BT |
| Barcombe Mills Road | BN8 5BH BN8 5BJ BN8 5BL BN8 5BP |
| Barcombe Place | BN8 5DL |
| Beechwood Lane | BN7 3QG |
| Bretts Cottages | BN8 5TD |
| Bridgelands | BN8 5BW |
| Chandlers Mead | BN8 4SZ |
| Church Road | BN8 5TP BN8 5TR BN8 5TS BN8 5TW |
| Cooksbridge | BN8 4SJ BN8 4SL BN8 4SP BN8 4SS BN8 4ST BN8 4SW |
| Cooksbridge Road | BN8 5TJ |
| Deans Meadow | BN8 5DX |
| Ditchling Road | BN7 3QP |
| Downsview Cottages | BN8 4TA |
| Fir Tree Cottages | BN8 4SX |
| Gladstone Buildings | BN8 5AX |
| Grange Road | BN8 5AU |
| Grantham Bank | BN8 5DJ |
| Hamsey Road | BN8 5TG |
| High Street | BN8 5BA BN8 5BB BN8 5BD BN8 5DH |
| Littlemead | BN8 4SY |
| Malthouse Way | BN7 3PT |
| Mead Cross | BN8 5DP |
| Mill Lane | BN8 5TH |
| Mongers Lane | BN8 5BG BN8 5BQ |
| Mongers Mead | BN8 5BE |
| Mount Pleasant | BN8 5EQ |
| Munster Green | BN8 5BN |
| North End Lane | BN8 5TE |
| Offham Road | BN7 3QF |
| Resting Oak Hill | BN8 4PR |
| School Field | BN8 5DT |
| School Hill | BN8 5DU |
| School Lane | BN8 5DS |
| School Path | BN8 5DN BN8 5DW |
| Spithurst Road | BN8 5EB BN8 5ED BN8 5EE BN8 5EF BN8 5EG |
| The Grange | BN8 5AT |
| The Street | BN7 3QE |
| Town Littleworth | BN8 4TB BN8 4TD BN8 4TH |
| Weald Close | BN8 5AY |
| Weald View | BN8 5AZ |
| Wellington Cottages | BN8 4SN |
| BN7 3QA BN7 3QD BN8 4QD BN8 4RU BN8 5TA BN8 5TB BN8 5TL |
Transport near Barcombe And Hamsey
- FAQ
- Price Paid By Year
- Property Type Price
Frequently asked questions about Barcombe And Hamsey
What is the average price for a property for sale in Barcombe And Hamsey?
The average price for a property for sale in Barcombe And Hamsey is £624,025. This amount is 9% higher than the average price in Lewes. There are 2,926 property listings for sale in Barcombe And Hamsey.
What streets have the most expensive properties for sale in Barcombe And Hamsey?
The streets with the most expensive properties for sale in Barcombe And Hamsey are Spithurst Road at an average of £857,500, Barcombe Mills Road at an average of £807,500 and Cooksbridge at an average of £713,166.
What streets have the most affordable properties for sale in Barcombe And Hamsey?
The streets with the most affordable properties for sale in Barcombe And Hamsey are Downsview Cottages at an average of £374,000, Weald Close at an average of £385,000 and Chandlers Mead at an average of £418,750.
Which train stations are available in or near Barcombe And Hamsey?
Some of the train stations available in or near Barcombe And Hamsey are Cooksbridge, Plumpton and Lewes.
Property Price Paid in Barcombe And Hamsey by Year
The average sold property price by year was:
| Year | Average Sold Price | Price Change |
Sold Properties
|
|---|---|---|---|
| 2025 | £417,654 | -58% |
5 Properties |
| 2024 | £657,866 | -2% |
15 Properties |
| 2023 | £670,513 | 7% |
11 Properties |
| 2022 | £624,562 | -16% |
24 Properties |
| 2021 | £723,963 | 28% |
22 Properties |
| 2020 | £518,109 | -13% |
27 Properties |
| 2019 | £587,526 | -5% |
19 Properties |
| 2018 | £615,392 | 34% |
14 Properties |
| 2017 | £404,000 | -24% |
18 Properties |
| 2016 | £500,705 | 9% |
17 Properties |
| 2015 | £453,535 | 16% |
26 Properties |
| 2014 | £379,045 | -3% |
23 Properties |
| 2013 | £388,658 | -19% |
23 Properties |
| 2012 | £461,022 | 13% |
19 Properties |
| 2011 | £398,922 | -25% |
23 Properties |
| 2010 | £498,819 | 27% |
18 Properties |
| 2009 | £363,288 | -105% |
22 Properties |
| 2008 | £744,749 | 49% |
16 Properties |
| 2007 | £380,631 | 9% |
25 Properties |
| 2006 | £345,412 | 32% |
33 Properties |
| 2005 | £233,839 | -27% |
15 Properties |
| 2004 | £296,179 | 12% |
27 Properties |
| 2003 | £261,477 | -5% |
37 Properties |
| 2002 | £273,617 | 24% |
35 Properties |
| 2001 | £207,671 | -16% |
32 Properties |
| 2000 | £241,626 | 30% |
26 Properties |
| 1999 | £169,144 | -5% |
38 Properties |
| 1998 | £178,317 | 28% |
34 Properties |
| 1997 | £128,239 | 19% |
48 Properties |
| 1996 | £103,846 | -7% |
31 Properties |
| 1995 | £111,614 | - |
17 Properties |
Property Price per Property Type in Barcombe And Hamsey
Here you can find historic sold price data in order to help with your property search.
The average Property Paid Price for specific property types in the last three years are:
| Property Type | Average Sold Price | Sold Properties |
|---|---|---|
| Semi Detached House | £522,527.00 | 18 Semi Detached Houses |
| Detached House | £865,382.00 | 20 Detached Houses |
| Terraced House | £454,884.00 | 15 Terraced Houses |
| Flat | £392,500.00 | 2 Flats |

