
Houses for sale & to rent in Lewes, East Sussex
House Prices in Lewes
Properties in Lewes have an average house price of £563k and had 1,292 Property Transactions within the last 3 years.¹
Lewes is an area in East Sussex with 15,472 households², where the most expensive property was sold for £3M.
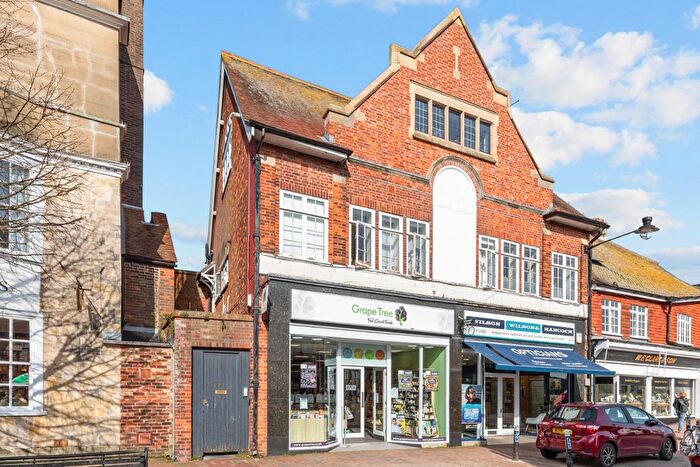
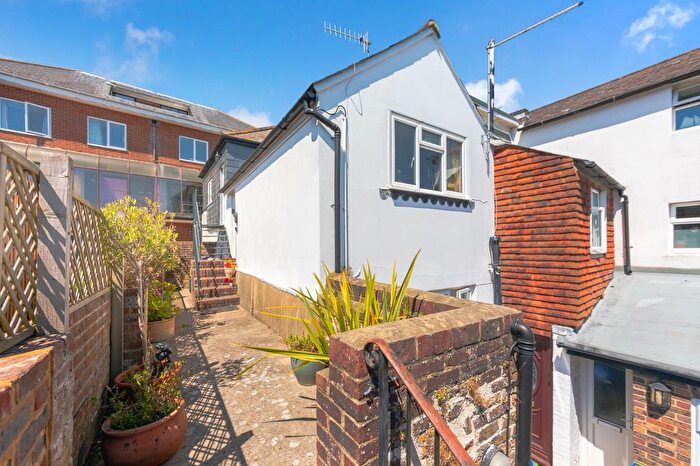
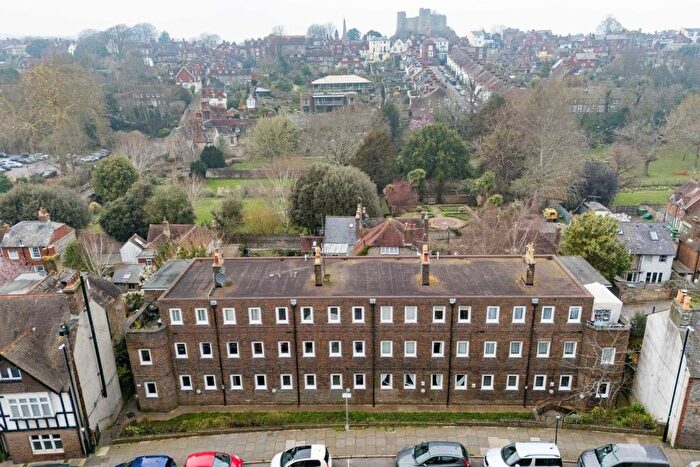
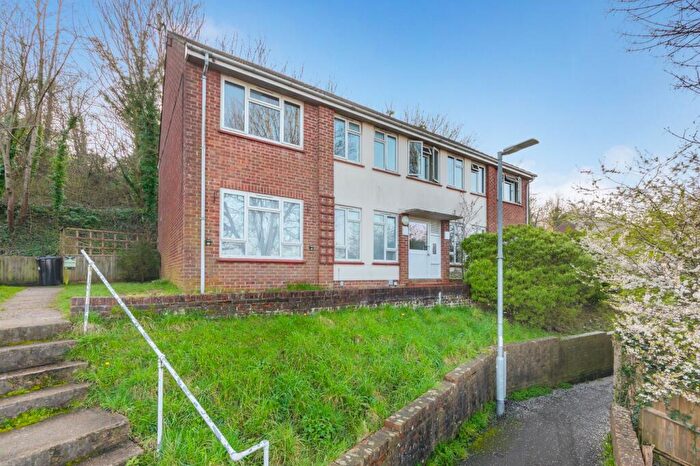
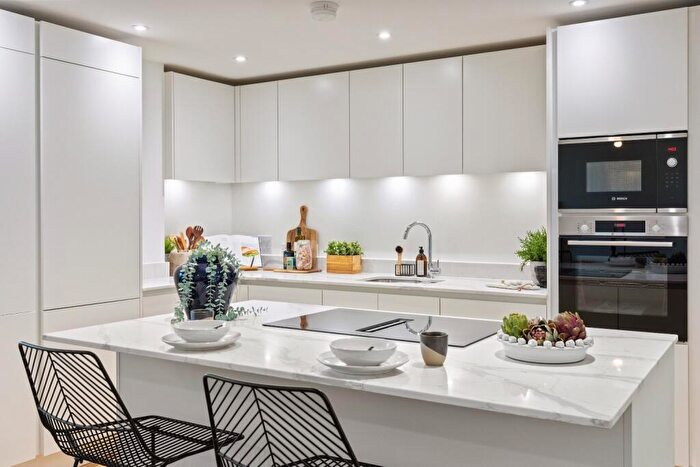
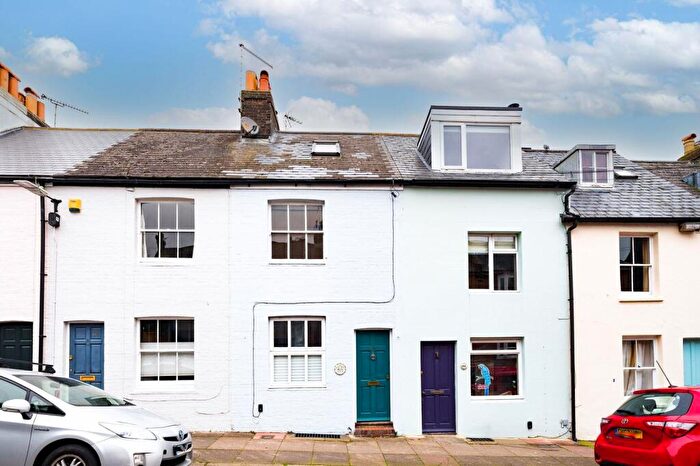
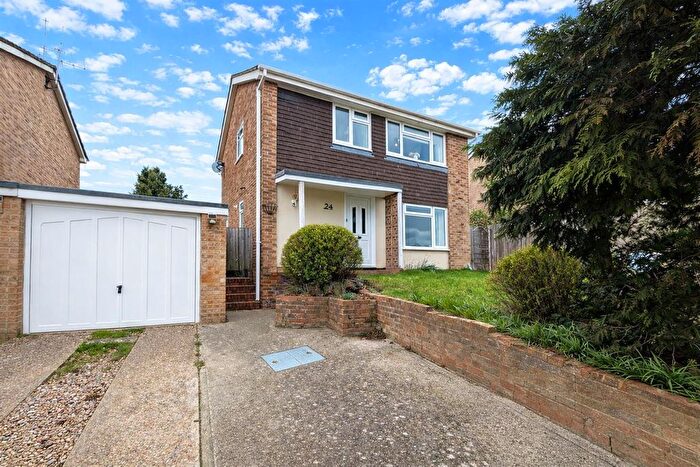
Properties for sale in Lewes

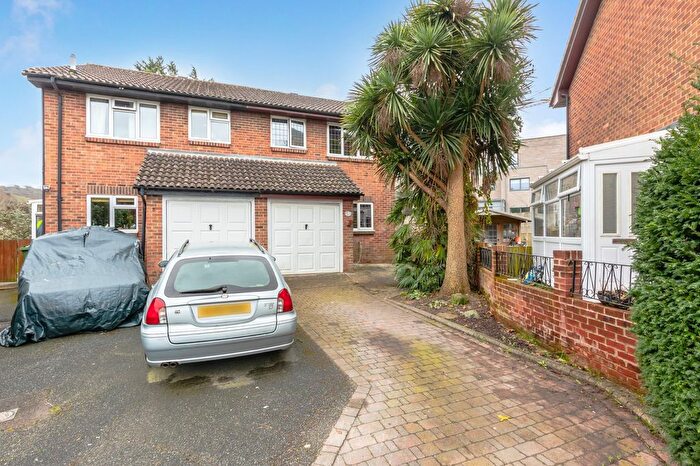

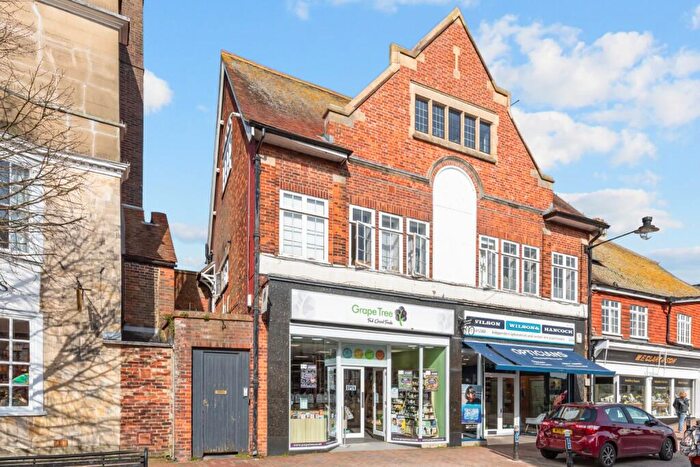

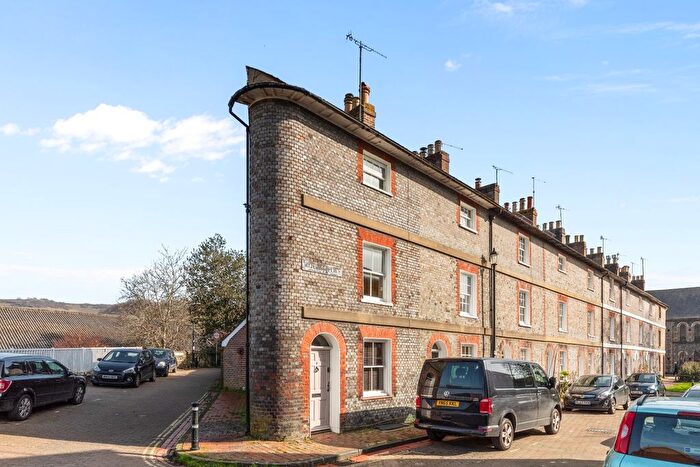
![]()
If you are looking to sell your house, let it out, or receive a property valuation, an expert can help you.
Click the button below to get started.

Neighbourhoods in Lewes
Navigate through our locations to find the location of your next house in Lewes, East Sussex for sale or to rent.
- Alfriston
- Barcombe And Hamsey
- Chailey And Wivelsfield
- Chiddingly And East Hoathly
- Danehill/fletching/nutley
- East Saltdean And Telscombe Cliffs
- Kingston
- Lewes Bridge
- Lewes Castle
- Lewes Priory
- Newick
- Ouse Valley And Ringmer
- Plumpton, Streat, East Chiltington And St John (without)
- Plumpton, Streat, East Chiltington & St John
- Chailey, Barcombe & Hamsey
- Danehill & Fletching
- Ouse Valley & Ringmer
- Uckfield Ridgewood & Little Horsted
- Chiddingly, East Hoathly & Waldron
- Arlington
- High Weald
Transport in Lewes
Please see below transportation links in this area:

- FAQ
- Price Paid By Year
- Property Type Price
Frequently asked questions about Lewes
What is the average price for a property for sale in Lewes?
The average price for a property for sale in Lewes is £562,663. This amount is 47% higher than the average price in East Sussex. There are more than 10,000 property listings for sale in Lewes.
What locations have the most expensive properties for sale in Lewes?
The locations with the most expensive properties for sale in Lewes are Alfriston at an average of £1,000,250, Ouse Valley & Ringmer at an average of £883,325 and Kingston at an average of £776,001.
What locations have the most affordable properties for sale in Lewes?
The locations with the most affordable properties for sale in Lewes are Lewes Bridge at an average of £434,871, Chailey, Barcombe & Hamsey at an average of £438,361 and Ouse Valley And Ringmer at an average of £477,995.
Which train stations are available in or near Lewes?
Some of the train stations available in or near Lewes are Cooksbridge, Lewes and Glynde.
Property Price Paid in Lewes by Year
The average sold property price by year was:
| Year | Average Sold Price | Price Change |
Sold Properties
|
|---|---|---|---|
| 2025 | £536,913 | -7% |
355 Properties |
| 2024 | £575,714 | 1% |
499 Properties |
| 2023 | £568,664 | -4% |
438 Properties |
| 2022 | £590,310 | 5% |
546 Properties |
| 2021 | £562,608 | 8% |
714 Properties |
| 2020 | £515,944 | 9% |
445 Properties |
| 2019 | £471,512 | -0,4% |
529 Properties |
| 2018 | £473,293 | 4% |
485 Properties |
| 2017 | £456,523 | 1% |
498 Properties |
| 2016 | £453,395 | 8% |
544 Properties |
| 2015 | £419,056 | 6% |
543 Properties |
| 2014 | £395,443 | 5% |
647 Properties |
| 2013 | £374,560 | - |
552 Properties |
| 2012 | £374,652 | 3% |
491 Properties |
| 2011 | £362,198 | 1% |
454 Properties |
| 2010 | £357,797 | 15% |
521 Properties |
| 2009 | £304,833 | -14% |
555 Properties |
| 2008 | £346,673 | -1% |
430 Properties |
| 2007 | £350,146 | 16% |
728 Properties |
| 2006 | £293,542 | 6% |
851 Properties |
| 2005 | £277,175 | 3% |
594 Properties |
| 2004 | £268,196 | 12% |
687 Properties |
| 2003 | £235,016 | 11% |
692 Properties |
| 2002 | £210,213 | 10% |
758 Properties |
| 2001 | £189,046 | 8% |
670 Properties |
| 2000 | £173,438 | 20% |
628 Properties |
| 1999 | £139,460 | 13% |
824 Properties |
| 1998 | £121,205 | 10% |
692 Properties |
| 1997 | £109,234 | 11% |
793 Properties |
| 1996 | £97,314 | 4% |
718 Properties |
| 1995 | £93,179 | - |
490 Properties |
Property Price per Property Type in Lewes
Here you can find historic sold price data in order to help with your property search.
The average Property Paid Price for specific property types in the last three years are:
| Property Type | Average Sold Price | Sold Properties |
|---|---|---|
| Semi Detached House | £543,592.00 | 362 Semi Detached Houses |
| Terraced House | £504,598.00 | 385 Terraced Houses |
| Detached House | £856,325.00 | 322 Detached Houses |
| Flat | £269,835.00 | 223 Flats |