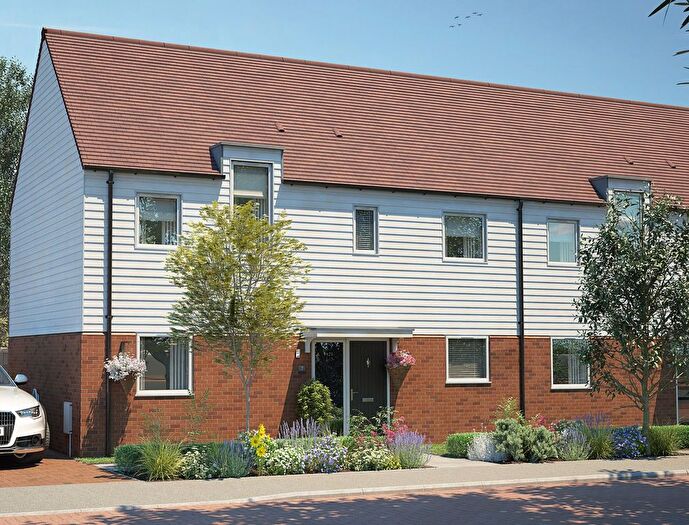
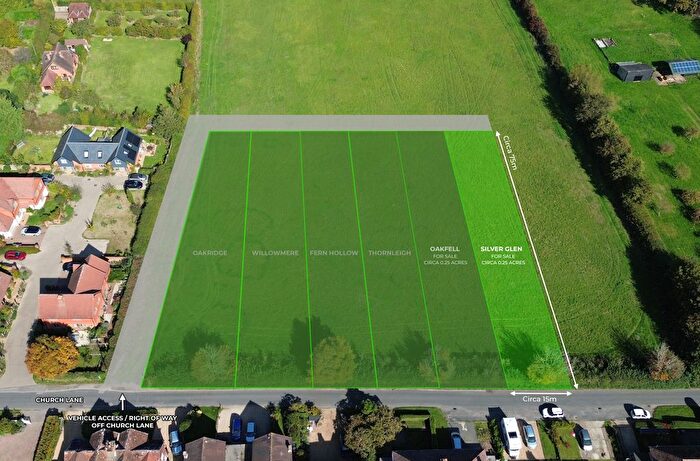
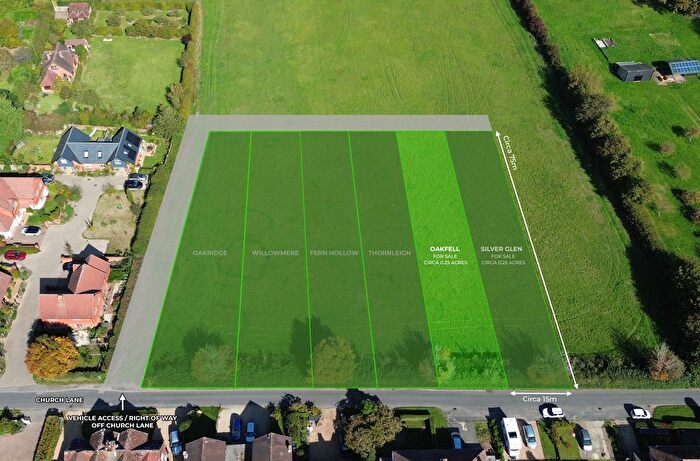
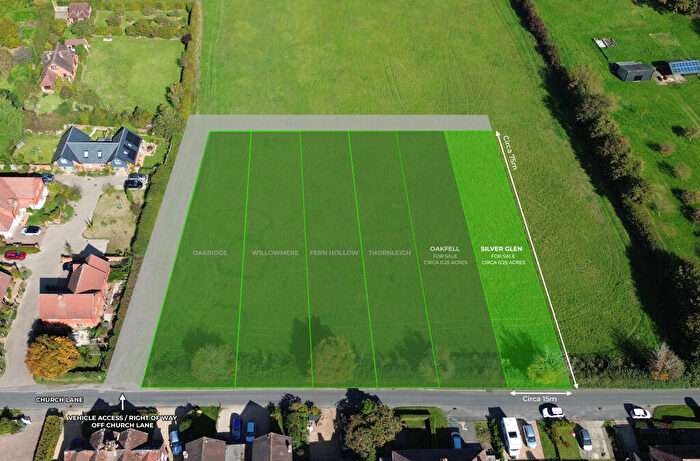
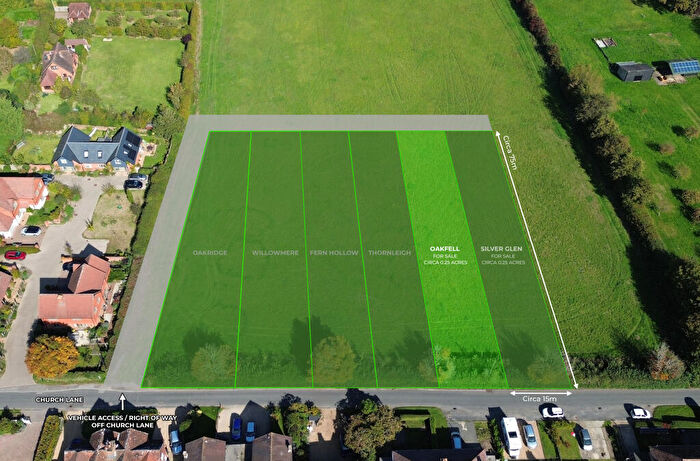
Houses for sale & to rent in Chiddingly And East Hoathly, Lewes
House Prices in Chiddingly And East Hoathly
Properties in Chiddingly And East Hoathly have an average house price of £654,527.00 and had 96 Property Transactions within the last 3 years¹.
Chiddingly And East Hoathly is an area in Lewes, East Sussex with 1,025 households², where the most expensive property was sold for £3,000,000.00.
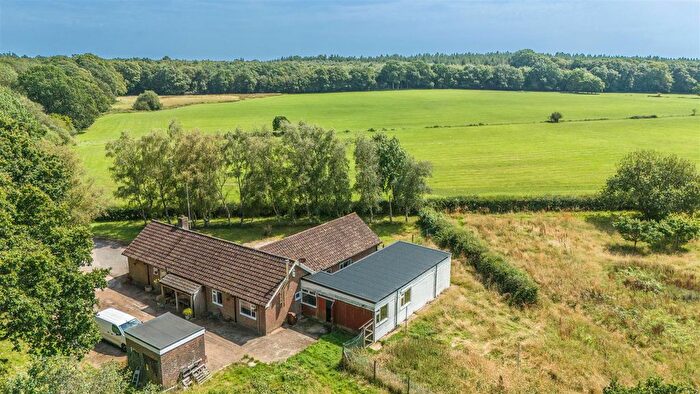
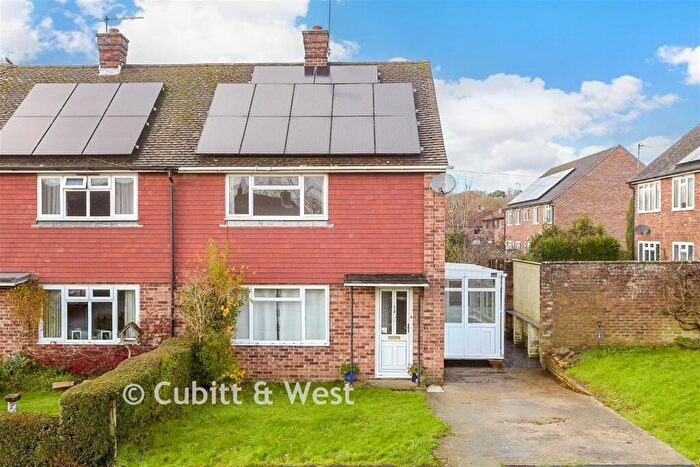
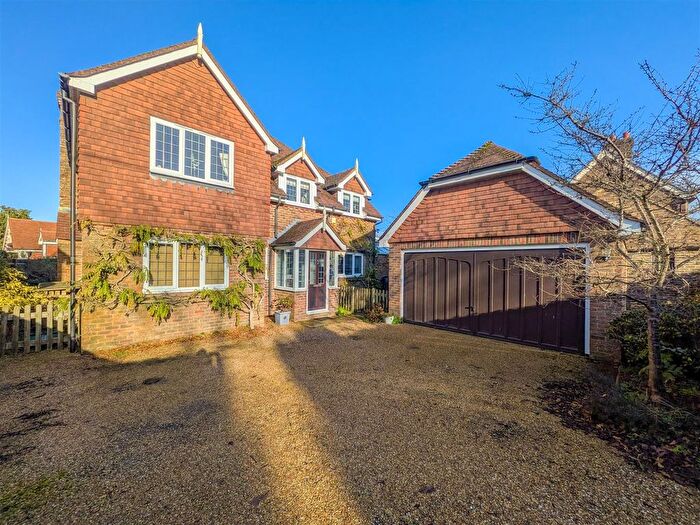
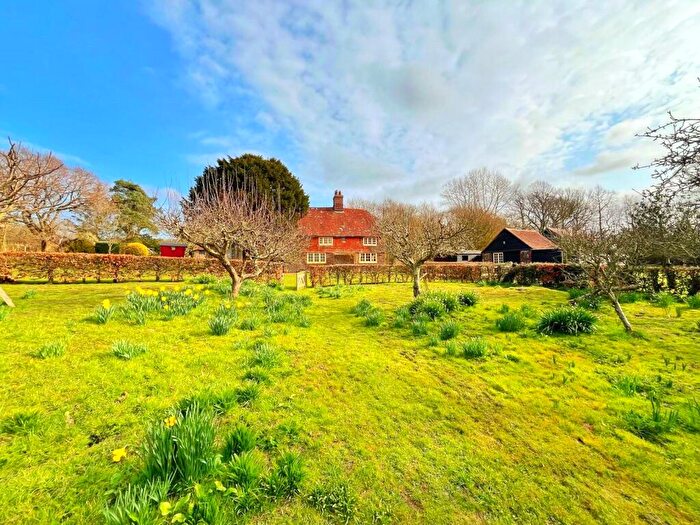
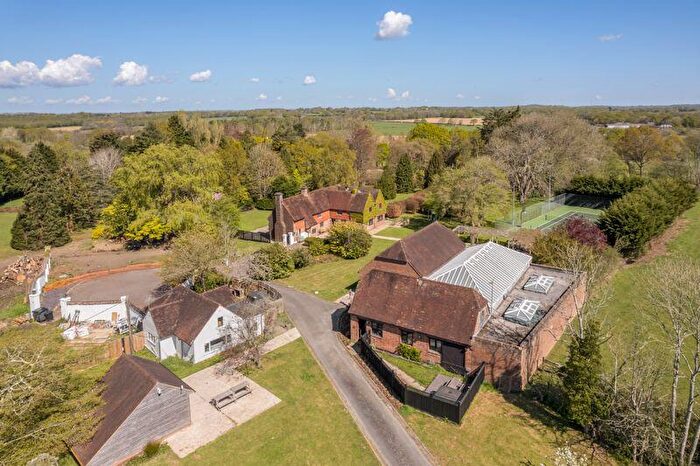
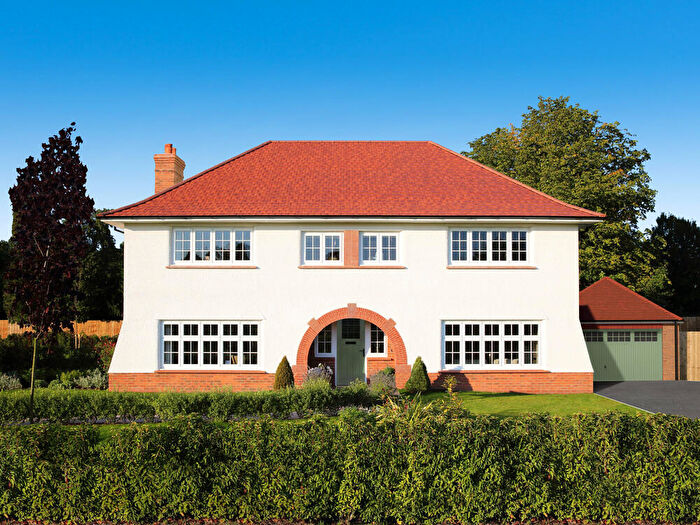
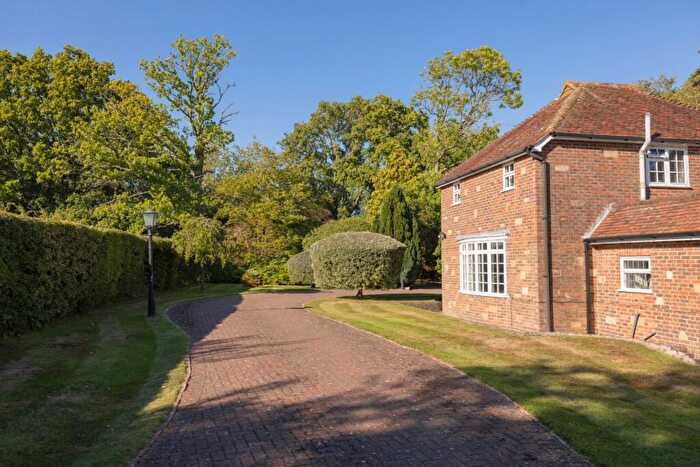
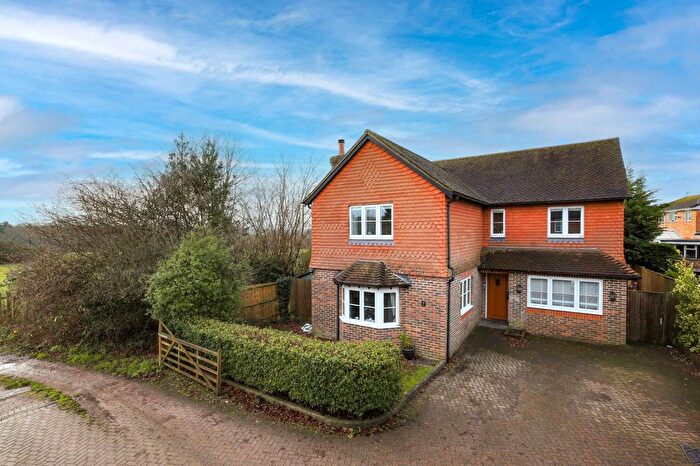
Properties for sale in Chiddingly And East Hoathly
Roads and Postcodes in Chiddingly And East Hoathly
Navigate through our locations to find the location of your next house in Chiddingly And East Hoathly, Lewes for sale or to rent.
| Streets | Postcodes |
|---|---|
| Ailies Lane | BN8 6QP |
| Brickhurst Lane | BN8 6DD |
| Broomham Lane | BN8 6JQ |
| Burgh Hill Road | BN8 6JF |
| Buttsfield Lane | BN8 6EE BN8 6EF |
| Carpenters Croft | BN8 6DL |
| Church Lane | BN8 6AH |
| Church Marks Lane | BN8 6EQ |
| Cider House Walk | BN8 6ED |
| Decoy Cottages | BN8 6DJ |
| Eastbourne Road | BN8 6PS BN8 6PT BN8 6PU |
| Easthaven Cottages | BN8 6JB |
| Elm Close | BN8 6BW |
| Graywood Lane | BN8 6QR BN8 6QT BN8 6QU |
| Heathfield Road | BN8 6PW |
| High Street | BN8 6DR BN8 6EB |
| Holdcroft Lane | BN8 6QD |
| Holmes Hill | BN8 6JA |
| Juziers Drive | BN8 6AE |
| Knowle Lane | BN8 6PR |
| Laughton Place | BN8 6DA |
| Lewes Road | BN8 6BJ BN8 6BL BN8 6BN BN8 6BQ BN8 6PL BN8 6PN |
| London Road | BN8 6EL BN8 6QA |
| Mill Lane | BN8 6AJ BN8 6QB |
| Muddles Green | BN8 6HN BN8 6HP BN8 6HR BN8 6HS BN8 6HW |
| Nightingales | BN8 6DN |
| Old Heath Close | BN8 6PQ |
| Park Corner | BN8 6RD |
| Park Lane | BN8 6BP |
| Pound Lane | BN8 6BE |
| Rectory Close | BN8 6EG |
| Shortgate Lane | BN8 6DE BN8 6DF BN8 6DQ |
| South Street | BN8 6DS BN8 6DT |
| Stalkers Lane | BN8 6QS |
| Susans Close | BN8 6QE |
| Terrible Down Road | BN8 6PJ |
| The Mews | BN8 6EH |
| The Street | BN8 6HT |
| Thomas Turner Drive | BN8 6QF |
| Trug Close | BN8 6AF |
| Waldron Road | BN8 6DP |
| BN8 6BU BN8 6BX BN8 6BY BN8 6DB BN8 6HA BN8 6HD BN8 6HE BN8 6HF BN8 6HG BN8 6HH BN8 6HJ BN8 6HL BN8 6HQ BN8 6JD BN8 6JE BN8 6JG BN8 6QH BN8 6QJ BN8 6QL BN8 6QX BN8 6RA BN8 6RB |
Transport near Chiddingly And East Hoathly
-
Uckfield Station
-
Berwick (Sussex) Station
-
Buxted Station
-
Glynde Station
-
Lewes Station
-
Polegate Station
-
Cooksbridge Station
-
Southease Station
-
Crowborough Station
-
Newhaven Town Station
- FAQ
- Price Paid By Year
- Property Type Price
Frequently asked questions about Chiddingly And East Hoathly
What is the average price for a property for sale in Chiddingly And East Hoathly?
The average price for a property for sale in Chiddingly And East Hoathly is £654,527. This amount is 14% higher than the average price in Lewes. There are 785 property listings for sale in Chiddingly And East Hoathly.
What streets have the most expensive properties for sale in Chiddingly And East Hoathly?
The streets with the most expensive properties for sale in Chiddingly And East Hoathly are Holdcroft Lane at an average of £975,000, Shortgate Lane at an average of £707,666 and Muddles Green at an average of £705,350.
What streets have the most affordable properties for sale in Chiddingly And East Hoathly?
The streets with the most affordable properties for sale in Chiddingly And East Hoathly are Pound Lane at an average of £345,000, Rectory Close at an average of £345,000 and Elm Close at an average of £355,000.
Which train stations are available in or near Chiddingly And East Hoathly?
Some of the train stations available in or near Chiddingly And East Hoathly are Uckfield, Berwick (Sussex) and Buxted.
Property Price Paid in Chiddingly And East Hoathly by Year
The average sold property price by year was:
| Year | Average Sold Price | Price Change |
Sold Properties
|
|---|---|---|---|
| 2025 | £518,531 | -26% |
16 Properties |
| 2024 | £655,438 | 4% |
31 Properties |
| 2023 | £629,880 | -19% |
21 Properties |
| 2022 | £749,714 | 10% |
28 Properties |
| 2021 | £677,608 | 5% |
46 Properties |
| 2020 | £640,425 | 20% |
35 Properties |
| 2019 | £511,840 | -11% |
32 Properties |
| 2018 | £567,645 | 17% |
31 Properties |
| 2017 | £470,357 | 1% |
49 Properties |
| 2016 | £465,253 | -13% |
41 Properties |
| 2015 | £526,926 | 24% |
37 Properties |
| 2014 | £399,747 | 7% |
47 Properties |
| 2013 | £370,692 | -43% |
26 Properties |
| 2012 | £529,484 | 19% |
33 Properties |
| 2011 | £426,474 | 8% |
25 Properties |
| 2010 | £391,420 | 14% |
50 Properties |
| 2009 | £338,502 | -23% |
55 Properties |
| 2008 | £416,764 | 4% |
26 Properties |
| 2007 | £398,975 | 18% |
44 Properties |
| 2006 | £326,309 | -8% |
33 Properties |
| 2005 | £352,402 | 2% |
21 Properties |
| 2004 | £345,686 | 8% |
27 Properties |
| 2003 | £319,075 | 16% |
35 Properties |
| 2002 | £268,825 | 1% |
52 Properties |
| 2001 | £264,950 | 18% |
39 Properties |
| 2000 | £216,988 | 22% |
53 Properties |
| 1999 | £168,979 | 10% |
72 Properties |
| 1998 | £152,429 | -11% |
46 Properties |
| 1997 | £168,526 | 32% |
53 Properties |
| 1996 | £114,431 | -2% |
46 Properties |
| 1995 | £116,227 | - |
33 Properties |
Property Price per Property Type in Chiddingly And East Hoathly
Here you can find historic sold price data in order to help with your property search.
The average Property Paid Price for specific property types in the last three years are:
| Property Type | Average Sold Price | Sold Properties |
|---|---|---|
| Semi Detached House | £482,471.00 | 32 Semi Detached Houses |
| Detached House | £871,966.00 | 45 Detached Houses |
| Terraced House | £381,466.00 | 15 Terraced Houses |
| Flat | £608,750.00 | 4 Flats |

