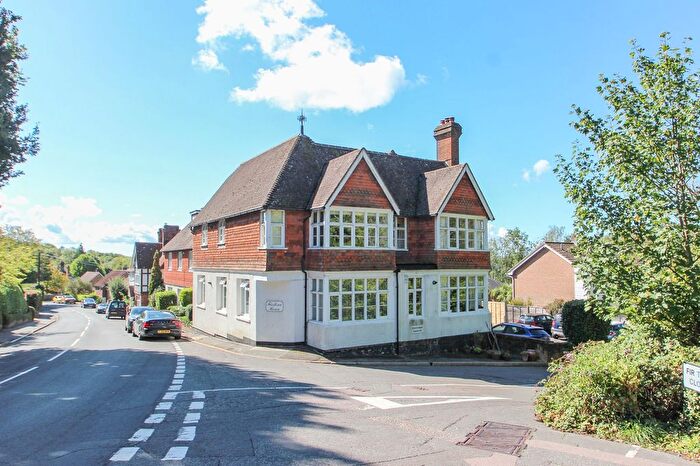
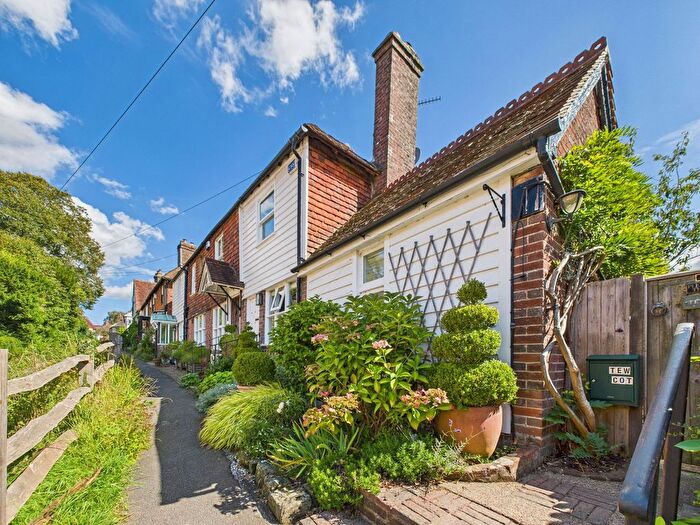
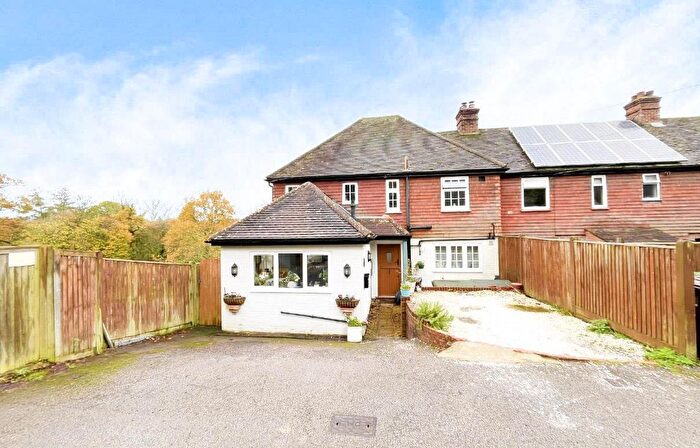
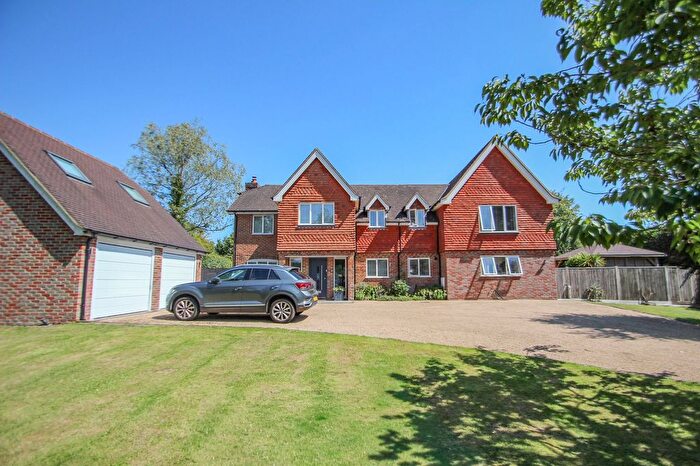
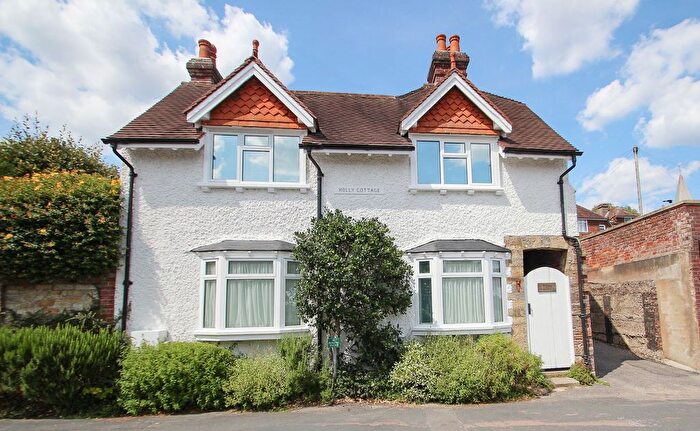
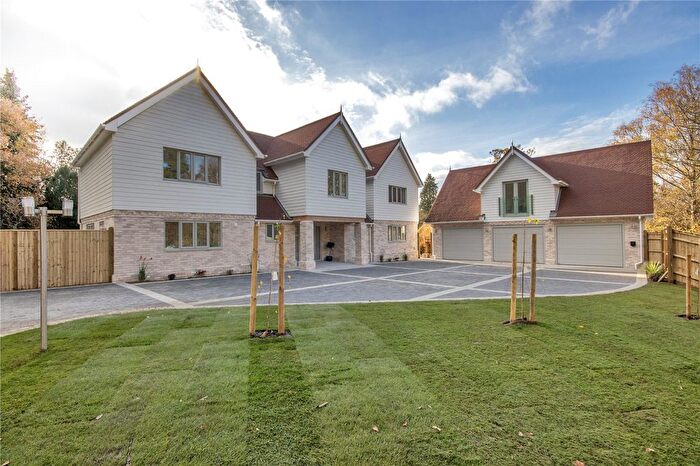
Houses for sale & to rent in Mayfield, Mayfield
House Prices in Mayfield
Properties in Mayfield have an average house price of £663,803.00 and had 127 Property Transactions within the last 3 years¹.
Mayfield is an area in Mayfield, East Sussex with 1,042 households², where the most expensive property was sold for £2,370,000.00.
Properties for sale in Mayfield
Previously listed properties in Mayfield
Roads and Postcodes in Mayfield
Navigate through our locations to find the location of your next house in Mayfield, Mayfield for sale or to rent.
| Streets | Postcodes |
|---|---|
| Albert Villas | TN20 6BN |
| Alexandra Road | TN20 6UD TN20 6UE TN20 6UF |
| Alexandra Terrace | TN20 6UG |
| Argos Hill | TN20 6NR TN20 6NS |
| Ashley Gardens | TN20 6DU |
| Bassetts Lane | TN20 6NX |
| Berkeley Road | TN20 6EH |
| Brewers Grove | TN20 6DF |
| Coggins Mill Lane | TN20 6UL TN20 6UN TN20 6UP TN20 6UR TN20 6UT |
| Dunstans Croft | TN20 6UH |
| East Street | TN20 6RJ TN20 6TU TN20 6TX TN20 6TY TN20 6TZ TN20 6UA |
| Fairview Cottages | TN20 6RD |
| Fir Toll Close | TN20 6NA TN20 6NY |
| Fir Toll Cottages | TN20 6NE |
| Firtoll Road | TN20 6NB TN20 6ND TN20 6NF TN20 6NG |
| Fletching Street | TN20 6TB TN20 6TD TN20 6TE TN20 6TH TN20 6TJ TN20 6TL TN20 6TN TN20 6TP TN20 6TW |
| High Street | TN20 6AA TN20 6AB TN20 6AL |
| Holders Lane | TN20 6BE |
| Knowle Park | TN20 6DY |
| Little Trodgers Lane | TN20 6PN |
| Love Lane | TN20 6EN |
| Love Lane Terrace | TN20 6ER |
| Loxfield Close | TN20 6DX |
| Mayfield Close | TN20 6EL |
| Newick Lane | TN20 6RA TN20 6RB TN20 6RE TN20 6RF TN20 6RG TN20 6RQ |
| North Street | TN20 6AN |
| Old Lane | TN20 6AU |
| Pennybridge Lane | TN20 6QB |
| Piccadilly Lane | TN20 6RH |
| Richmead Gardens | TN20 6DE |
| Roselands Avenue | TN20 6EB |
| Rotherfield Lane | TN20 6AR TN20 6ET TN20 6EU |
| Rothermead | TN20 6EG |
| Salters Green | TN20 6NP |
| Scotsford Hill | TN20 6RN |
| Shirley Road | TN20 6BG |
| South Street | TN20 6BY TN20 6DA TN20 6DB TN20 6DD |
| Southmead Close | TN20 6UJ |
| St Leonards Lane | TN20 6PA |
| Star Mews | TN20 6AJ |
| Station Road | TN20 6BH TN20 6BL TN20 6BS TN20 6BT TN20 6BU TN20 6BW TN20 6BX |
| Stone Cross Road | TN20 6EJ |
| Sunnybank Close | TN20 6TT |
| The Avenue | TN20 6AY TN20 6TR |
| The Glade | TN20 6AT |
| The Grove | TN20 6AP |
| The Mount | TN20 6AS |
| The Warren | TN20 6UB |
| Tunbridge Wells Road | TN20 6NU TN20 6PJ |
| Vale Road | TN20 6BB TN20 6BD |
| Victoria Road | TN20 6ES |
| Warren Terrace | TN20 6TS |
| Wellbrook Hill | TN20 6EA |
| West Street | TN20 6BA TN20 6DR TN20 6DS TN20 6DT |
| Witherenden Road | TN20 6RR TN20 6RS |
| TN20 6ED TN20 6EE TN20 6HH TN20 6HJ TN20 6HL TN20 6NH TN20 6QA |
Transport near Mayfield
- FAQ
- Price Paid By Year
- Property Type Price
Frequently asked questions about Mayfield
What is the average price for a property for sale in Mayfield?
The average price for a property for sale in Mayfield is £663,803. This amount is 4% lower than the average price in Mayfield. There are 365 property listings for sale in Mayfield.
What streets have the most expensive properties for sale in Mayfield?
The streets with the most expensive properties for sale in Mayfield are Wellbrook Hill at an average of £1,048,333, Argos Hill at an average of £1,005,900 and Firtoll Road at an average of £885,062.
What streets have the most affordable properties for sale in Mayfield?
The streets with the most affordable properties for sale in Mayfield are Dunstans Croft at an average of £345,500, High Street at an average of £361,000 and Star Mews at an average of £372,500.
Which train stations are available in or near Mayfield?
Some of the train stations available in or near Mayfield are Crowborough, Wadhurst and Stonegate.
Property Price Paid in Mayfield by Year
The average sold property price by year was:
| Year | Average Sold Price | Price Change |
Sold Properties
|
|---|---|---|---|
| 2025 | £538,013 | -11% |
22 Properties |
| 2024 | £595,218 | -10% |
32 Properties |
| 2023 | £657,326 | -17% |
23 Properties |
| 2022 | £766,024 | 16% |
50 Properties |
| 2021 | £643,076 | 0,5% |
66 Properties |
| 2020 | £640,108 | 4% |
44 Properties |
| 2019 | £611,453 | 4% |
32 Properties |
| 2018 | £587,555 | 15% |
36 Properties |
| 2017 | £501,503 | -17% |
39 Properties |
| 2016 | £585,811 | 15% |
56 Properties |
| 2015 | £495,469 | 5% |
46 Properties |
| 2014 | £468,696 | 11% |
56 Properties |
| 2013 | £419,062 | -4% |
40 Properties |
| 2012 | £436,064 | -5% |
41 Properties |
| 2011 | £456,877 | 2% |
47 Properties |
| 2010 | £448,508 | 6% |
45 Properties |
| 2009 | £420,268 | 0,2% |
29 Properties |
| 2008 | £419,224 | 11% |
22 Properties |
| 2007 | £371,638 | -11% |
58 Properties |
| 2006 | £412,572 | 9% |
56 Properties |
| 2005 | £376,167 | 5% |
48 Properties |
| 2004 | £358,775 | 16% |
36 Properties |
| 2003 | £299,816 | 8% |
55 Properties |
| 2002 | £276,749 | 10% |
53 Properties |
| 2001 | £250,355 | 17% |
61 Properties |
| 2000 | £208,040 | 0,5% |
56 Properties |
| 1999 | £207,025 | 24% |
65 Properties |
| 1998 | £158,251 | 3% |
57 Properties |
| 1997 | £153,629 | 24% |
52 Properties |
| 1996 | £117,348 | -24% |
44 Properties |
| 1995 | £145,544 | - |
42 Properties |
Property Price per Property Type in Mayfield
Here you can find historic sold price data in order to help with your property search.
The average Property Paid Price for specific property types in the last three years are:
| Property Type | Average Sold Price | Sold Properties |
|---|---|---|
| Semi Detached House | £505,006.00 | 36 Semi Detached Houses |
| Detached House | £899,971.00 | 60 Detached Houses |
| Terraced House | £399,058.00 | 17 Terraced Houses |
| Flat | £381,464.00 | 14 Flats |

