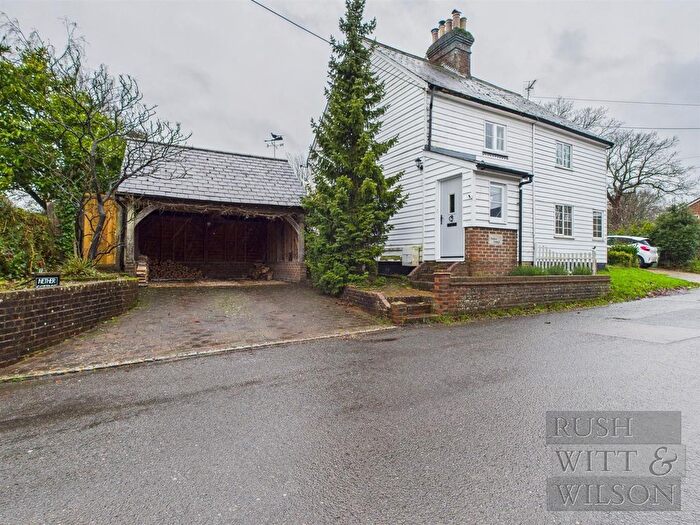
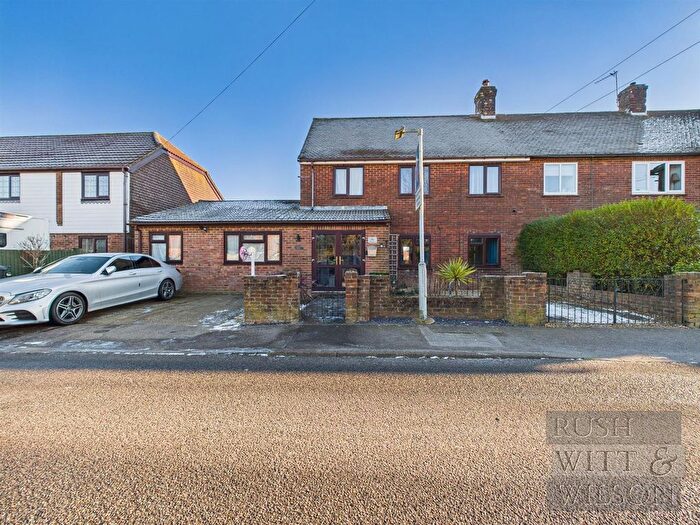
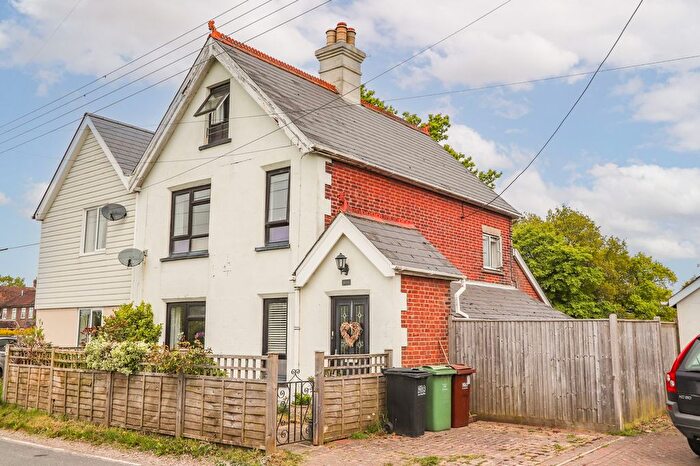
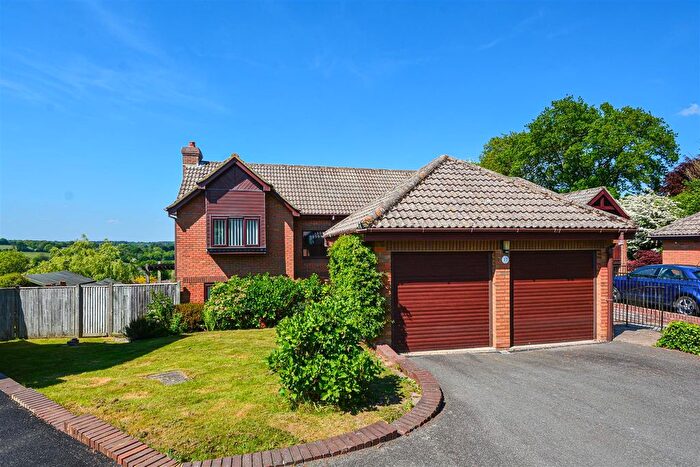
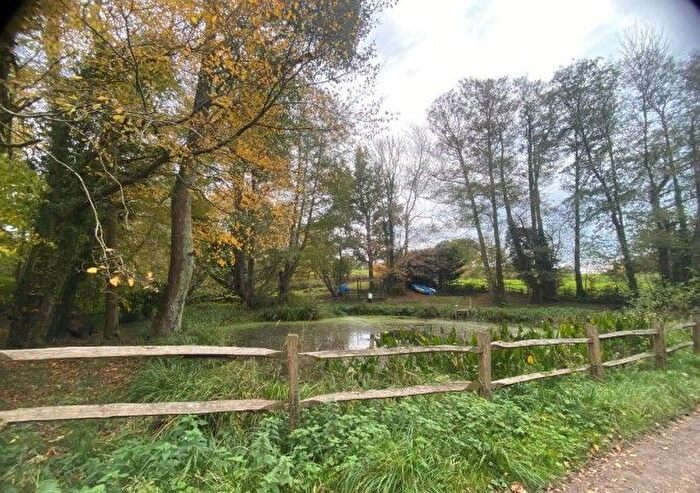
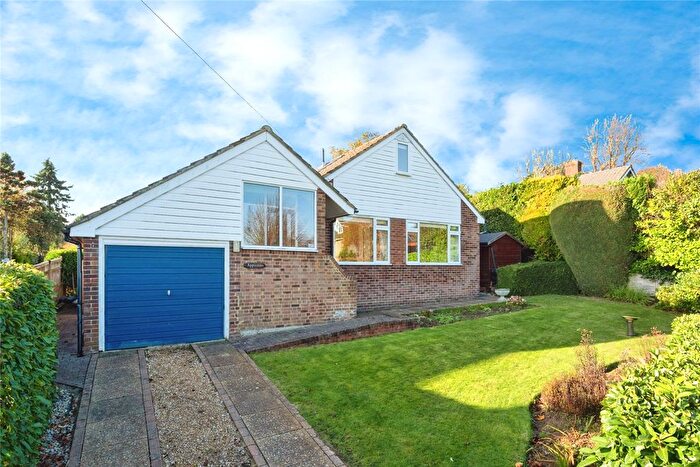
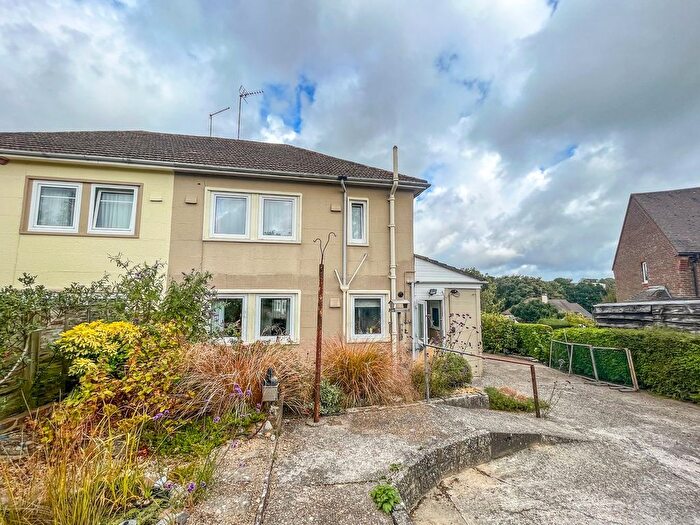
Houses for sale & to rent in Darwell, Robertsbridge
House Prices in Darwell
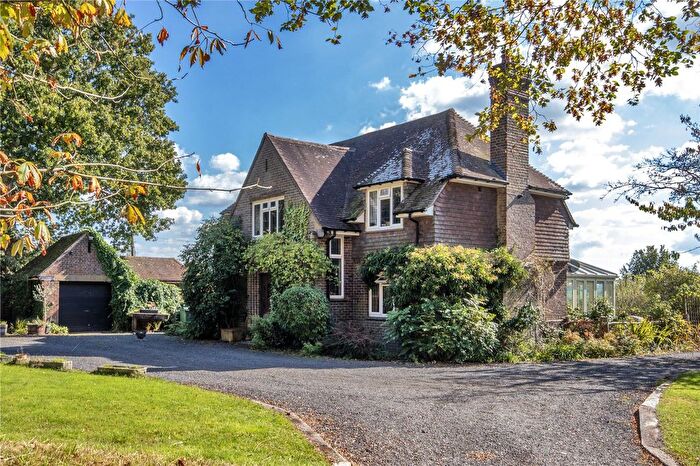
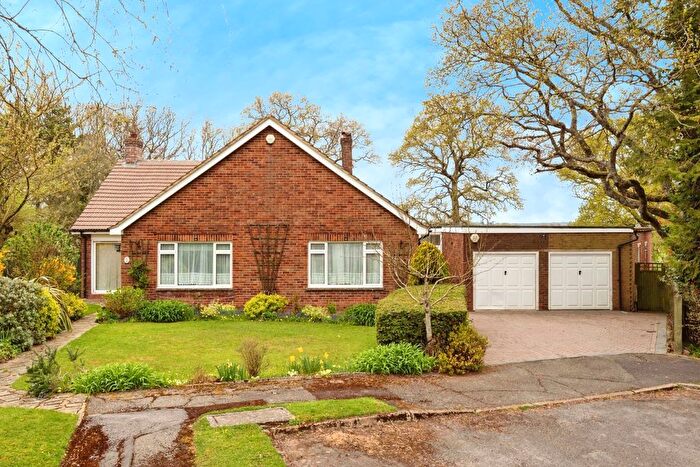
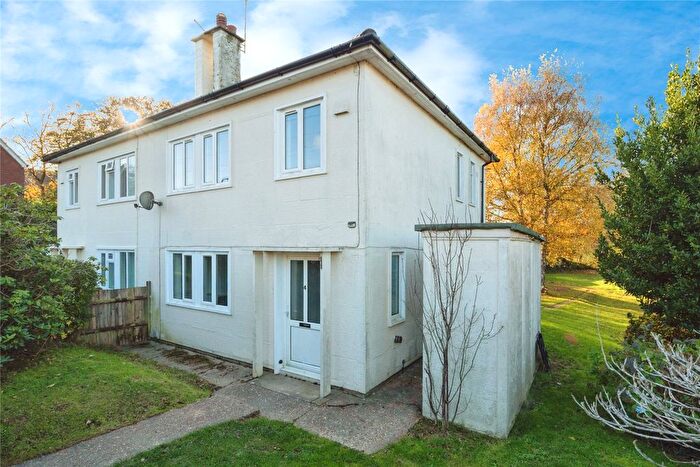
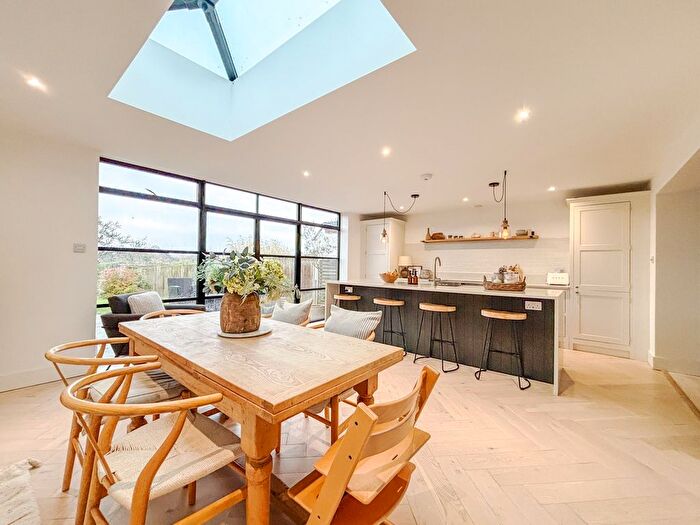
Properties in Darwell have an average house price of £559,751.00 and had 28 Property Transactions within the last 3 years¹.
Darwell is an area in Robertsbridge, East Sussex with 317 households², where the most expensive property was sold for £1,150,000.00.
Properties for sale in Darwell
Previously listed properties in Darwell
Roads and Postcodes in Darwell
Navigate through our locations to find the location of your next house in Darwell, Robertsbridge for sale or to rent.
| Streets | Postcodes |
|---|---|
| Banks Cottages | TN32 5JZ |
| Battle Road | TN32 5HY TN32 5HZ TN32 5JA TN32 5JB TN32 5JH TN32 5QX |
| Bishops Lane | TN32 5EB |
| Brightling Road | TN32 5EU TN32 5EY TN32 5HB |
| Church Cottages | TN32 5JS |
| Eatenden Lane | TN32 5LT |
| Hoath Hill | TN32 5LN |
| London Road | TN32 5LX |
| Longhouses | TN32 5HT |
| Mountfield Lane | TN32 5LD |
| Mountfield Villas | TN32 5LL |
| Rock Cottages | TN32 5JX |
| The Street | TN32 5HH TN32 5HJ |
| Twelve Oaks Cottages | TN32 5HS |
| Vinehall Road | TN32 5JN TN32 5JW |
| TN32 5HD TN32 5HE TN32 5HG TN32 5HL TN32 5HN TN32 5HP TN32 5HU TN32 5JP TN32 5JU TN32 5JY TN32 5LB TN32 5LE TN32 5LG TN32 5LJ TN32 5LP TN32 5LR TN32 5LS TN32 5LY |
Transport near Darwell
- FAQ
- Price Paid By Year
- Property Type Price
Frequently asked questions about Darwell
What is the average price for a property for sale in Darwell?
The average price for a property for sale in Darwell is £559,751. This amount is 0.69% higher than the average price in Robertsbridge. There are 575 property listings for sale in Darwell.
What streets have the most expensive properties for sale in Darwell?
The streets with the most expensive properties for sale in Darwell are The Street at an average of £1,150,000 and Brightling Road at an average of £673,450.
What streets have the most affordable properties for sale in Darwell?
The street with the most affordable properties for sale in Darwell is Mountfield Villas at an average of £425,000.
Which train stations are available in or near Darwell?
Some of the train stations available in or near Darwell are Robertsbridge, Etchingham and Battle.
Property Price Paid in Darwell by Year
The average sold property price by year was:
| Year | Average Sold Price | Price Change |
Sold Properties
|
|---|---|---|---|
| 2025 | £712,600 | -1% |
3 Properties |
| 2024 | £717,312 | 34% |
4 Properties |
| 2023 | £471,227 | -16% |
11 Properties |
| 2022 | £548,250 | 12% |
10 Properties |
| 2021 | £480,310 | -7% |
7 Properties |
| 2020 | £512,277 | -11% |
9 Properties |
| 2019 | £566,666 | 12% |
3 Properties |
| 2018 | £500,125 | -21% |
12 Properties |
| 2017 | £605,928 | 18% |
7 Properties |
| 2016 | £499,156 | 28% |
16 Properties |
| 2015 | £359,227 | 9% |
12 Properties |
| 2014 | £328,084 | -13% |
19 Properties |
| 2013 | £370,492 | 23% |
7 Properties |
| 2012 | £284,318 | 9% |
11 Properties |
| 2011 | £257,454 | -29% |
11 Properties |
| 2010 | £331,437 | -55% |
8 Properties |
| 2009 | £513,153 | 36% |
13 Properties |
| 2008 | £329,357 | -18% |
14 Properties |
| 2007 | £389,028 | -33% |
16 Properties |
| 2006 | £516,000 | 23% |
13 Properties |
| 2005 | £396,000 | 20% |
15 Properties |
| 2004 | £318,750 | 18% |
8 Properties |
| 2003 | £262,433 | -16% |
9 Properties |
| 2002 | £303,418 | 29% |
19 Properties |
| 2001 | £214,060 | -9% |
15 Properties |
| 2000 | £233,000 | 38% |
17 Properties |
| 1999 | £145,288 | -12% |
13 Properties |
| 1998 | £162,634 | 16% |
16 Properties |
| 1997 | £137,385 | 5% |
20 Properties |
| 1996 | £130,108 | -7% |
17 Properties |
| 1995 | £139,642 | - |
14 Properties |
Property Price per Property Type in Darwell
Here you can find historic sold price data in order to help with your property search.
The average Property Paid Price for specific property types in the last three years are:
| Property Type | Average Sold Price | Sold Properties |
|---|---|---|
| Semi Detached House | £444,583.00 | 12 Semi Detached Houses |
| Detached House | £759,420.00 | 12 Detached Houses |
| Terraced House | £306,250.00 | 4 Terraced Houses |

