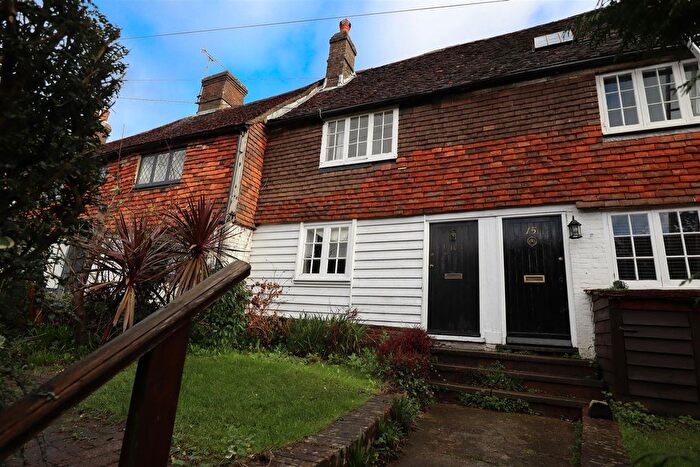
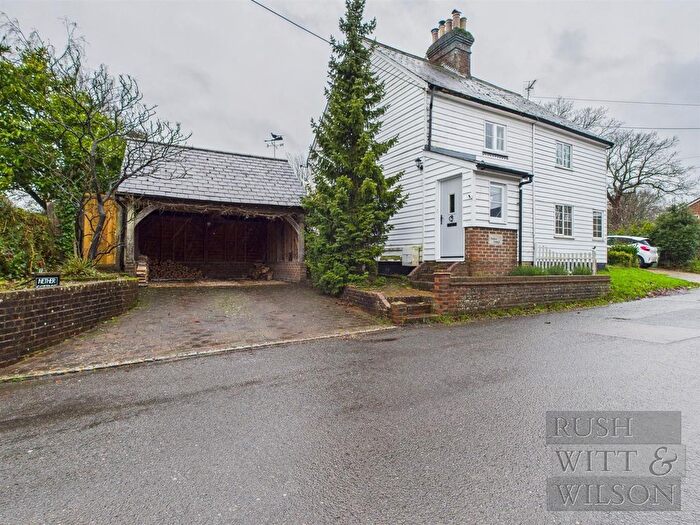
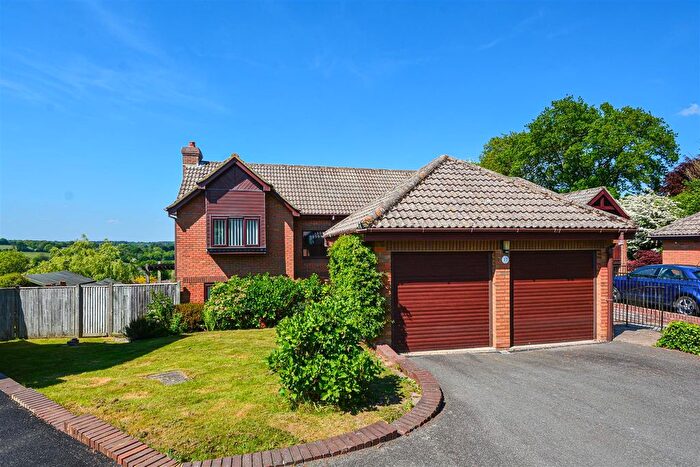
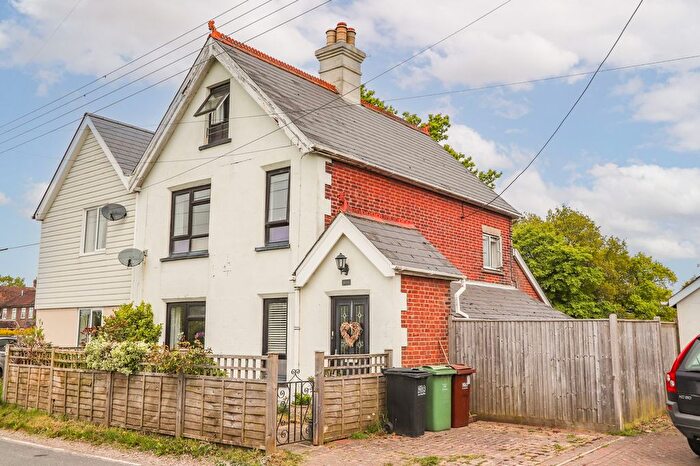
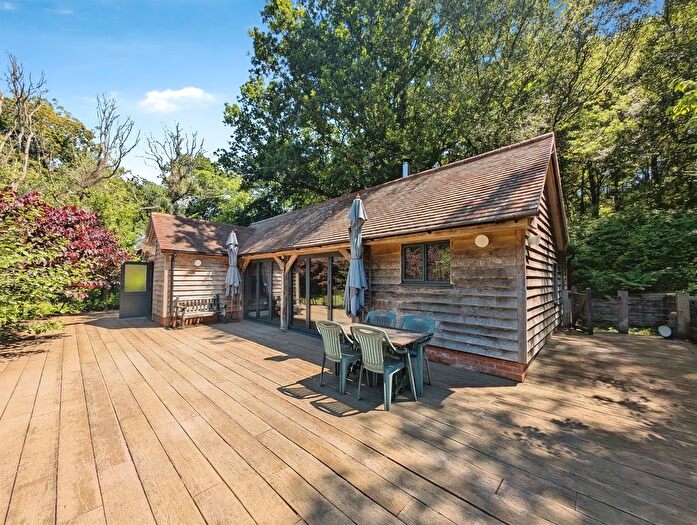
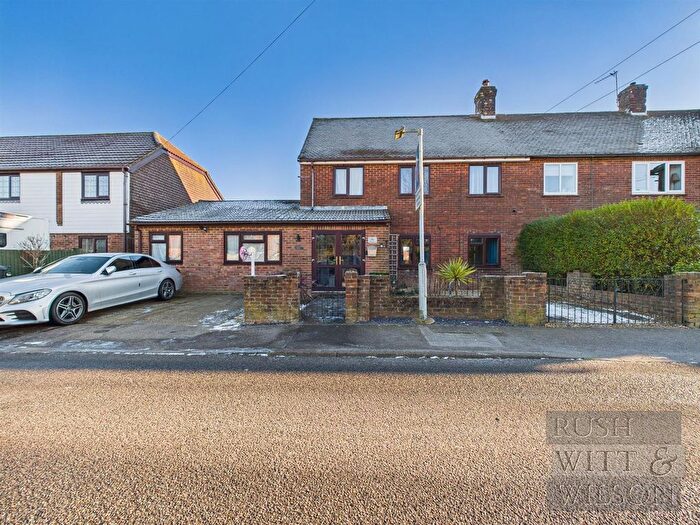
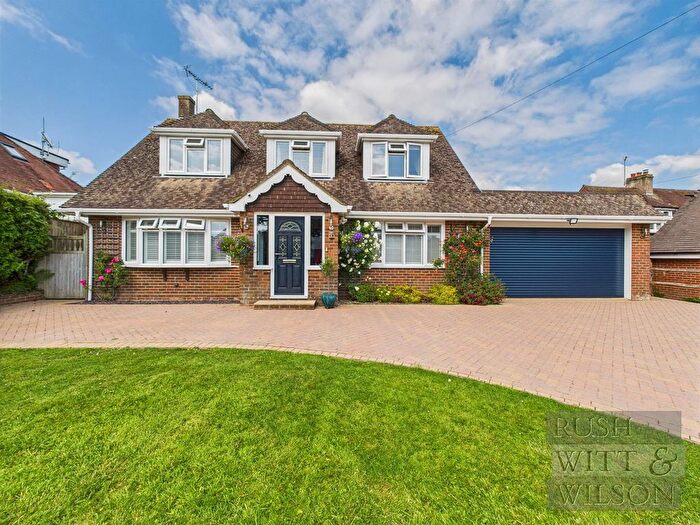
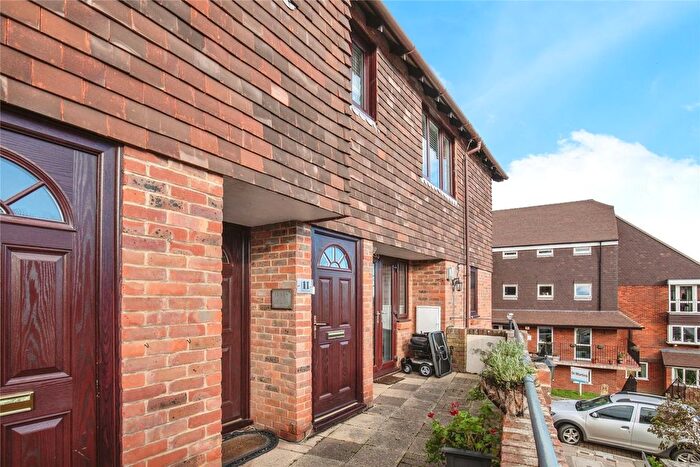
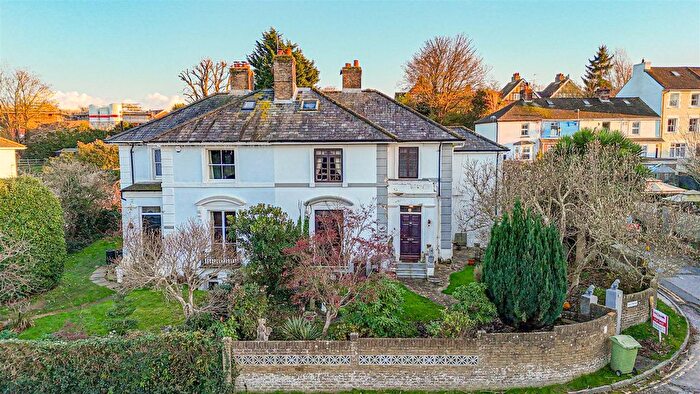
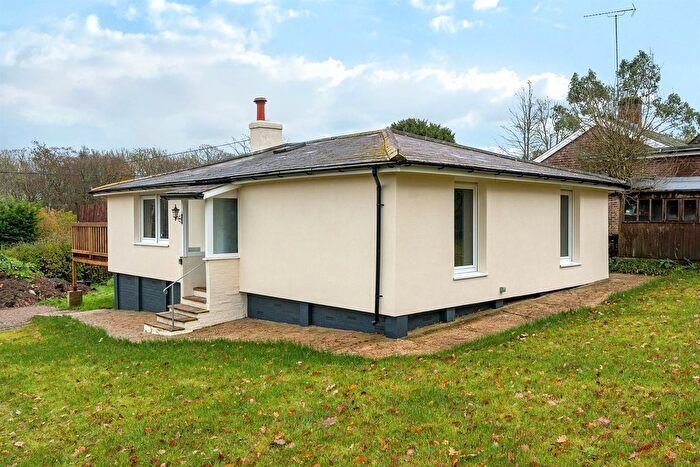
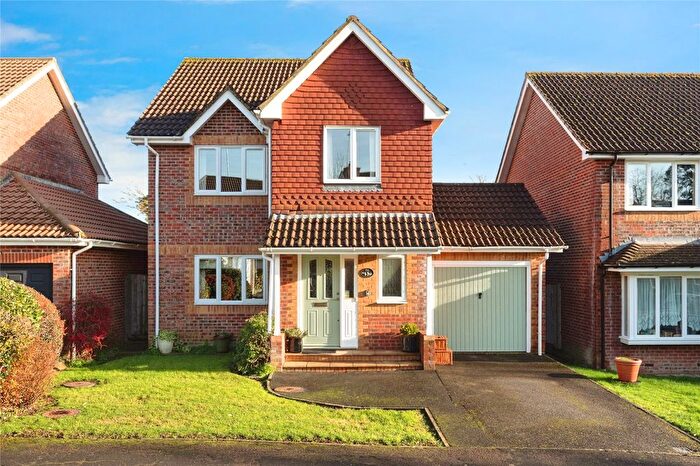
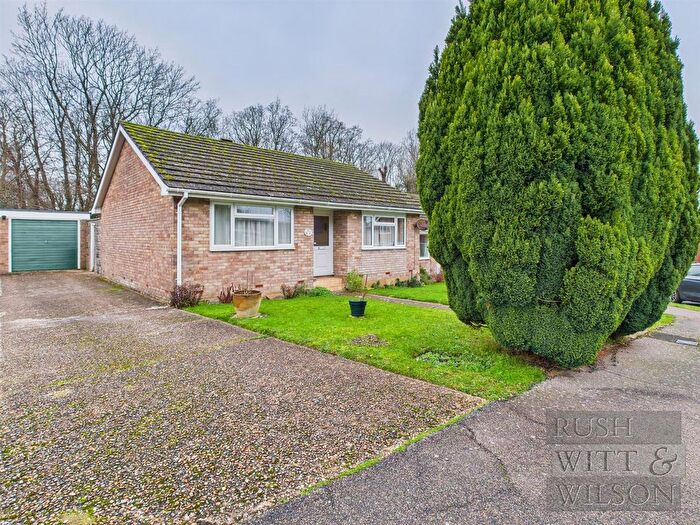
Houses for sale & to rent in Darwell, Battle
House Prices in Darwell
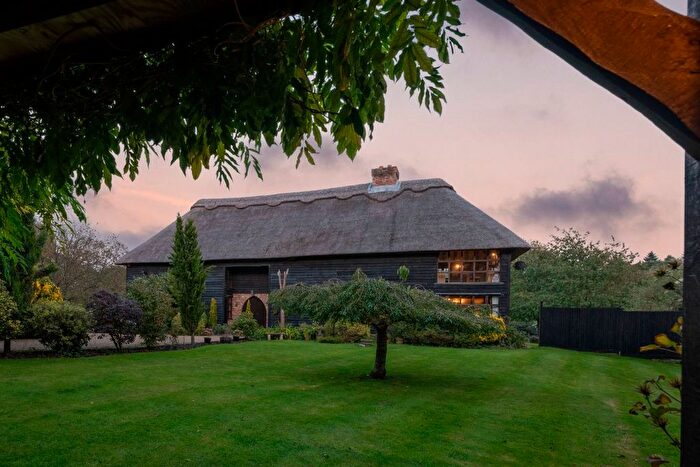
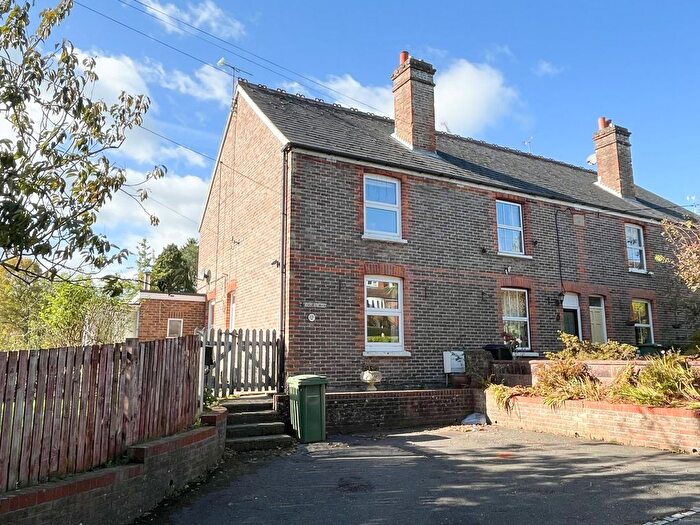
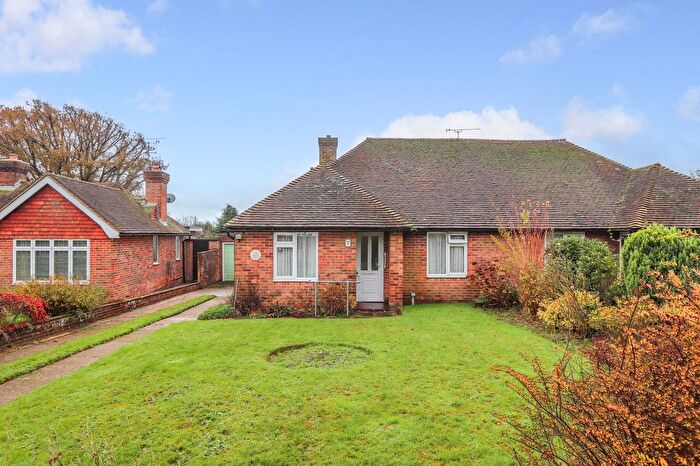
Properties in Darwell have an average house price of £647,910.00 and had 41 Property Transactions within the last 3 years¹.
Darwell is an area in Battle, East Sussex with 434 households², where the most expensive property was sold for £2,400,000.00.
Properties for sale in Darwell
Previously listed properties in Darwell
Roads and Postcodes in Darwell
Navigate through our locations to find the location of your next house in Darwell, Battle for sale or to rent.
| Streets | Postcodes |
|---|---|
| Barley Grattens | TN33 9QG |
| Beech Close | TN33 0LB |
| Darvel Down | TN33 9QE TN33 9QF |
| Darwell Hill | TN33 9QL |
| Eatenden Lane | TN33 9PU |
| Hastings Road | TN33 0NH |
| Hoath Lane | TN33 0NP |
| Ivyland Green | TN33 9QB |
| Netherfield Hill | TN33 0LA TN33 0LE TN33 0LF TN33 0LG TN33 0LH TN33 0LQ |
| Netherfield Road | TN33 9PR TN33 9PX TN33 9PY TN33 9QA TN33 9QD |
| Netherfield Way | TN33 9PZ |
| Park Lane | TN33 0NZ |
| Shooting Box | TN33 9PT |
| Whatlington Road | TN33 0NA TN33 0NB TN33 0ND TN33 0NF |
| Woodmans Green Road | TN33 0NL TN33 0NN TN33 0NR TN33 0NS TN33 0NU |
| TN33 0NJ TN33 0NT TN33 9PP TN33 9PS TN33 9QH |
Transport near Darwell
- FAQ
- Price Paid By Year
- Property Type Price
Frequently asked questions about Darwell
What is the average price for a property for sale in Darwell?
The average price for a property for sale in Darwell is £647,910. This amount is 34% higher than the average price in Battle. There are 667 property listings for sale in Darwell.
What streets have the most expensive properties for sale in Darwell?
The streets with the most expensive properties for sale in Darwell are Woodmans Green Road at an average of £1,072,960, Netherfield Way at an average of £992,500 and Ivyland Green at an average of £745,000.
What streets have the most affordable properties for sale in Darwell?
The streets with the most affordable properties for sale in Darwell are Darvel Down at an average of £352,500, Whatlington Road at an average of £577,291 and Netherfield Hill at an average of £593,496.
Which train stations are available in or near Darwell?
Some of the train stations available in or near Darwell are Battle, Robertsbridge and Crowhurst.
Property Price Paid in Darwell by Year
The average sold property price by year was:
| Year | Average Sold Price | Price Change |
Sold Properties
|
|---|---|---|---|
| 2025 | £666,000 | 15% |
5 Properties |
| 2024 | £569,405 | -32% |
14 Properties |
| 2023 | £753,483 | 17% |
12 Properties |
| 2022 | £622,087 | 13% |
10 Properties |
| 2021 | £540,526 | 4% |
17 Properties |
| 2020 | £517,745 | 18% |
12 Properties |
| 2019 | £425,150 | -2% |
10 Properties |
| 2018 | £432,945 | -2% |
10 Properties |
| 2017 | £441,733 | -13% |
15 Properties |
| 2016 | £500,285 | 26% |
14 Properties |
| 2015 | £372,701 | -15% |
13 Properties |
| 2014 | £427,145 | 28% |
10 Properties |
| 2013 | £308,665 | -8% |
22 Properties |
| 2012 | £332,496 | -11% |
16 Properties |
| 2011 | £369,500 | -6% |
14 Properties |
| 2010 | £390,750 | 25% |
8 Properties |
| 2009 | £292,996 | -15% |
15 Properties |
| 2008 | £338,158 | 18% |
6 Properties |
| 2007 | £278,975 | -23% |
22 Properties |
| 2006 | £343,319 | 27% |
23 Properties |
| 2005 | £249,811 | -10% |
17 Properties |
| 2004 | £274,282 | 8% |
19 Properties |
| 2003 | £252,751 | 18% |
17 Properties |
| 2002 | £206,282 | 20% |
29 Properties |
| 2001 | £164,406 | -14% |
18 Properties |
| 2000 | £186,756 | 29% |
24 Properties |
| 1999 | £131,999 | 13% |
15 Properties |
| 1998 | £115,205 | -10% |
17 Properties |
| 1997 | £126,702 | 31% |
21 Properties |
| 1996 | £87,907 | 1% |
14 Properties |
| 1995 | £86,733 | - |
18 Properties |
Property Price per Property Type in Darwell
Here you can find historic sold price data in order to help with your property search.
The average Property Paid Price for specific property types in the last three years are:
| Property Type | Average Sold Price | Sold Properties |
|---|---|---|
| Semi Detached House | £442,000.00 | 10 Semi Detached Houses |
| Terraced House | £367,500.00 | 4 Terraced Houses |
| Detached House | £765,716.00 | 27 Detached Houses |

