
Houses for sale & to rent in Rye, Rye
House Prices in Rye
Properties in Rye have an average house price of £441k and had 245 Property Transactions within the last 3 years¹.
Rye is an area in Rye, East Sussex with 1,995 households², where the most expensive property was sold for £3.74M.
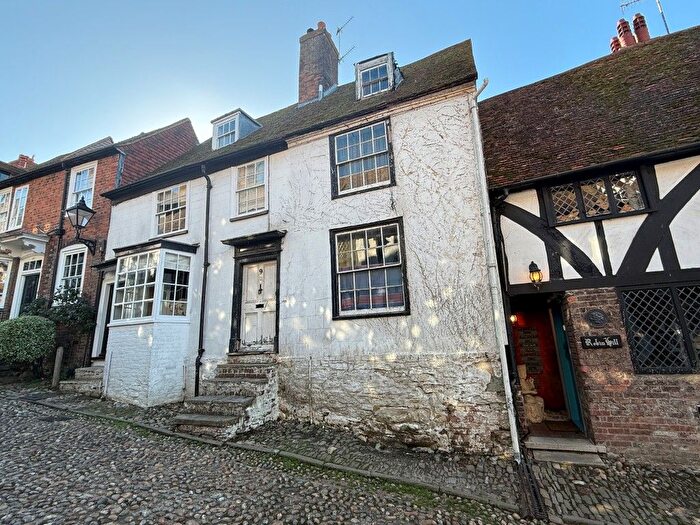
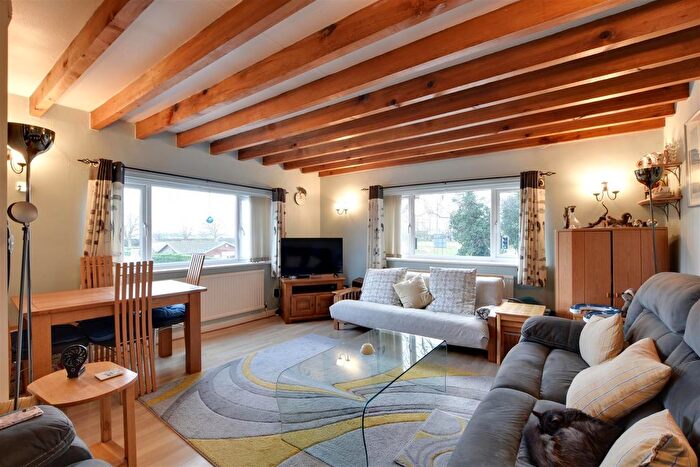
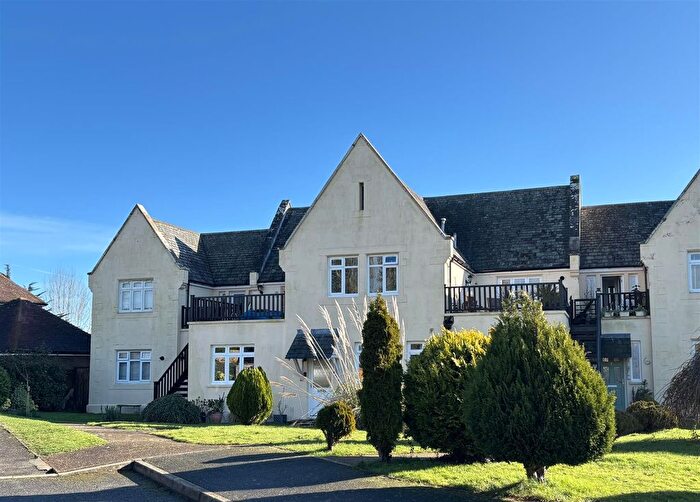
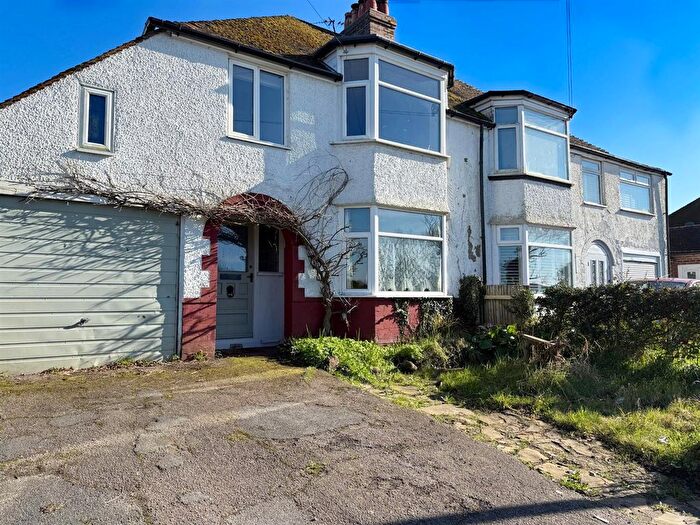
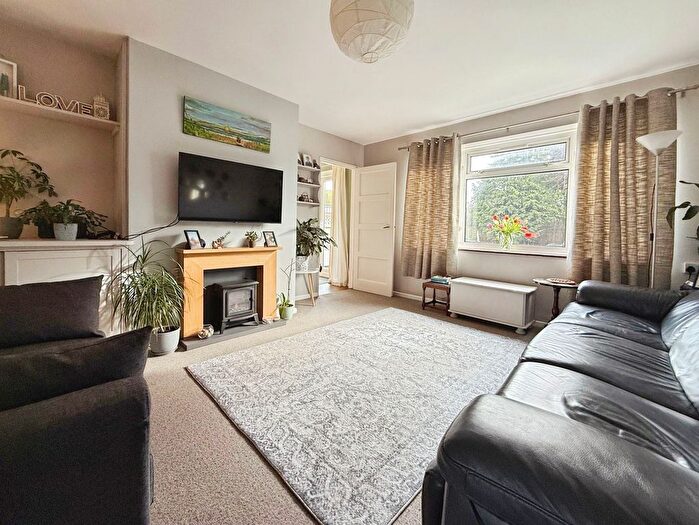
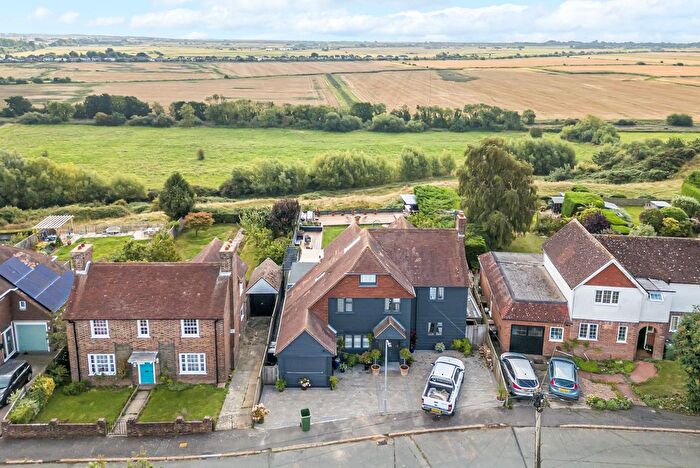
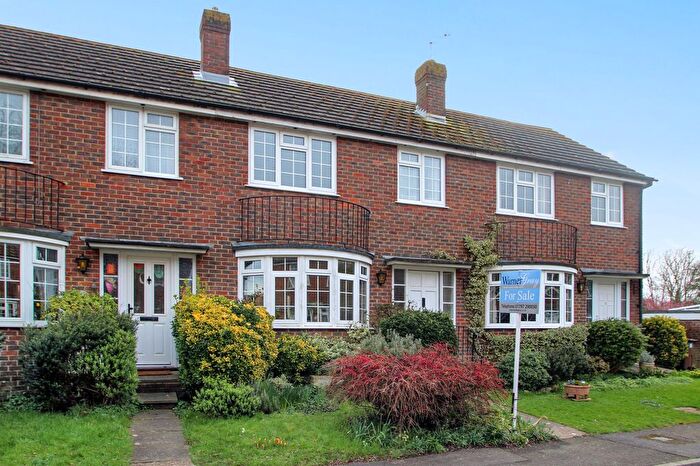
Properties for sale in Rye
![]()
If you are looking to sell your house, let it out, or receive a property valuation, an expert can help you.
Click the button below to get started.
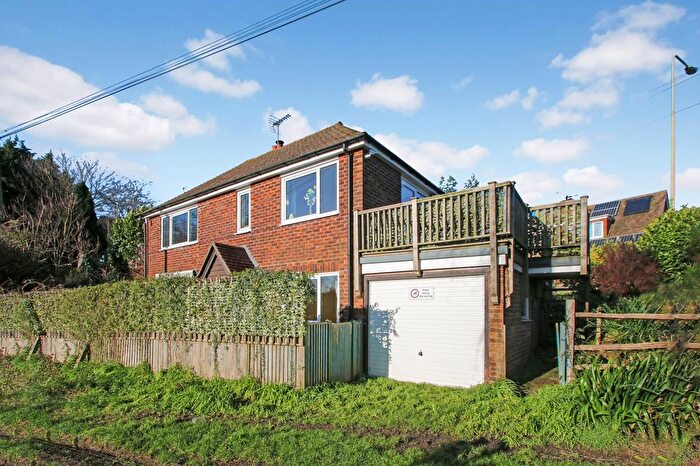
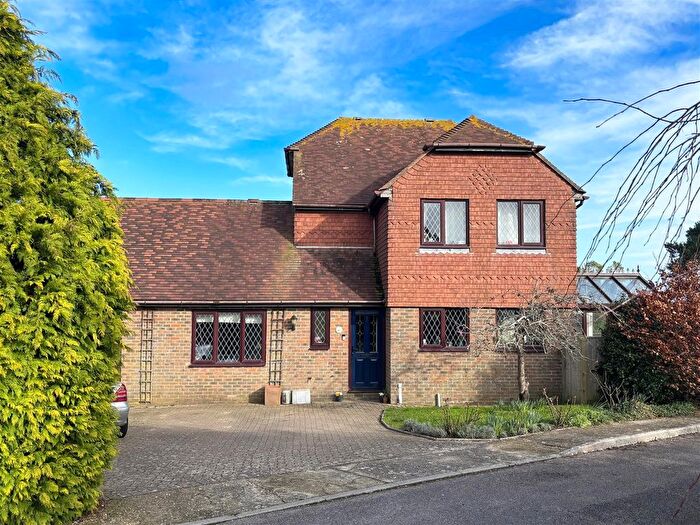

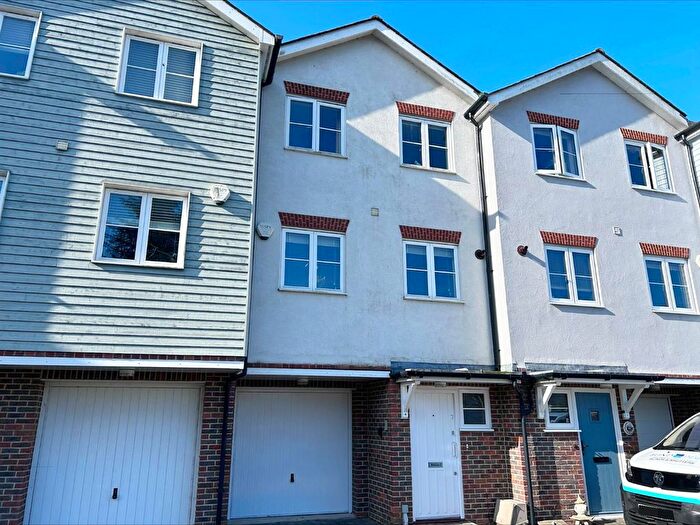
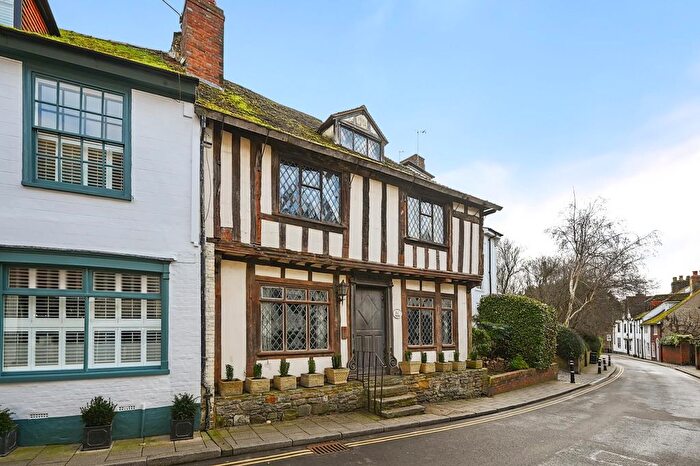
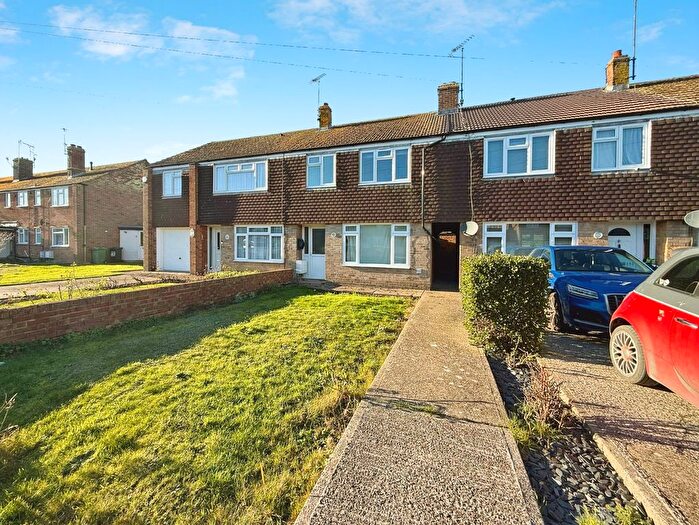
Previously listed properties in Rye

![]()
If you are looking to sell your house, let it out, or receive a property valuation, an expert can help you.
Click the button below to get started.
Roads and Postcodes in Rye
Navigate through our locations to find the location of your next house in Rye, Rye for sale or to rent.
| Streets | Postcodes |
|---|---|
| Ashenden Avenue | TN31 7DU |
| Bankside | TN31 7BJ |
| Benson Way | TN31 7FJ |
| Bridge Place | TN31 7LN |
| Burnhams | TN31 7LW |
| Burra Way | TN31 7FN |
| Cadborough Cliff | TN31 7EB |
| Church Square | TN31 7HE TN31 7HF |
| Cinque Ports Street | TN31 7AD TN31 7AN |
| Conduit Hill | TN31 7LE |
| Cooper Road | TN31 7BG TN31 7BQ |
| Cyprus Place | TN31 7DR |
| Deadmans Lane | TN31 7XL |
| Eagle Road | TN31 7NB |
| East Street | TN31 7JY |
| Fair Meadow | TN31 7NL |
| Ferring Close | TN31 7BY |
| Ferry Road | TN31 7DJ TN31 7DN |
| Fishmarket Road | TN31 7LP TN31 7LR |
| Forge Mews | TN31 7DD |
| Gungarden | TN31 7HH |
| Henley Close | TN31 7BX |
| High Street | TN31 7JE TN31 7JF TN31 7JG TN31 7JN |
| Hucksteps Row | TN31 7HG |
| Hylands Yard | TN31 7EP |
| Jarretts Close | TN31 7PZ |
| Jeake Drive | TN31 7FH |
| Kings Avenue | TN31 7LU TN31 7LX |
| Landgate | TN31 7LH |
| Landgate Square | TN31 7LL |
| Lea Avenue | TN31 7BH |
| Lion Street | TN31 7LB |
| Love Lane | TN31 7NE |
| Market Road | TN31 7JA |
| Market Street | TN31 7LA |
| Marley Road | TN31 7BD |
| Mason Road | TN31 7BE |
| Mermaid Passage | TN31 7ER |
| Mermaid Street | TN31 7ET TN31 7EU |
| Meryon Court | TN31 7LY |
| Military Road | TN31 7NX TN31 7NY TN31 7NZ |
| Mill Road | TN31 7NN |
| New Road | TN31 7LS TN31 7LT |
| New Winchelsea Road | TN31 7TA TN31 7TB TN31 7UG |
| North Salts | TN31 7NU |
| Nutley Close | TN31 7BZ |
| Oast House Drive | TN31 6BP |
| Old Brickyard | TN31 7EE |
| Peacocke Way | TN31 7FD |
| Point Hill | TN31 7NP |
| Pottery Court | TN31 7DF |
| Pottingfield Road | TN31 7BL TN31 7BN TN31 7BP TN31 7BW |
| Regent Square | TN31 7AW |
| Rock Channel | TN31 7HJ |
| Rock Channel Quay | TN31 7DL TN31 7DQ |
| Rope Walk | TN31 7NA |
| Rye Harbour Road | TN31 7TD |
| Rye Hill | TN31 7NH |
| Seaview Terrace | TN31 7JZ |
| Shipyard Lane | TN31 7HL |
| South Undercliff | TN31 7HN TN31 7HW |
| Springfield Drive | TN31 7FL |
| St Margarets Terrace | TN31 7DE |
| Strand Quay | TN31 7AY |
| The Close | TN31 7BS |
| The Grove | TN31 7ND |
| The Link | TN31 7BT |
| The Mint | TN31 7EN TN31 7EW |
| The Strand | TN31 7DB |
| Tillingham Avenue | TN31 7BA |
| Tower Forge Cottages | TN31 7LD |
| Tower Street | TN31 7AT |
| Traders Passage | TN31 7EX |
| Udimore Road | TN31 6AA TN31 7DS TN31 7DY TN31 7DZ TN31 7EA |
| Watchbell Lane | TN31 7HQ |
| Watchbell Street | TN31 7HA TN31 7HB |
| West Street | TN31 7ES |
| West Undercliff | TN31 7DX |
| Western Barn Close | TN31 7EF |
| Winchelsea Road | TN31 7EJ TN31 7EL |
| Wish Street | TN31 7DA |
| Wish Ward | TN31 7DH |
Transport near Rye
-
 Rye Station
 -
Winchelsea Station
-
Doleham Station
-
Three Oaks Station
-
Appledore Station
-
Ore Station
-
Hastings Station
-
Ham Street Station
-
St.Leonards Warrior Square Station
- FAQ
- Price Paid By Year
- Property Type Price
Frequently asked questions about Rye
What is the average price for a property for sale in Rye?
The average price for a property for sale in Rye is £441,470. This amount is 6% lower than the average price in Rye. There are 319 property listings for sale in Rye.
What streets have the most expensive properties for sale in Rye?
The streets with the most expensive properties for sale in Rye are Rye Hill at an average of £3,737,000, Watchbell Street at an average of £877,500 and West Street at an average of £793,333.
What streets have the most affordable properties for sale in Rye?
The streets with the most affordable properties for sale in Rye are The Link at an average of £172,000, Strand Quay at an average of £199,016 and Winchelsea Road at an average of £218,869.
Which train stations are available in or near Rye?
Some of the train stations available in or near Rye are Rye, Winchelsea and Doleham.
Property Price Paid in Rye by Year
The average sold property price by year was:
| Year | Average Sold Price | Price Change |
Sold Properties
|
|---|---|---|---|
| 2025 | £467,375 | 1% |
63 Properties |
| 2024 | £462,226 | 12% |
83 Properties |
| 2023 | £407,582 | -5% |
99 Properties |
| 2022 | £429,726 | 12% |
100 Properties |
| 2021 | £378,446 | 6% |
112 Properties |
| 2020 | £356,578 | 5% |
94 Properties |
| 2019 | £337,659 | 6% |
78 Properties |
| 2018 | £317,176 | 1% |
86 Properties |
| 2017 | £315,180 | 11% |
125 Properties |
| 2016 | £281,030 | 5% |
138 Properties |
| 2015 | £267,843 | -1% |
119 Properties |
| 2014 | £270,598 | 9% |
117 Properties |
| 2013 | £247,530 | -2% |
103 Properties |
| 2012 | £251,842 | 1% |
84 Properties |
| 2011 | £248,742 | 9% |
80 Properties |
| 2010 | £226,533 | 4% |
93 Properties |
| 2009 | £217,349 | -7% |
62 Properties |
| 2008 | £233,536 | 1% |
80 Properties |
| 2007 | £231,838 | 7% |
142 Properties |
| 2006 | £216,133 | 6% |
122 Properties |
| 2005 | £202,329 | 1% |
123 Properties |
| 2004 | £200,449 | 10% |
114 Properties |
| 2003 | £180,736 | 15% |
128 Properties |
| 2002 | £152,761 | 22% |
124 Properties |
| 2001 | £118,860 | -4% |
115 Properties |
| 2000 | £124,053 | 30% |
117 Properties |
| 1999 | £86,537 | -1% |
143 Properties |
| 1998 | £87,157 | 5% |
99 Properties |
| 1997 | £83,109 | 19% |
128 Properties |
| 1996 | £67,098 | 12% |
128 Properties |
| 1995 | £58,947 | - |
99 Properties |
Property Price per Property Type in Rye
Here you can find historic sold price data in order to help with your property search.
The average Property Paid Price for specific property types in the last three years are:
| Property Type | Average Sold Price | Sold Properties |
|---|---|---|
| Semi Detached House | £410,263.00 | 54 Semi Detached Houses |
| Detached House | £752,351.00 | 37 Detached Houses |
| Terraced House | £453,790.00 | 100 Terraced Houses |
| Flat | £236,849.00 | 54 Flats |