
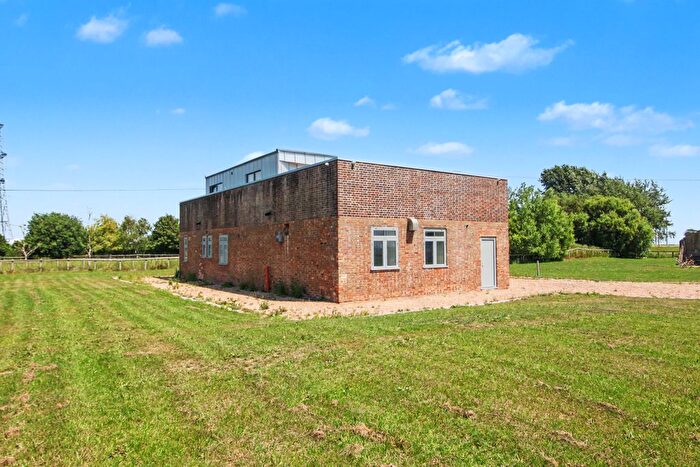
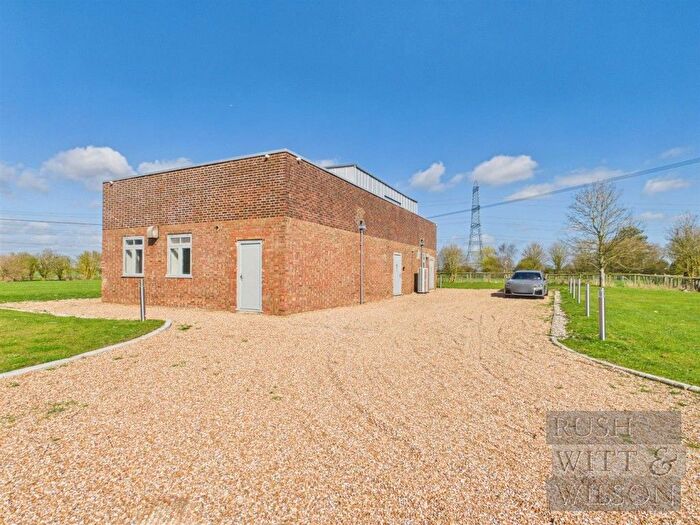
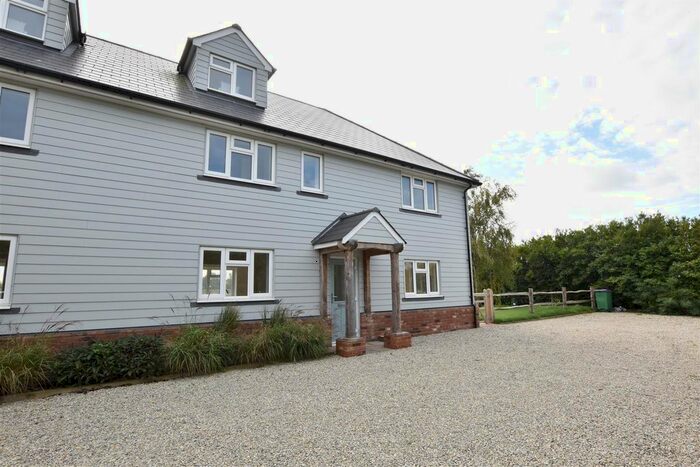
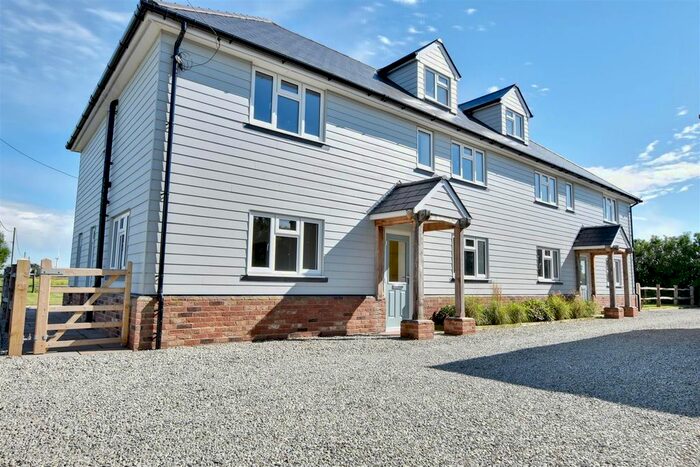
Houses for sale in Romney Marsh, Rye
House Prices in Romney Marsh
Properties in Romney Marsh have an average house price of £400k and had 1 Property Transaction within the last 3 years¹.
Romney Marsh is an area in Rye, Kent with 6 households², where the most expensive property was sold for £400k.
Previously listed properties in Romney Marsh
Roads and Postcodes in Romney Marsh
Navigate through our locations to find the location of your next house in Romney Marsh, Rye for sale or to rent.
Property price trends in Romney Marsh
According to the latest Land Registry data, the average home in Romney Marsh sold for £400,000 in 2023. That figure comes from 12 sales logged over the past 28 years.
Looking back five years, average prices are up about 40.4% since 2018, a gain of around £115,000 in cash terms.
Zoom out to the past decade for the fuller picture. Back in 2013, homes here averaged £180,000, so the typical sold price has climbed about 122.2% since then, roughly 8.3% a year. Stretch the view to fifteen years and that annual pace eases back to about 6.8%.
Frequently asked questions about Romney Marsh
What is the average price for a property for sale in Romney Marsh?
The average price for a property for sale in Romney Marsh is £400,000. This amount is 12% lower than the average price in Rye. There are 4 property listings for sale in Romney Marsh.
Which train stations are available in or near Romney Marsh?
Some of the train stations available in or near Romney Marsh are Rye, Appledore and Winchelsea.
Property Price Paid in Romney Marsh by Year
The average sold property price by year was:
| Year | Average Sold Price | Price Change |
Sold Properties
|
|---|---|---|---|
| 2023 | £400,000 | 29% |
1 Property |
| 2018 | £285,000 | -62% |
1 Property |
| 2017 | £462,500 | 61% |
2 Properties |
| 2013 | £180,000 | -33% |
1 Property |
| 2010 | £239,997 | 23% |
2 Properties |
| 2009 | £184,995 | 19% |
1 Property |
| 2008 | £150,000 | 2% |
1 Property |
| 2003 | £147,000 | 8% |
1 Property |
| 2001 | £135,000 | 70% |
1 Property |
| 1995 | £40,000 | - |
1 Property |
Property Price per Property Type in Romney Marsh
Here you can find historic sold price data in order to help with your property search.
The average Property Paid Price for specific property types in the last three years are:
| Property Type | Average Sold Price | Sold Properties |
|---|---|---|
| Semi Detached House | £400,000.00 | 1 Semi Detached House |
