
Houses for sale & to rent in Enfield, Enfield London Borough
House Prices in Enfield
Properties in this part of Enfield within the Enfield London Borough have an average house price of £461k and had 3,784 Property Transactions within the last 3 years.¹ This area has 51,374 households² , where the most expensive property was sold for £7.51M.
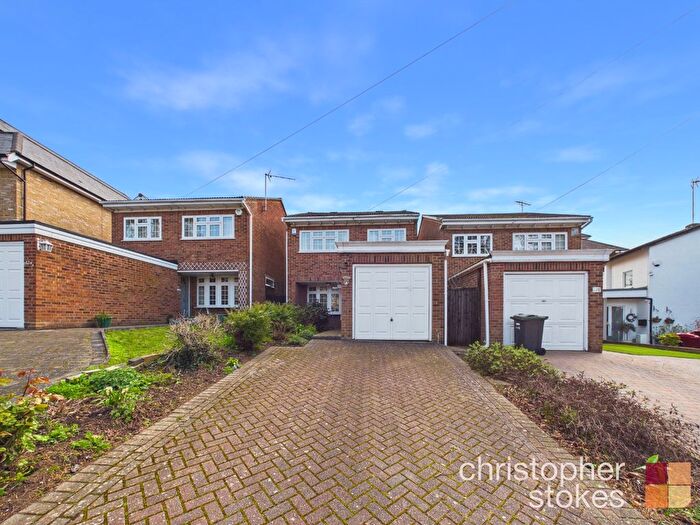
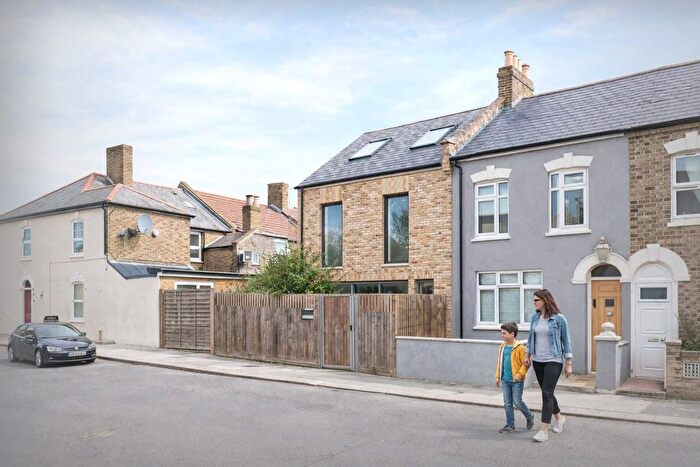
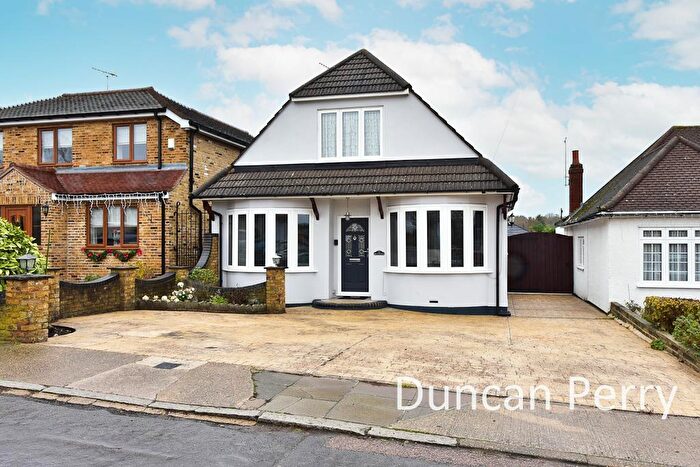
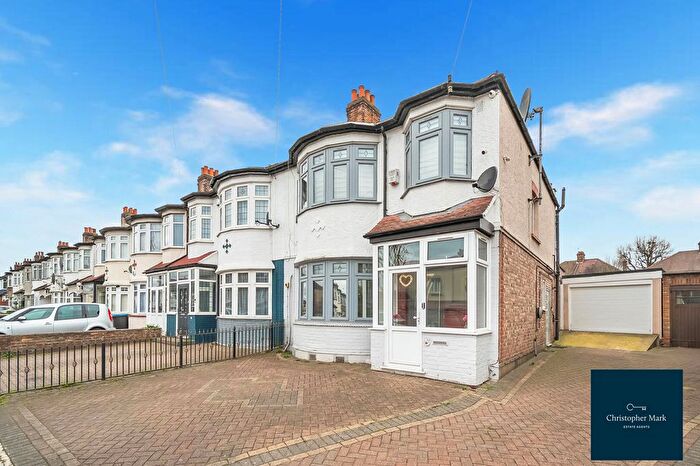
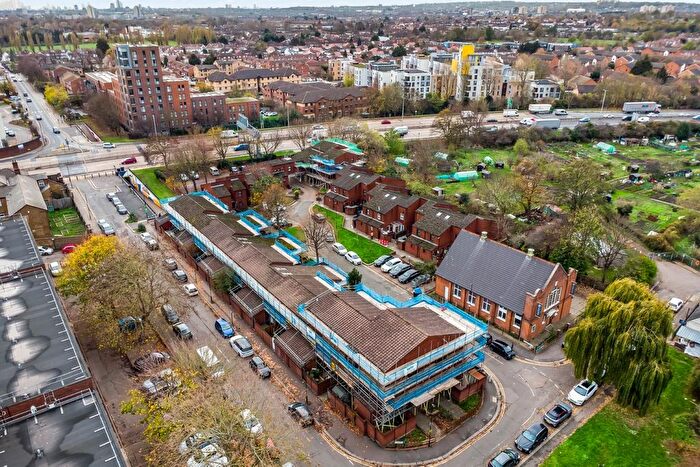
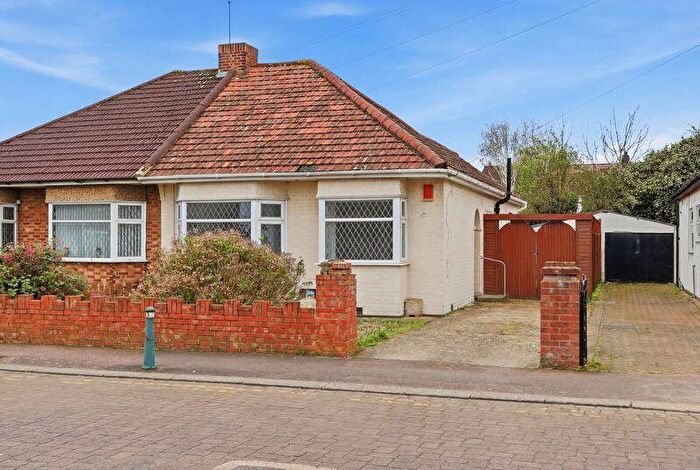
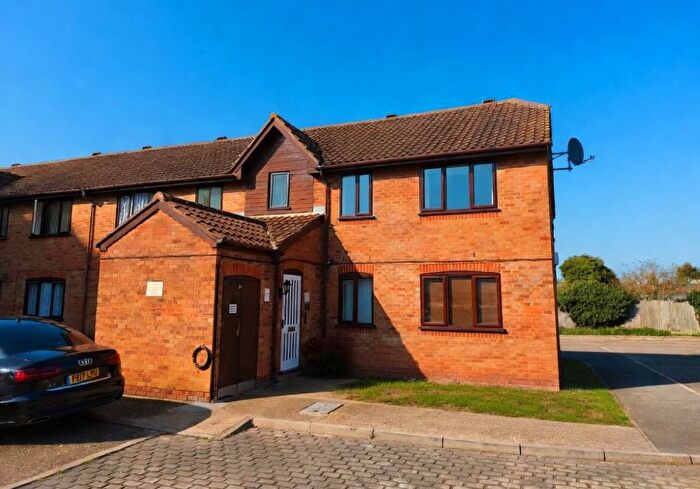
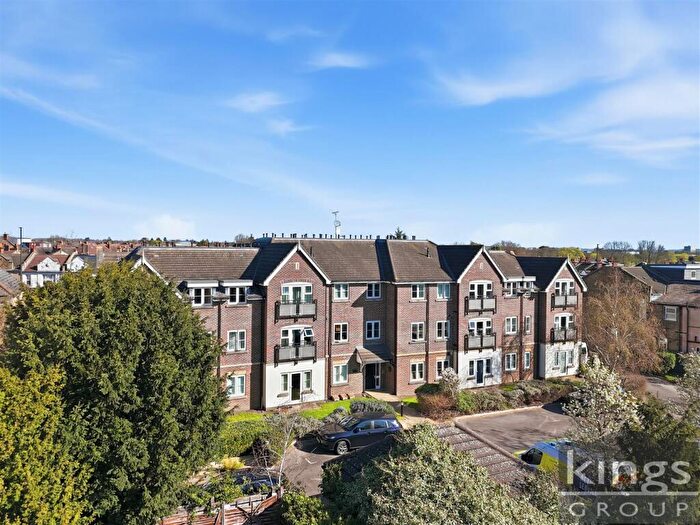
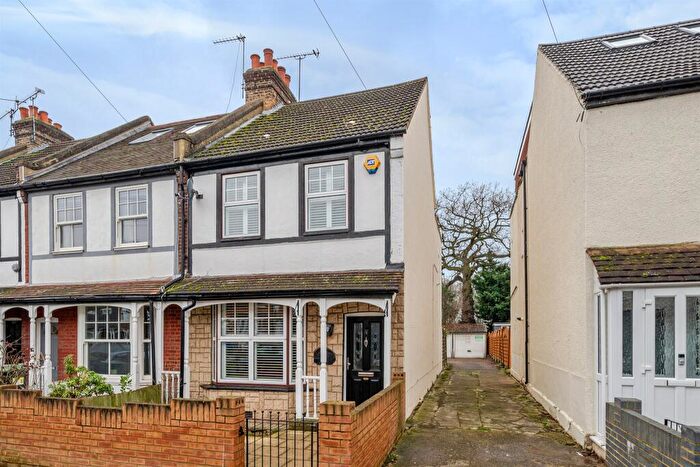
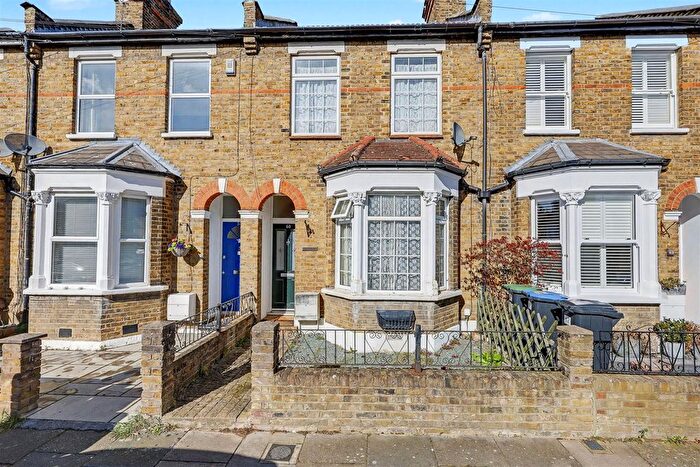
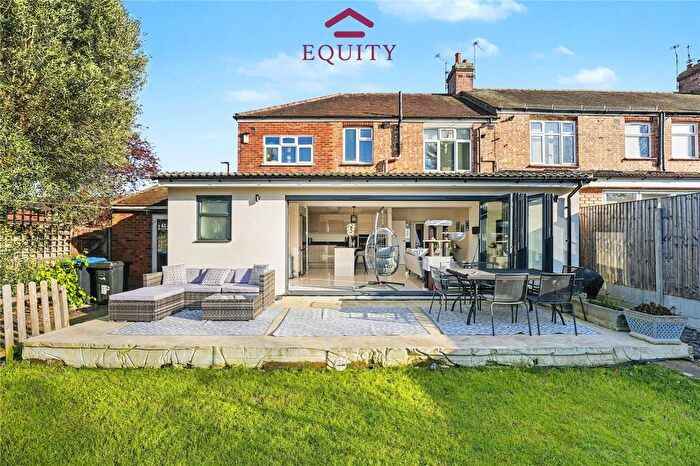
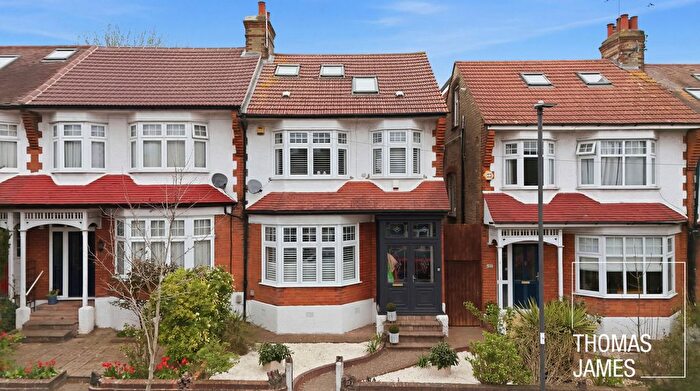
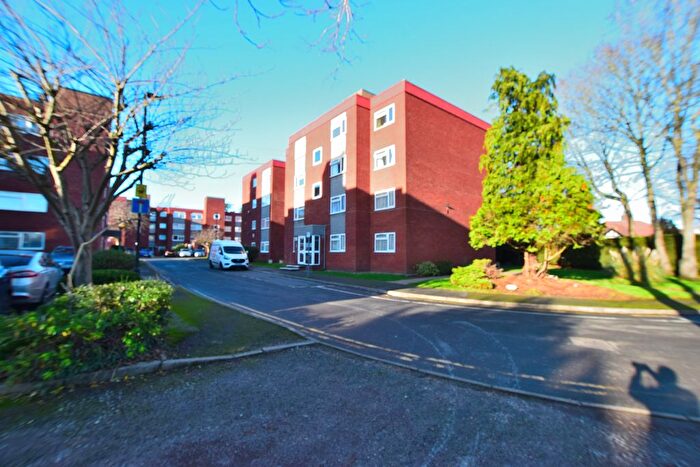
Properties for sale in Enfield
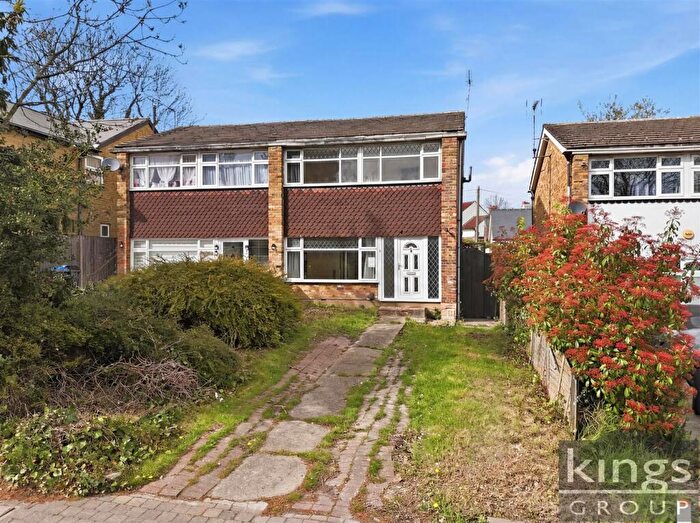
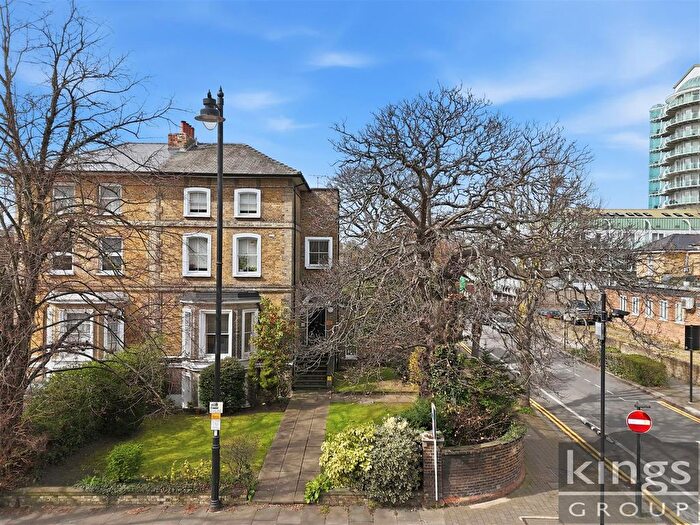
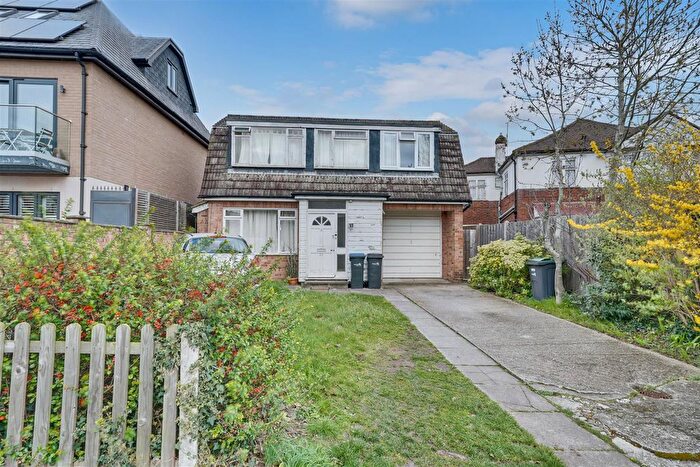
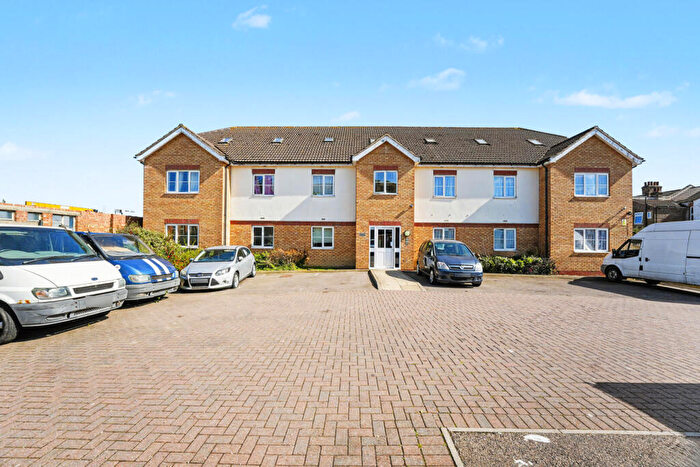
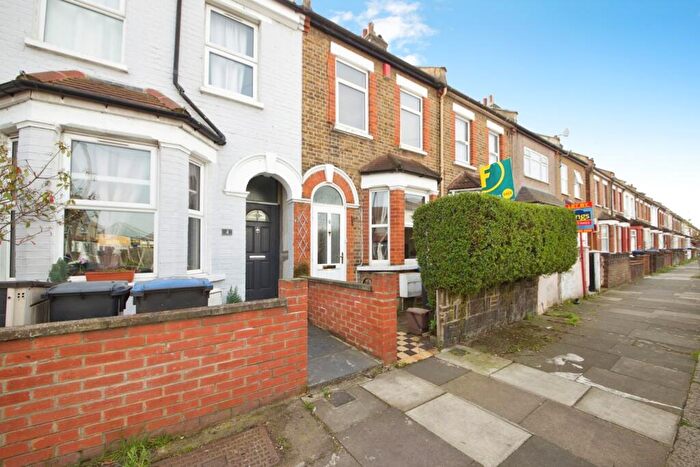
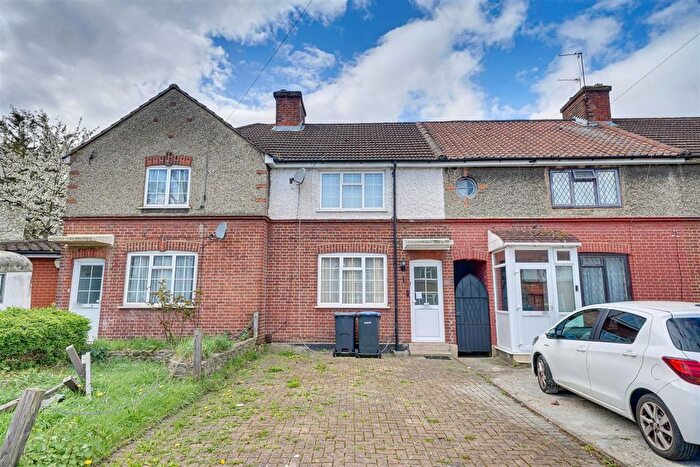
![]()
If you are looking to sell your house, let it out, or receive a property valuation, an expert can help you.
Click the button below to get started.


Neighbourhoods in Enfield
Navigate through our locations to find the location of your next house in Enfield, Enfield London Borough for sale or to rent.
Transport in Enfield
Please see below transportation links in this area:
-

 Enfield Town Station
 -
Southbury Station
-
Bush Hill Park Station
-
Enfield Chase Station
-
Turkey Street Station
-
Gordon Hill Station
-
Brimsdown Station
-
Ponders End Station
-
Grange Park Station
-
Enfield Lock Station
- FAQ
- Price Paid By Year
- Property Type Price
Frequently asked questions about Enfield
What is the average price for a property for sale in Enfield?
The average price for a property for sale in Enfield is £461,378. This amount is 11% lower than the average price in Enfield London Borough. There are more than 10,000 property listings for sale in Enfield.
What locations have the most expensive properties for sale in Enfield?
The locations with the most expensive properties for sale in Enfield are Cockfosters at an average of £865,083, Highlands at an average of £595,258 and Bush Hill Park at an average of £540,869.
What locations have the most affordable properties for sale in Enfield?
The locations with the most affordable properties for sale in Enfield are Enfield Lock at an average of £360,510, Ponders End at an average of £373,934 and Enfield Highway at an average of £387,386.
Which train stations are available in or near Enfield?
Some of the train stations available in or near Enfield are Enfield Town, Southbury and Bush Hill Park.
Property Price Paid in Enfield by Year
The average sold property price by year was:
| Year | Average Sold Price | Price Change |
Sold Properties
|
|---|---|---|---|
| 2026 | £494,238 | 6% |
21 Properties |
| 2025 | £466,530 | 1% |
1,227 Properties |
| 2024 | £461,989 | 2% |
1,336 Properties |
| 2023 | £454,854 | 2% |
1,200 Properties |
| 2022 | £447,854 | 2% |
1,597 Properties |
| 2021 | £438,039 | 4% |
2,105 Properties |
| 2020 | £418,341 | 3% |
1,272 Properties |
| 2019 | £404,743 | 1% |
1,534 Properties |
| 2018 | £400,258 | 1% |
1,394 Properties |
| 2017 | £395,467 | 4% |
1,484 Properties |
| 2016 | £380,051 | 11% |
1,788 Properties |
| 2015 | £338,058 | 13% |
1,983 Properties |
| 2014 | £295,225 | 8% |
2,044 Properties |
| 2013 | £272,895 | 7% |
1,654 Properties |
| 2012 | £254,738 | 0,2% |
1,308 Properties |
| 2011 | £254,319 | -0,5% |
1,290 Properties |
| 2010 | £255,555 | 9% |
1,349 Properties |
| 2009 | £233,059 | -3% |
1,156 Properties |
| 2008 | £239,409 | -1% |
1,517 Properties |
| 2007 | £242,111 | 9% |
3,139 Properties |
| 2006 | £220,280 | 5% |
3,142 Properties |
| 2005 | £208,324 | 2% |
2,404 Properties |
| 2004 | £204,278 | 6% |
2,890 Properties |
| 2003 | £192,413 | 15% |
2,981 Properties |
| 2002 | £164,041 | 14% |
3,512 Properties |
| 2001 | £141,525 | 14% |
3,425 Properties |
| 2000 | £121,222 | 16% |
2,808 Properties |
| 1999 | £101,959 | 9% |
2,960 Properties |
| 1998 | £93,242 | 11% |
2,748 Properties |
| 1997 | £83,205 | 10% |
2,740 Properties |
| 1996 | £75,068 | 7% |
2,505 Properties |
| 1995 | £70,138 | - |
2,171 Properties |
Property Price per Property Type in Enfield
Here you can find historic sold price data in order to help with your property search.
The average Property Paid Price for specific property types in the last three years are:
| Property Type | Average Sold Price | Sold Properties |
|---|---|---|
| Semi Detached House | £592,187.00 | 747 Semi Detached Houses |
| Terraced House | £480,213.00 | 1,674 Terraced Houses |
| Detached House | £863,045.00 | 171 Detached Houses |
| Flat | £295,330.00 | 1,192 Flats |