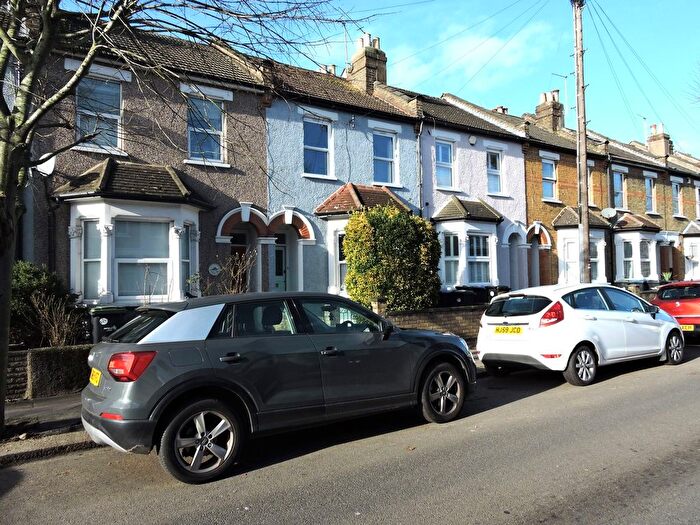
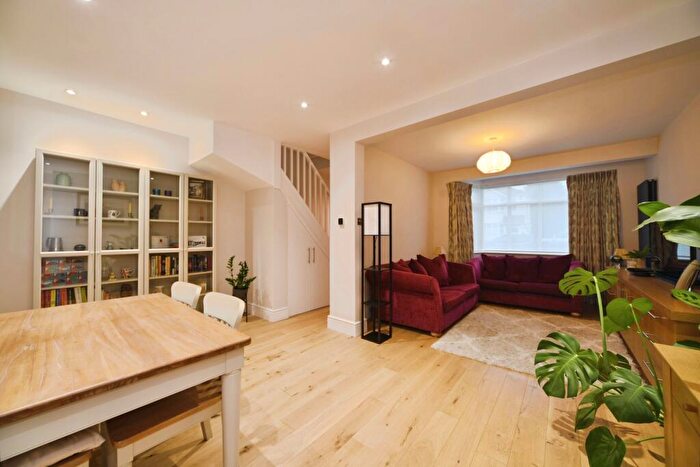
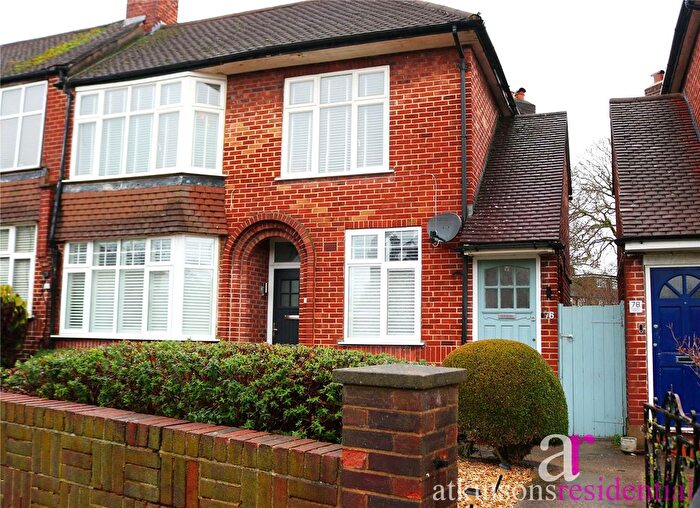
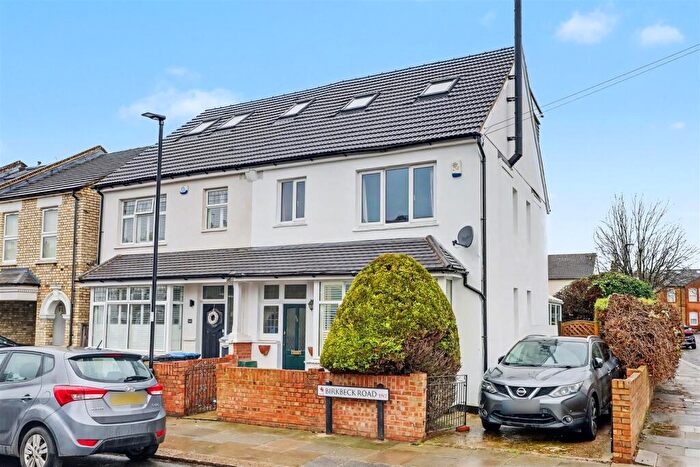
Houses for sale & to rent in Town, Enfield
House Prices in Town
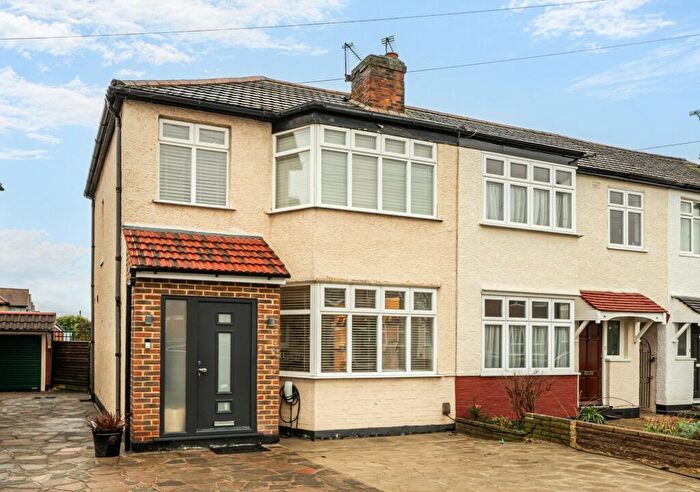
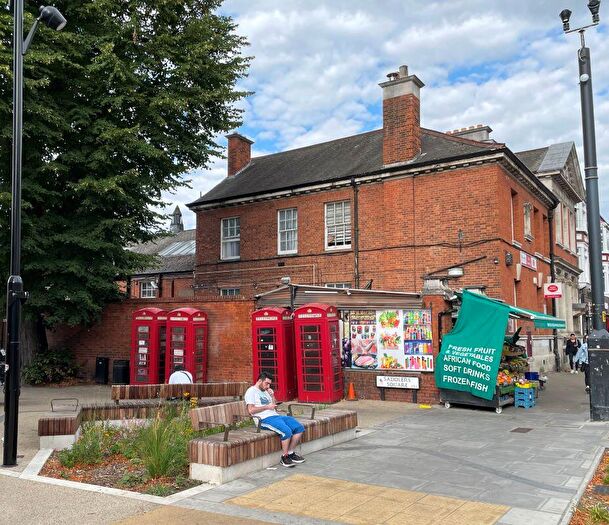
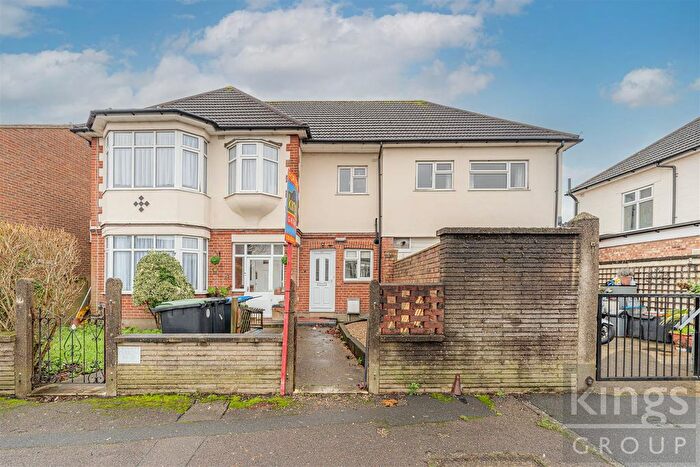
Properties in this part of Town within Enfield have an average house price of £515,949.00 and had 501 Property Transactions within the last 3 years¹. This area has 6,056 households² , where the most expensive property was sold for £7,510,000.00.
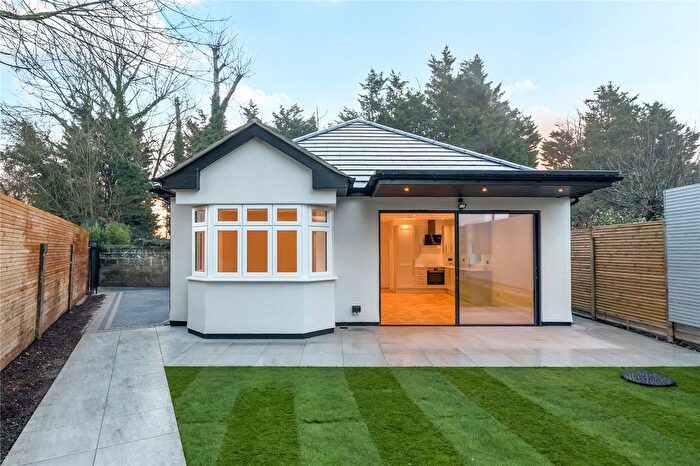
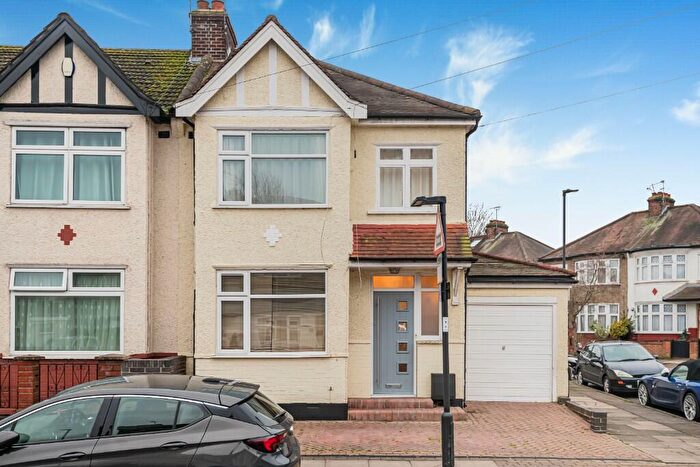
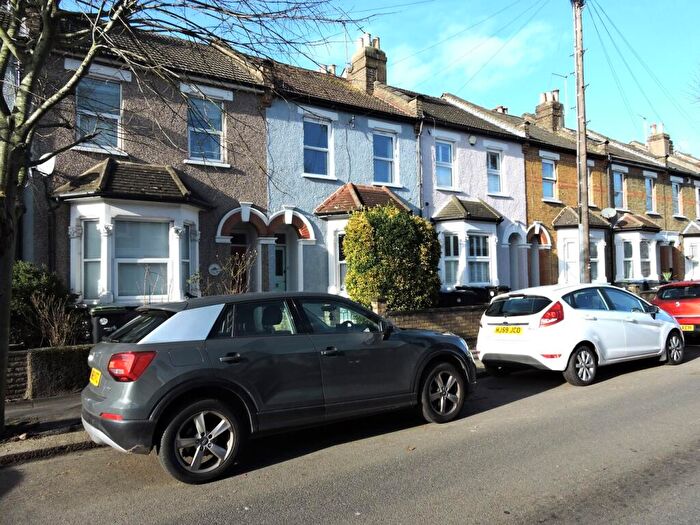
Properties for sale in Town
Roads and Postcodes in Town
Navigate through our locations to find the location of your next house in Town, Enfield for sale or to rent.
Transport near Town
-
Enfield Town Station
-
Enfield Chase Station
-
Gordon Hill Station
-
Bush Hill Park Station
-
Southbury Station
-
Grange Park Station
-
Turkey Street Station
-
Winchmore Hill Station
-
Brimsdown Station
-
Crews Hill Station
- FAQ
- Price Paid By Year
- Property Type Price
Frequently asked questions about Town
What is the average price for a property for sale in Town?
The average price for a property for sale in Town is £515,949. This amount is 12% higher than the average price in Enfield. There are 2,776 property listings for sale in Town.
What streets have the most expensive properties for sale in Town?
The streets with the most expensive properties for sale in Town are Chapel Street at an average of £760,000, Gentlemans Row at an average of £743,900 and Chase Side at an average of £732,655.
What streets have the most affordable properties for sale in Town?
The streets with the most affordable properties for sale in Town are Hallside Road at an average of £255,000, Priors Mead at an average of £302,500 and Gater Drive at an average of £305,000.
Which train stations are available in or near Town?
Some of the train stations available in or near Town are Enfield Town, Enfield Chase and Gordon Hill.
Property Price Paid in Town by Year
The average sold property price by year was:
| Year | Average Sold Price | Price Change |
Sold Properties
|
|---|---|---|---|
| 2025 | £508,845 | 0,3% |
147 Properties |
| 2024 | £507,487 | -5% |
185 Properties |
| 2023 | £531,392 | 7% |
169 Properties |
| 2022 | £492,122 | 4% |
239 Properties |
| 2021 | £473,293 | 1% |
292 Properties |
| 2020 | £468,601 | 3% |
188 Properties |
| 2019 | £456,806 | 3% |
194 Properties |
| 2018 | £444,472 | -0,3% |
156 Properties |
| 2017 | £445,945 | 1% |
199 Properties |
| 2016 | £440,285 | 13% |
224 Properties |
| 2015 | £383,855 | 12% |
274 Properties |
| 2014 | £336,549 | 11% |
247 Properties |
| 2013 | £300,311 | 9% |
238 Properties |
| 2012 | £272,398 | -0,1% |
167 Properties |
| 2011 | £272,790 | -5% |
190 Properties |
| 2010 | £286,447 | 12% |
207 Properties |
| 2009 | £252,814 | -3% |
159 Properties |
| 2008 | £260,393 | -6% |
163 Properties |
| 2007 | £276,906 | 12% |
349 Properties |
| 2006 | £244,219 | 6% |
334 Properties |
| 2005 | £229,869 | -0,3% |
278 Properties |
| 2004 | £230,551 | 6% |
347 Properties |
| 2003 | £215,587 | 14% |
336 Properties |
| 2002 | £186,327 | 15% |
428 Properties |
| 2001 | £159,292 | 8% |
417 Properties |
| 2000 | £147,259 | 22% |
273 Properties |
| 1999 | £115,207 | 5% |
343 Properties |
| 1998 | £109,108 | 17% |
339 Properties |
| 1997 | £90,822 | 9% |
390 Properties |
| 1996 | £83,068 | 3% |
318 Properties |
| 1995 | £80,945 | - |
252 Properties |
Property Price per Property Type in Town
Here you can find historic sold price data in order to help with your property search.
The average Property Paid Price for specific property types in the last three years are:
| Property Type | Average Sold Price | Sold Properties |
|---|---|---|
| Semi Detached House | £668,681.00 | 109 Semi Detached Houses |
| Detached House | £738,400.00 | 5 Detached Houses |
| Terraced House | £541,871.00 | 260 Terraced Houses |
| Flat | £323,039.00 | 127 Flats |

