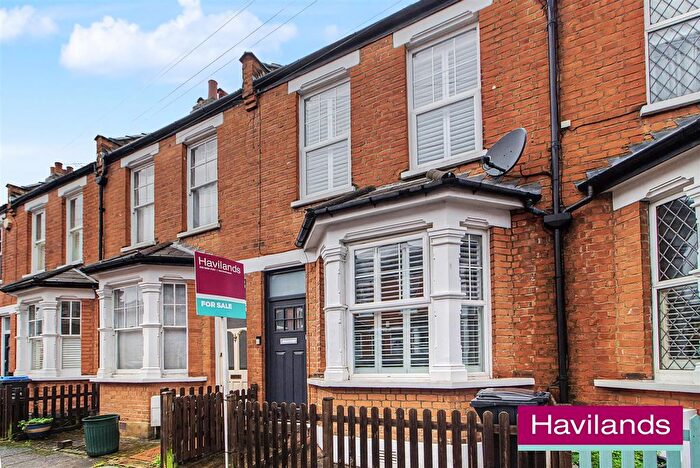
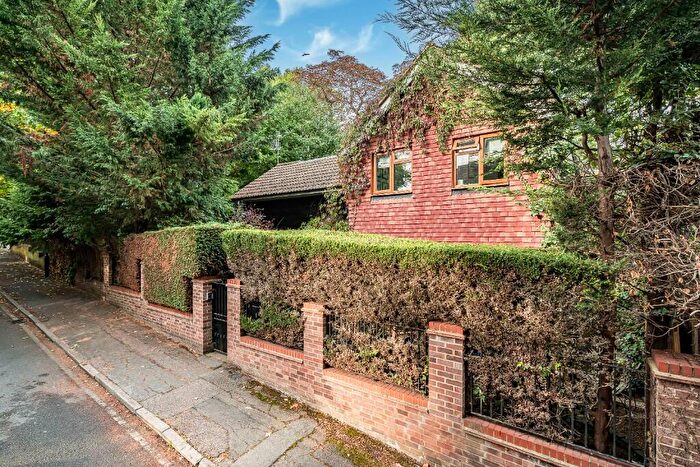
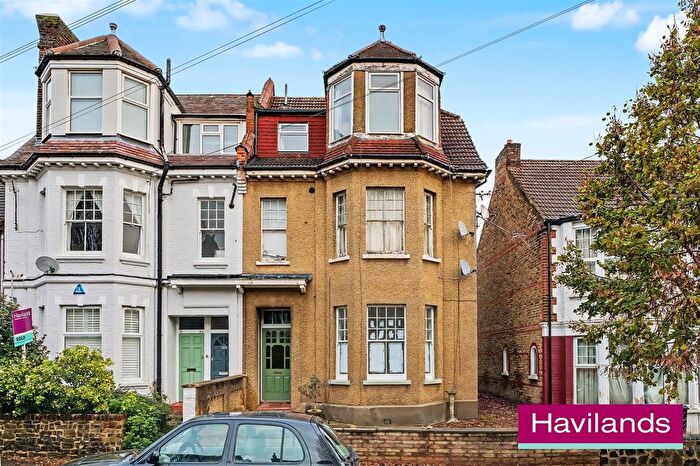
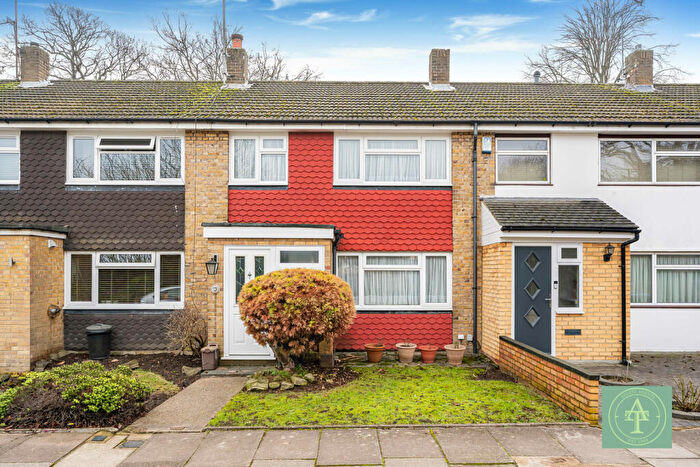
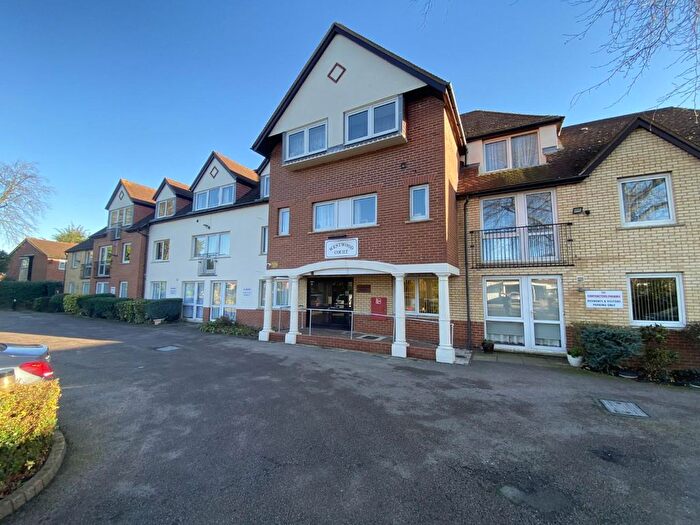
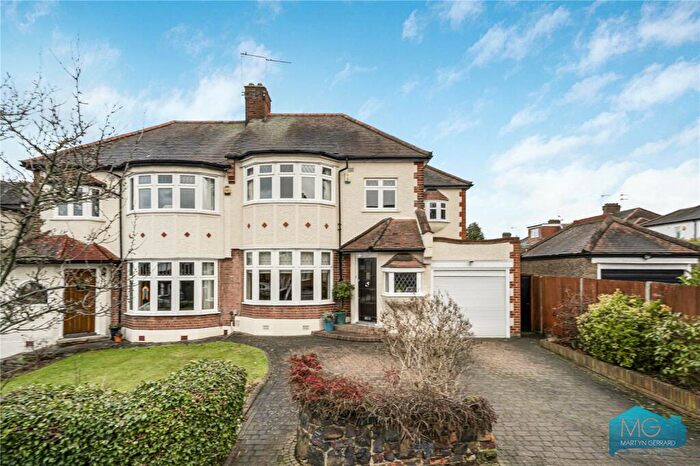
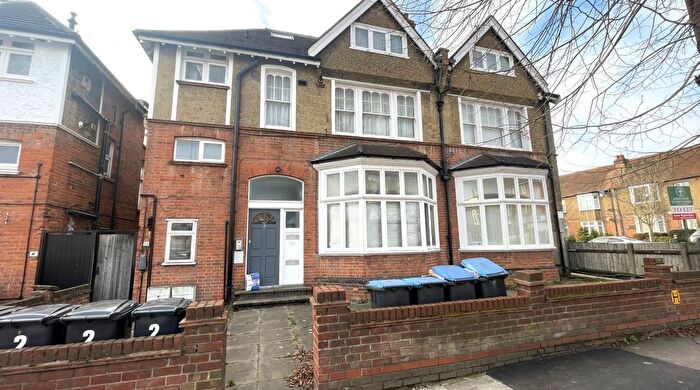
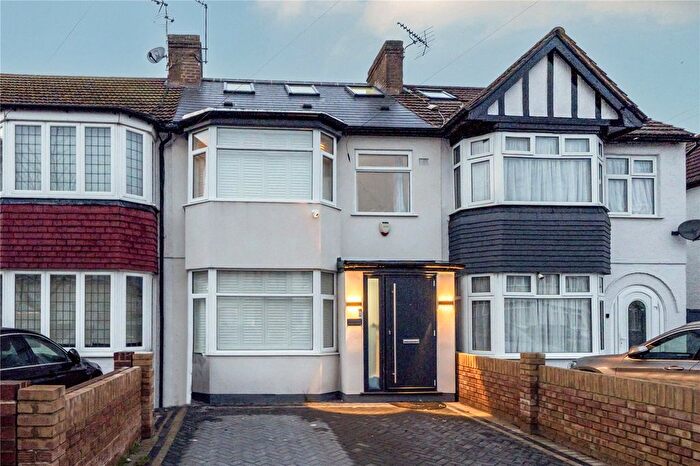
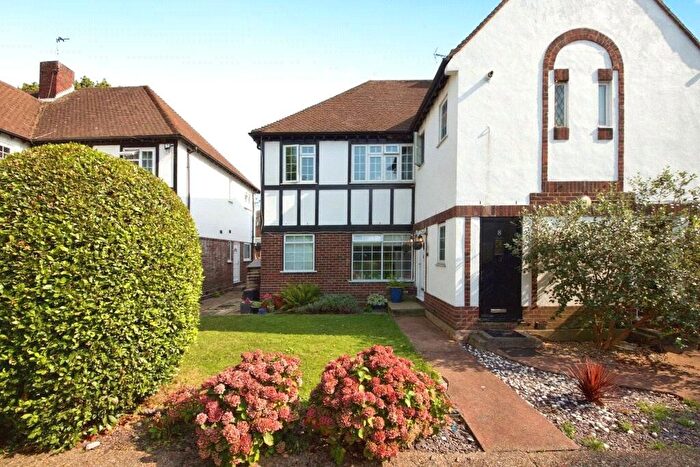
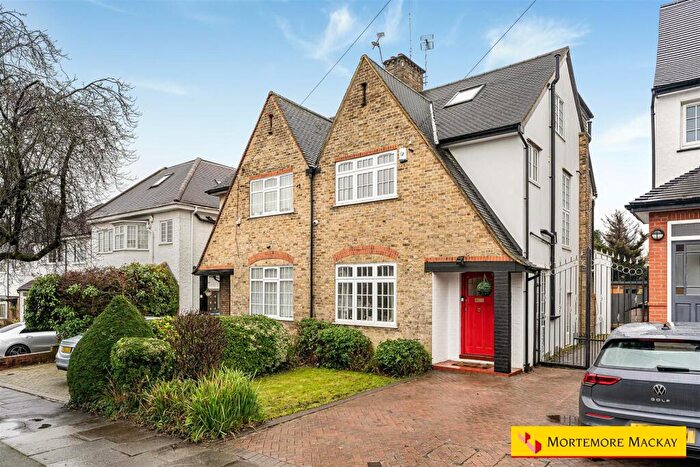
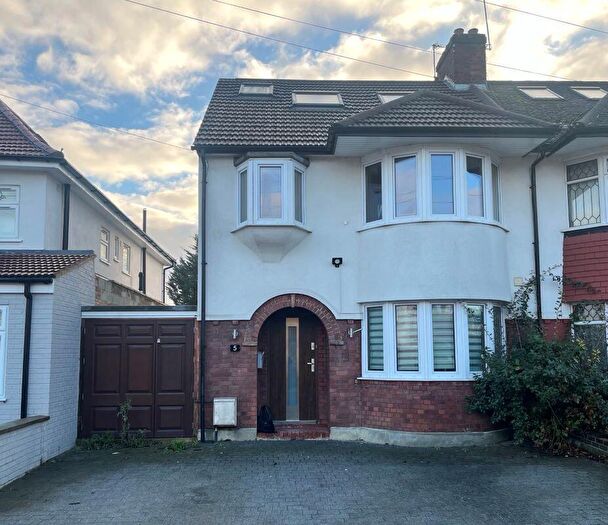
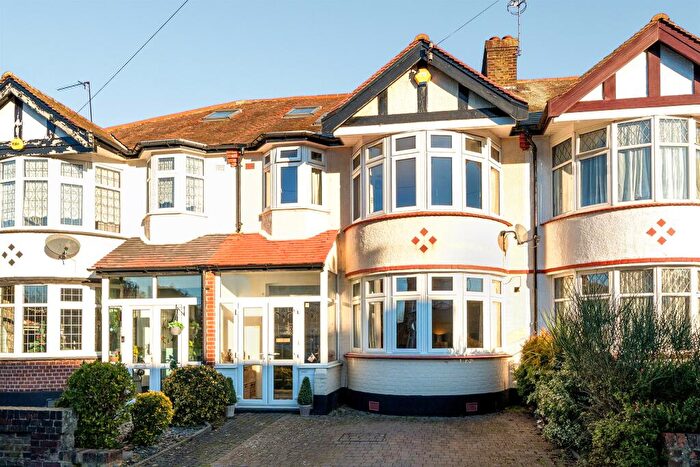
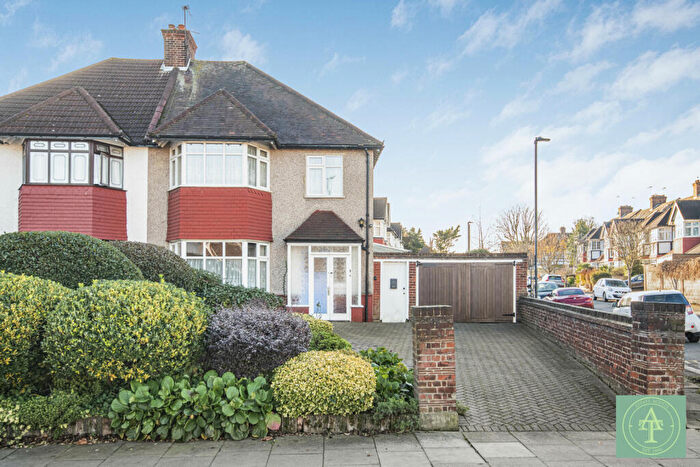
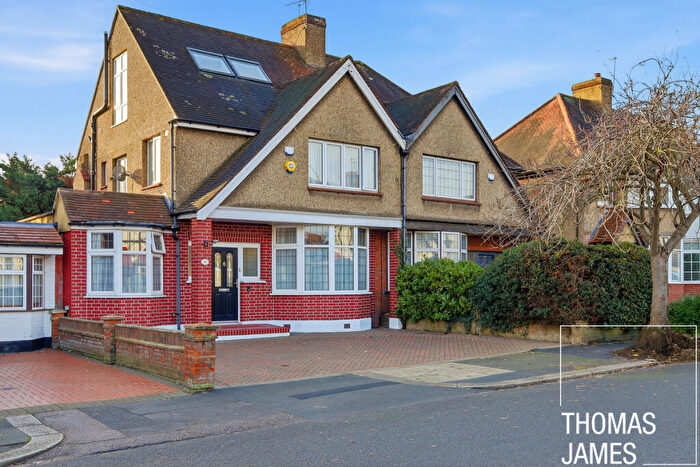
Houses for sale & to rent in Bush Hill Park, London
House Prices in Bush Hill Park
Properties in this part of Bush Hill Park within London have an average house price of £525,074.00 and had 114 Property Transactions within the last 3 years¹. This area has 2,099 households² , where the most expensive property was sold for £1,075,000.00.
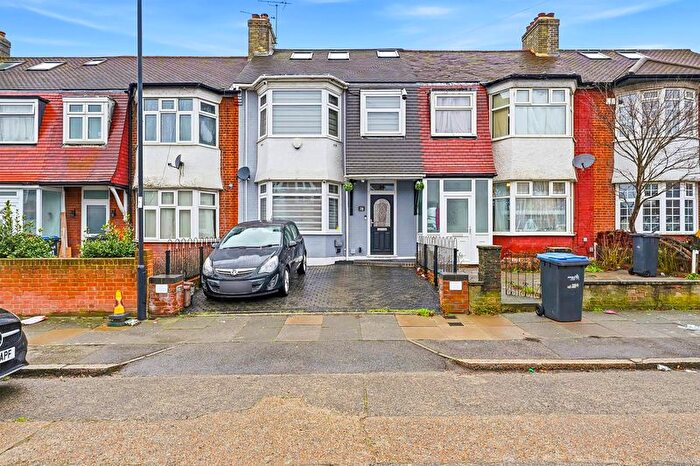
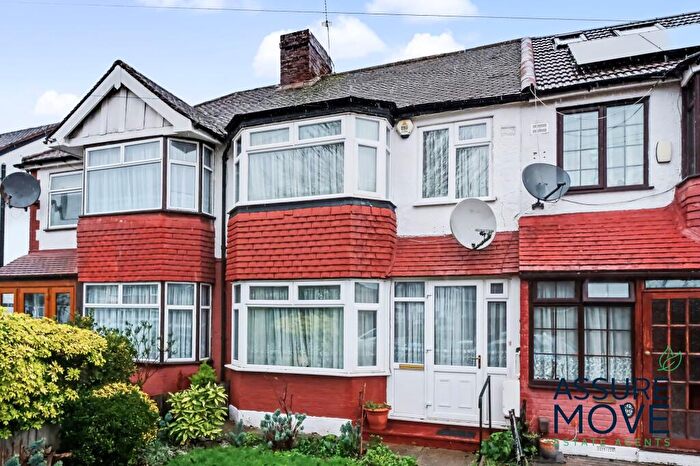
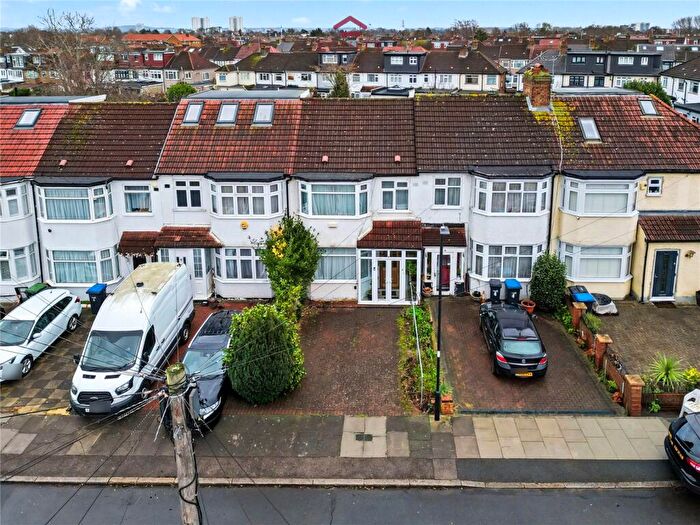
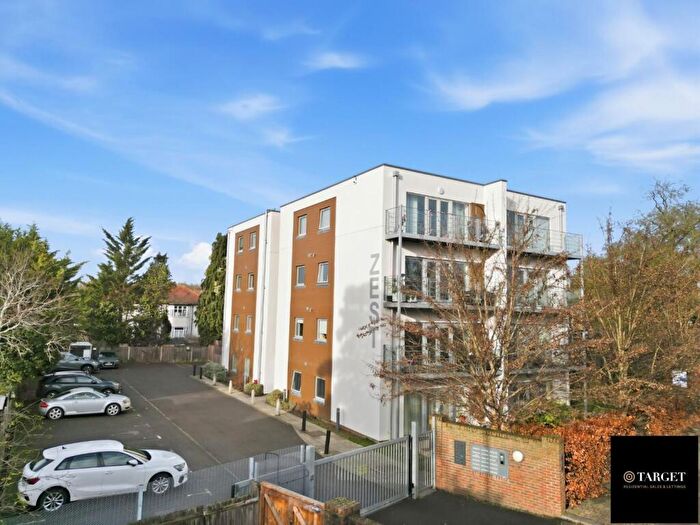
Properties for sale in Bush Hill Park
Roads and Postcodes in Bush Hill Park
Navigate through our locations to find the location of your next house in Bush Hill Park, London for sale or to rent.
| Streets | Postcodes |
|---|---|
| Ainsley Close | N9 9SH N9 9XJ N9 9XL |
| Aldbury Mews | N9 9JD |
| Beaulieu Gardens | N21 2HR |
| Blakesware Gardens | N9 9HU N9 9HX |
| Blenheim Close | N21 2HQ |
| Bridge Gate | N21 2AH |
| Bridge Parade | N21 2AG |
| Bury Street West | N9 9JN N9 9JR N9 9JU N9 9JW N9 9LA N9 9LB N9 9LL |
| Bush Hill Parade | N9 9JS |
| Cambridge Terrace | N9 9JJ |
| Church Street | N9 9FB N9 9HP N9 9HR N9 9HS N9 9HT N9 9HY N9 9HZ N9 9JA |
| Colne Road | N21 2JB N21 2JD N21 2JG N21 2JJ N21 2JN N21 2JP |
| Elm Park Road | N21 2HN N21 2HP N21 2HS |
| Elsiedene Road | N21 2RN N21 2RP |
| Firs Lane | N13 5QJ N21 2HT N21 2HU N21 2HX N21 2PG N21 2PJ N21 3ES N21 3HX N21 3ER |
| Firs Park Avenue | N21 2PR N21 2PT N21 2PU |
| Firs Park Gardens | N21 2PX |
| Great Cambridge Road | N9 9UL N9 9UN |
| Green Lanes | N21 2AE N21 2RR N21 2RS N21 2RT N21 2RW N21 2SA N21 2SJ N21 2AD N21 2BF N21 2SB N21 2SH |
| Griffins Close | N21 2EW |
| Halstead Gardens | N21 3DU N21 3DX |
| Halstead Road | N21 3DR N21 3DS N21 3DT N21 3DY N21 3EG N21 3EH |
| Harlow Road | N13 5QT |
| Hyde Park Avenue | N21 2PL N21 2PP |
| Hyde Park Gardens | N21 2PN |
| Hydefield Close | N21 2PS |
| Kent Road | N21 2JH N21 2JR |
| Kipling Terrace | N9 9UJ |
| Little Bury Street | N9 9JX N9 9JZ |
| Lynford Terrace | N9 9LD |
| Percy Road | N21 2HY N21 2JA |
| Ramscroft Close | N9 9JY |
| Rayleigh Close | N13 5QS |
| Rayleigh Road | N13 5QR N13 5QW N13 5QP |
| Ridge Avenue | N21 2RH N21 2RJ N21 2RL |
| Ridge Road | N21 3EA N21 3EB N21 3EJ N21 3EL N21 3EN N21 3EP |
| River Bank | N21 2AA N21 2AB |
| Rowantree Close | N21 3EE |
| Rowantree Road | N21 3ED |
| Sayersbury Way | N9 9FA |
| Solna Road | N21 2JE N21 2JS |
| The Fairway | N13 5NF N13 5QL |
| Westview Crescent | N9 9JP |
| York Road | N21 2JL |
| N21 3EQ |
Transport near Bush Hill Park
-
Winchmore Hill Station
-
Grange Park Station
-
Bush Hill Park Station
-
Edmonton Green Station
-
Silver Street Station
-
Enfield Town Station
-
Enfield Chase Station
-
Palmers Green Station
-
Southbury Station
-
Southgate Station
- FAQ
- Price Paid By Year
- Property Type Price
Frequently asked questions about Bush Hill Park
What is the average price for a property for sale in Bush Hill Park?
The average price for a property for sale in Bush Hill Park is £525,074. This amount is 1% lower than the average price in London. There are 2,038 property listings for sale in Bush Hill Park.
What streets have the most expensive properties for sale in Bush Hill Park?
The streets with the most expensive properties for sale in Bush Hill Park are Beaulieu Gardens at an average of £1,025,000, York Road at an average of £792,500 and Elsiedene Road at an average of £776,666.
What streets have the most affordable properties for sale in Bush Hill Park?
The streets with the most affordable properties for sale in Bush Hill Park are Ainsley Close at an average of £170,928, Great Cambridge Road at an average of £267,000 and Green Lanes at an average of £328,666.
Which train stations are available in or near Bush Hill Park?
Some of the train stations available in or near Bush Hill Park are Winchmore Hill, Grange Park and Bush Hill Park.
Which tube stations are available in or near Bush Hill Park?
The tube station available in or near Bush Hill Park is Southgate.
Property Price Paid in Bush Hill Park by Year
The average sold property price by year was:
| Year | Average Sold Price | Price Change |
Sold Properties
|
|---|---|---|---|
| 2025 | £529,029 | -12% |
51 Properties |
| 2024 | £594,967 | 24% |
31 Properties |
| 2023 | £451,062 | -35% |
32 Properties |
| 2022 | £608,663 | 3% |
58 Properties |
| 2021 | £587,687 | 20% |
103 Properties |
| 2020 | £469,210 | -4% |
64 Properties |
| 2019 | £485,817 | -1% |
64 Properties |
| 2018 | £492,519 | -0,2% |
51 Properties |
| 2017 | £493,650 | 12% |
68 Properties |
| 2016 | £432,500 | 11% |
63 Properties |
| 2015 | £387,019 | 1% |
89 Properties |
| 2014 | £383,904 | 8% |
77 Properties |
| 2013 | £353,234 | 11% |
67 Properties |
| 2012 | £316,115 | 7% |
52 Properties |
| 2011 | £293,772 | -9% |
46 Properties |
| 2010 | £318,940 | 17% |
59 Properties |
| 2009 | £265,845 | -17% |
49 Properties |
| 2008 | £310,460 | -6% |
41 Properties |
| 2007 | £328,480 | 14% |
122 Properties |
| 2006 | £282,415 | 12% |
133 Properties |
| 2005 | £249,064 | -6% |
81 Properties |
| 2004 | £263,800 | 9% |
109 Properties |
| 2003 | £239,761 | 15% |
100 Properties |
| 2002 | £204,758 | 11% |
95 Properties |
| 2001 | £182,080 | 16% |
106 Properties |
| 2000 | £152,775 | 14% |
83 Properties |
| 1999 | £131,785 | 9% |
135 Properties |
| 1998 | £120,352 | 9% |
87 Properties |
| 1997 | £109,664 | 13% |
115 Properties |
| 1996 | £95,018 | 6% |
101 Properties |
| 1995 | £89,497 | - |
95 Properties |
Property Price per Property Type in Bush Hill Park
Here you can find historic sold price data in order to help with your property search.
The average Property Paid Price for specific property types in the last three years are:
| Property Type | Average Sold Price | Sold Properties |
|---|---|---|
| Semi Detached House | £718,722.00 | 27 Semi Detached Houses |
| Detached House | £728,750.00 | 4 Detached Houses |
| Terraced House | £578,197.00 | 48 Terraced Houses |
| Flat | £279,557.00 | 35 Flats |

