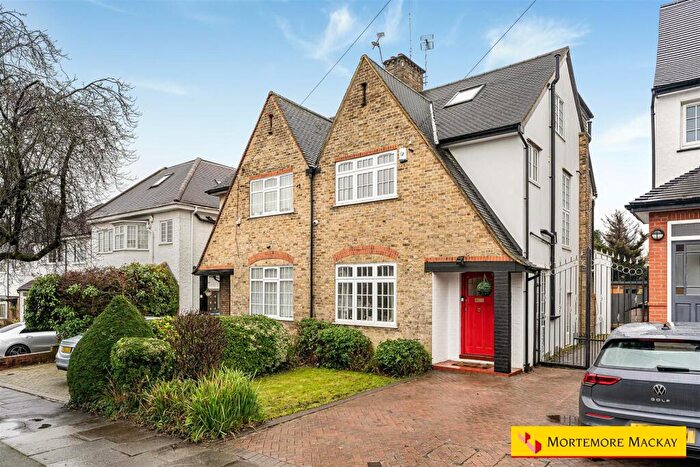
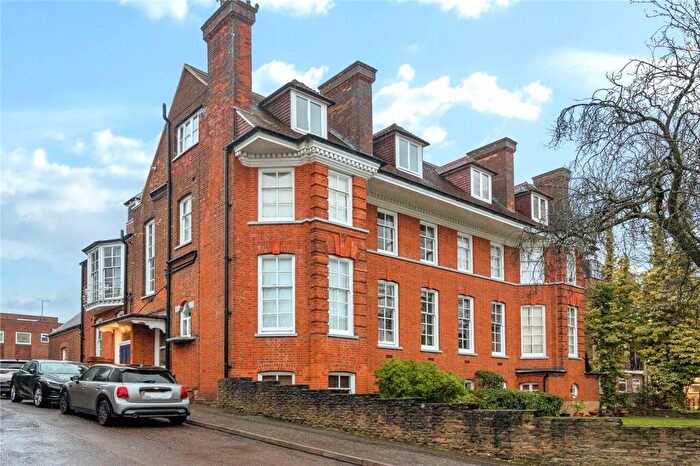
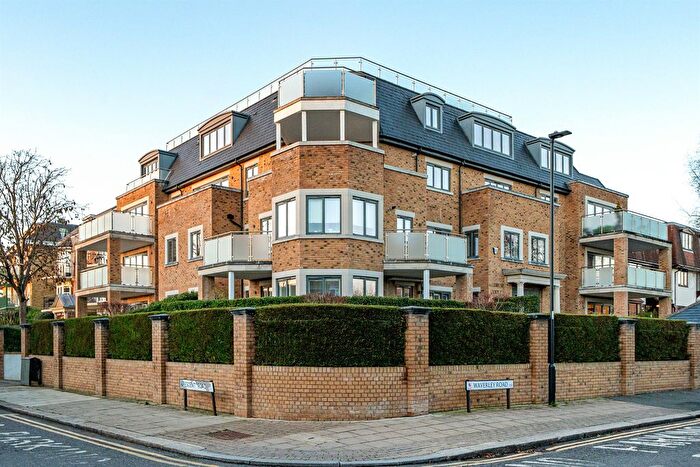
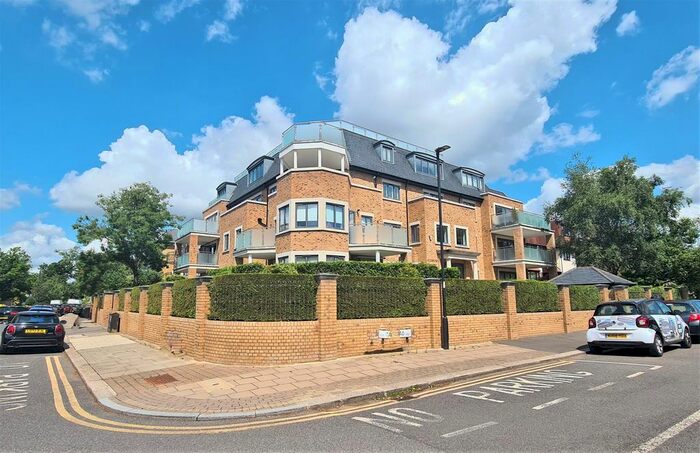
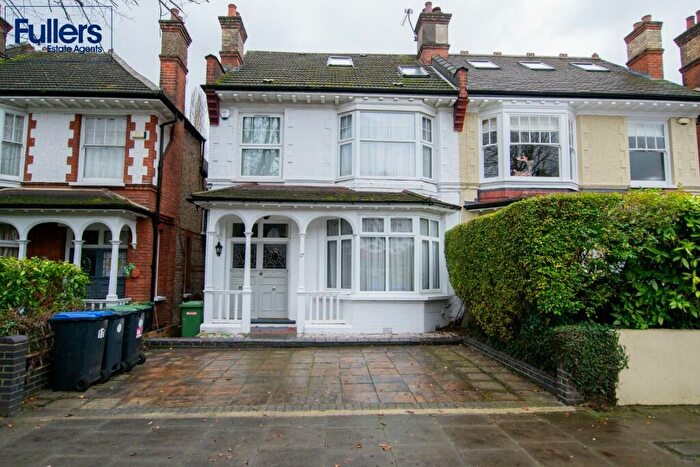
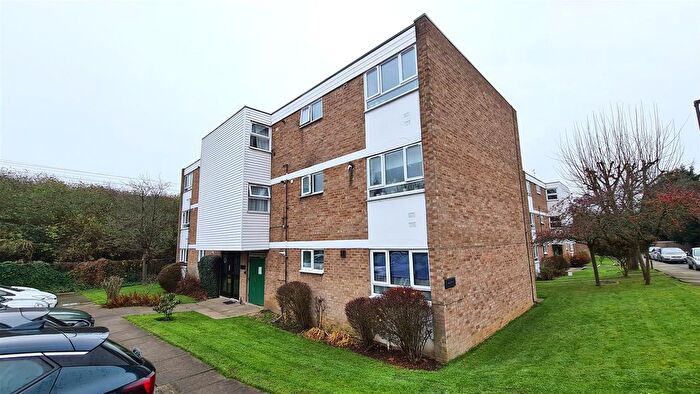
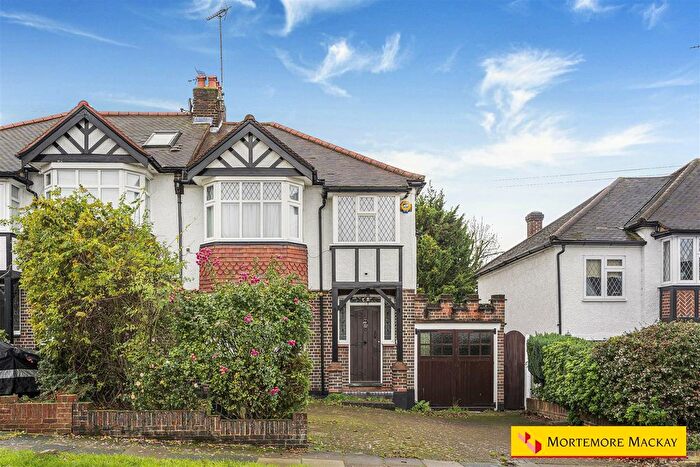
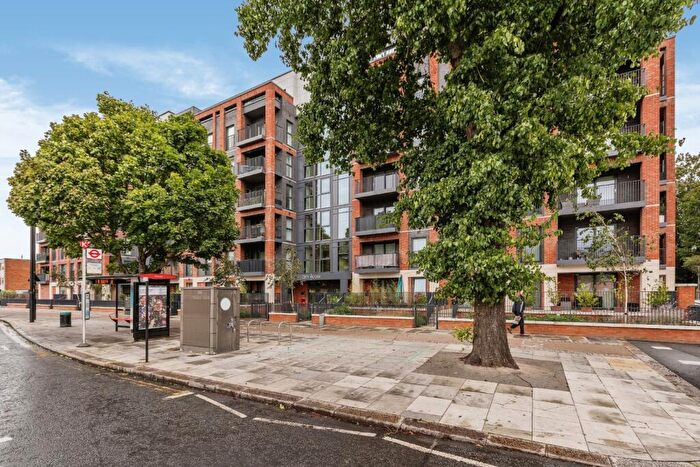
Houses for sale & to rent in Grange, London
House Prices in Grange
Properties in this part of Grange within London have an average house price of £860,539.00 and had 300 Property Transactions within the last 3 years¹. This area has 2,676 households² , where the most expensive property was sold for £2,500,000.00.
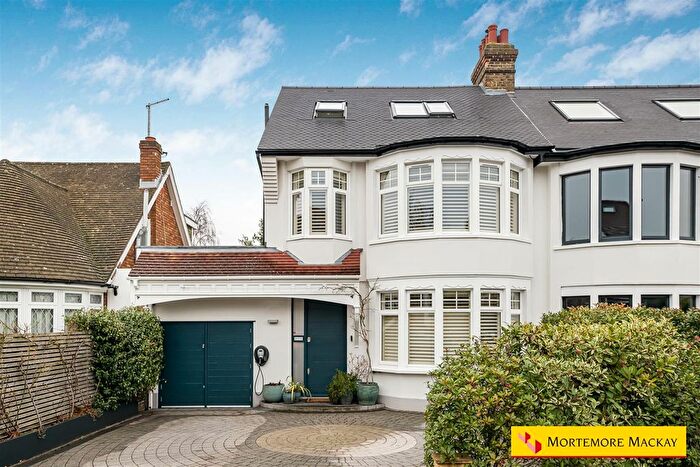
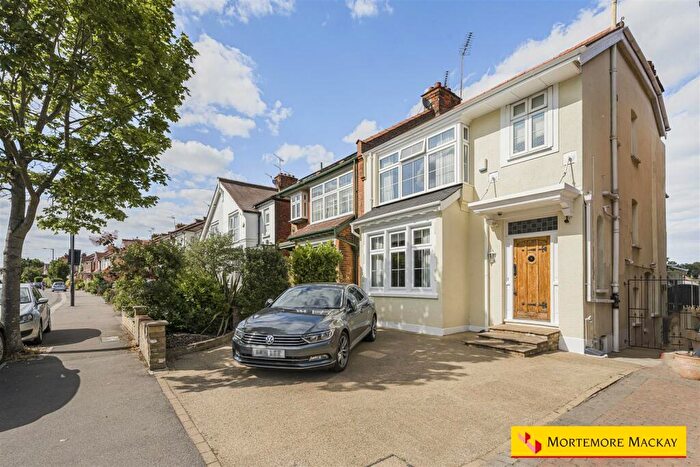
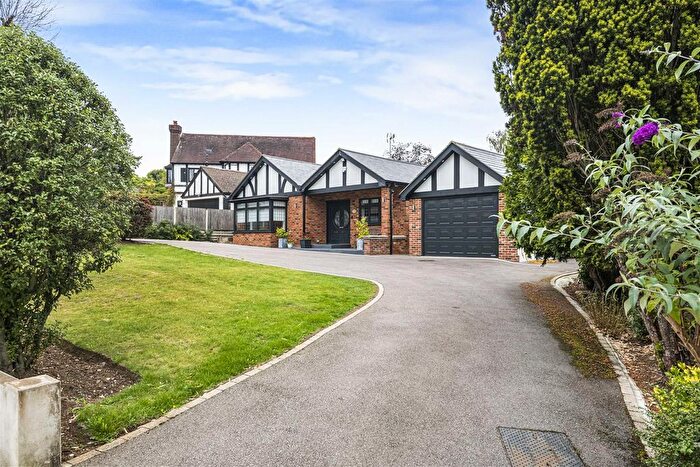
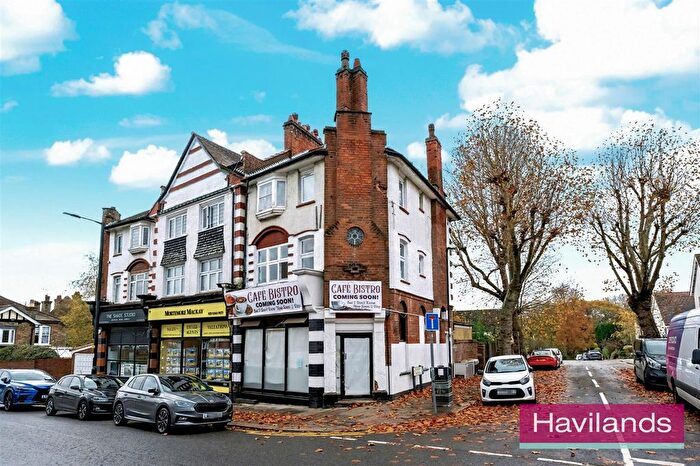
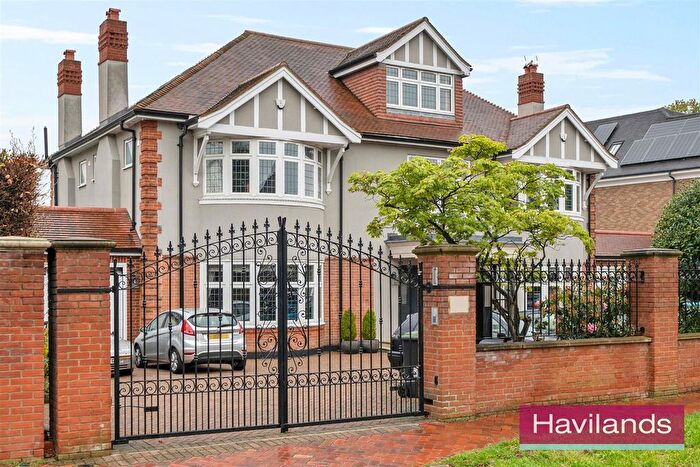
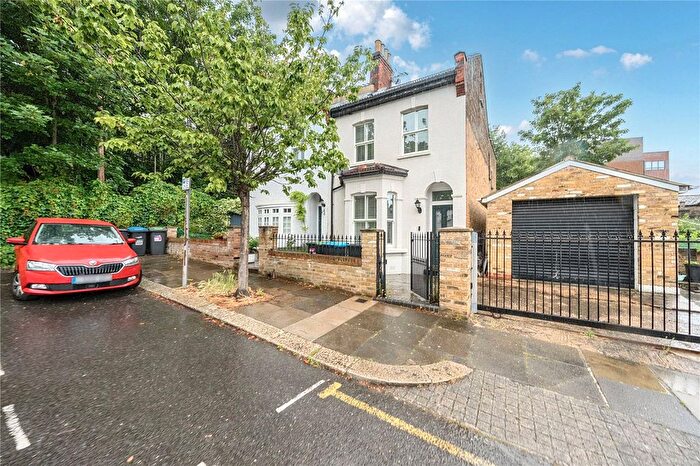
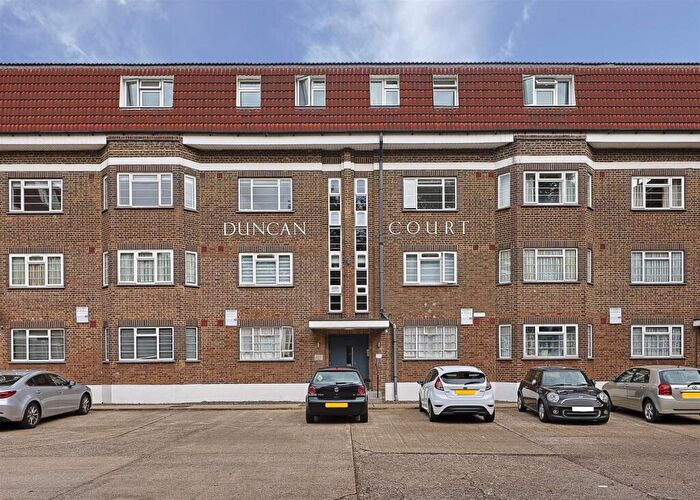
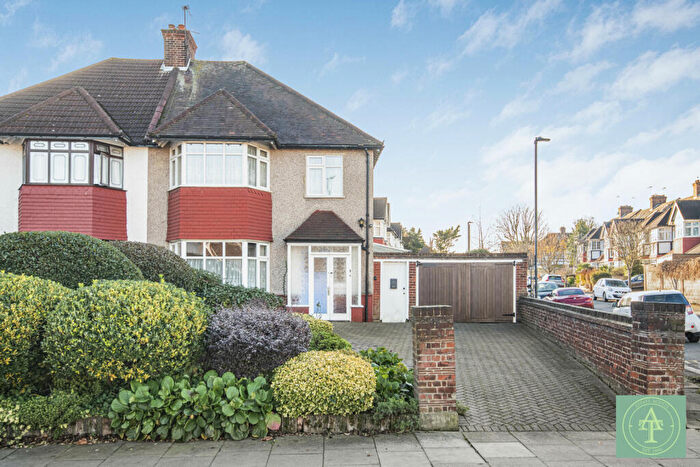
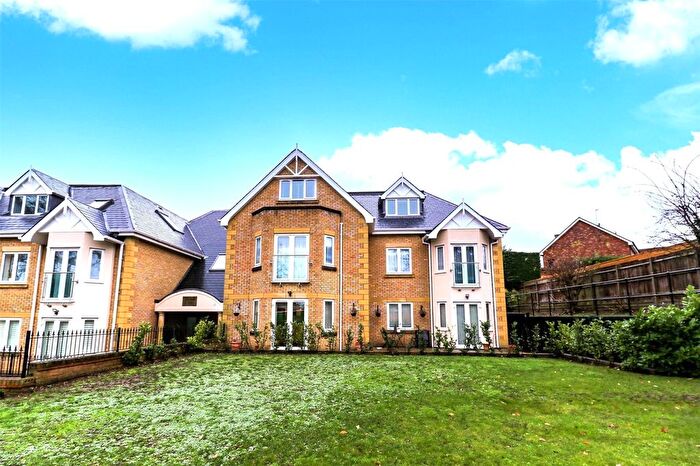
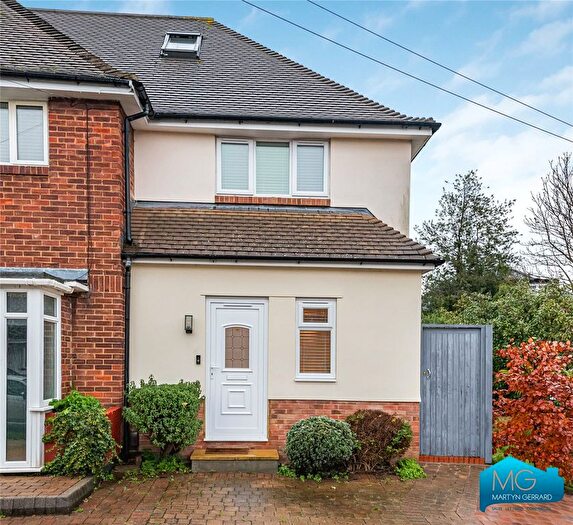
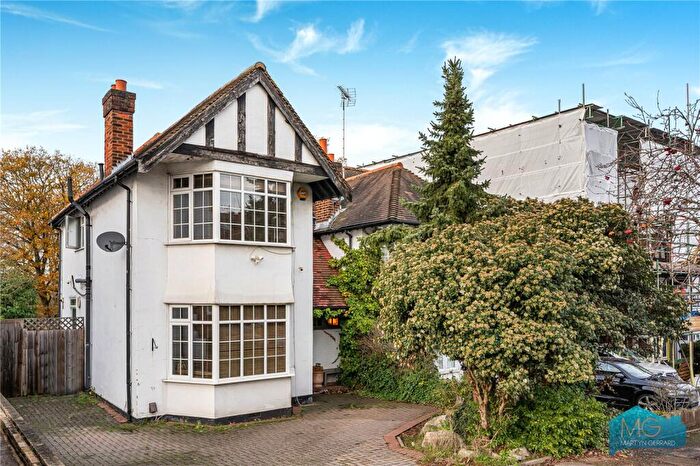
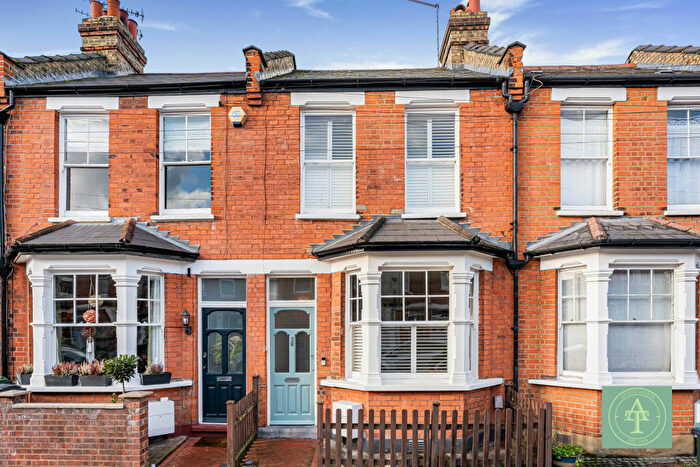
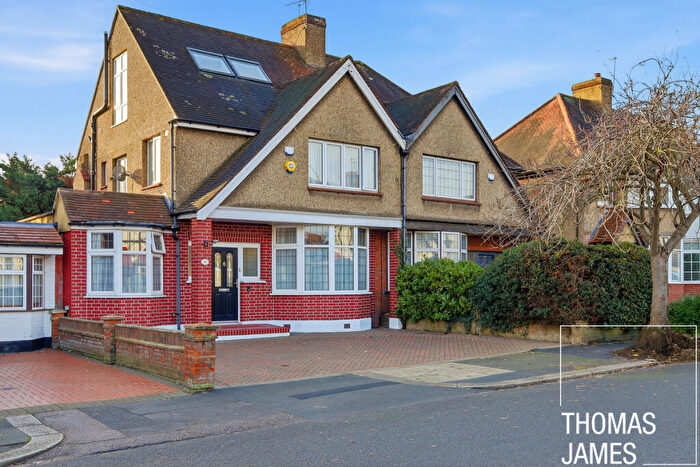
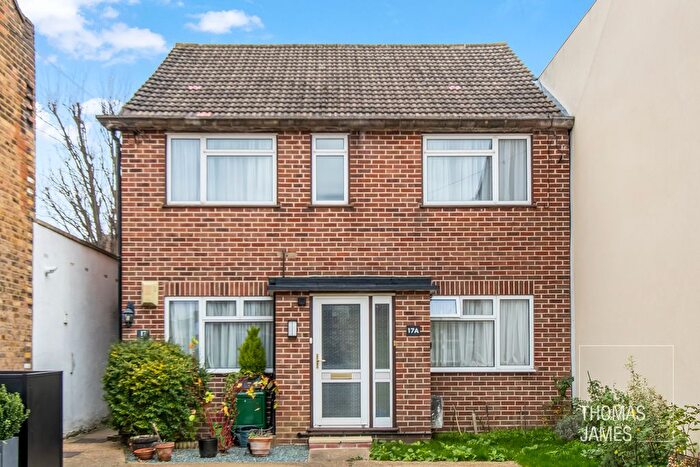
Properties for sale in Grange
Roads and Postcodes in Grange
Navigate through our locations to find the location of your next house in Grange, London for sale or to rent.
Transport near Grange
-
Grange Park Station
-
Winchmore Hill Station
-
Enfield Chase Station
-
Enfield Town Station
-
Bush Hill Park Station
-
Southgate Station
-
Gordon Hill Station
-
Oakwood Station
-
Palmers Green Station
-
Edmonton Green Station
- FAQ
- Price Paid By Year
- Property Type Price
Frequently asked questions about Grange
What is the average price for a property for sale in Grange?
The average price for a property for sale in Grange is £860,539. This amount is 60% higher than the average price in London. There are 1,934 property listings for sale in Grange.
What streets have the most expensive properties for sale in Grange?
The streets with the most expensive properties for sale in Grange are Viga Road at an average of £1,677,000, Ringmer Place at an average of £1,450,000 and The Chine at an average of £1,358,933.
What streets have the most affordable properties for sale in Grange?
The streets with the most affordable properties for sale in Grange are Homewillow Close at an average of £208,058, The Grangeway at an average of £266,250 and Cunard Crescent at an average of £349,863.
Which train stations are available in or near Grange?
Some of the train stations available in or near Grange are Grange Park, Winchmore Hill and Enfield Chase.
Which tube stations are available in or near Grange?
Some of the tube stations available in or near Grange are Southgate and Oakwood.
Property Price Paid in Grange by Year
The average sold property price by year was:
| Year | Average Sold Price | Price Change |
Sold Properties
|
|---|---|---|---|
| 2025 | £804,179 | -8% |
57 Properties |
| 2024 | £872,374 | -6% |
75 Properties |
| 2023 | £922,604 | 9% |
67 Properties |
| 2022 | £842,385 | 9% |
101 Properties |
| 2021 | £769,375 | 1% |
115 Properties |
| 2020 | £761,396 | -5% |
64 Properties |
| 2019 | £798,641 | -2% |
74 Properties |
| 2018 | £815,559 | -1% |
71 Properties |
| 2017 | £827,397 | 13% |
73 Properties |
| 2016 | £723,890 | 10% |
81 Properties |
| 2015 | £653,282 | 12% |
89 Properties |
| 2014 | £576,013 | 12% |
119 Properties |
| 2013 | £507,936 | 5% |
107 Properties |
| 2012 | £484,687 | -9% |
85 Properties |
| 2011 | £528,234 | 13% |
66 Properties |
| 2010 | £459,393 | 3% |
86 Properties |
| 2009 | £447,498 | -8% |
101 Properties |
| 2008 | £484,709 | 4% |
68 Properties |
| 2007 | £463,249 | 15% |
145 Properties |
| 2006 | £392,640 | 13% |
153 Properties |
| 2005 | £340,101 | -10% |
105 Properties |
| 2004 | £374,717 | 7% |
123 Properties |
| 2003 | £350,265 | 8% |
117 Properties |
| 2002 | £322,843 | 15% |
165 Properties |
| 2001 | £273,107 | 12% |
169 Properties |
| 2000 | £239,603 | 23% |
130 Properties |
| 1999 | £185,680 | -6% |
164 Properties |
| 1998 | £197,048 | 13% |
138 Properties |
| 1997 | £171,979 | 19% |
180 Properties |
| 1996 | £138,898 | 5% |
167 Properties |
| 1995 | £132,141 | - |
141 Properties |
Property Price per Property Type in Grange
Here you can find historic sold price data in order to help with your property search.
The average Property Paid Price for specific property types in the last three years are:
| Property Type | Average Sold Price | Sold Properties |
|---|---|---|
| Semi Detached House | £995,178.00 | 107 Semi Detached Houses |
| Detached House | £1,348,415.00 | 65 Detached Houses |
| Terraced House | £754,702.00 | 37 Terraced Houses |
| Flat | £396,776.00 | 91 Flats |

