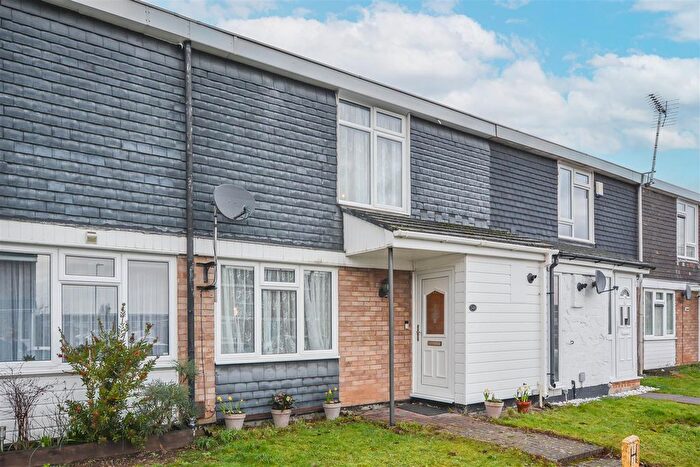
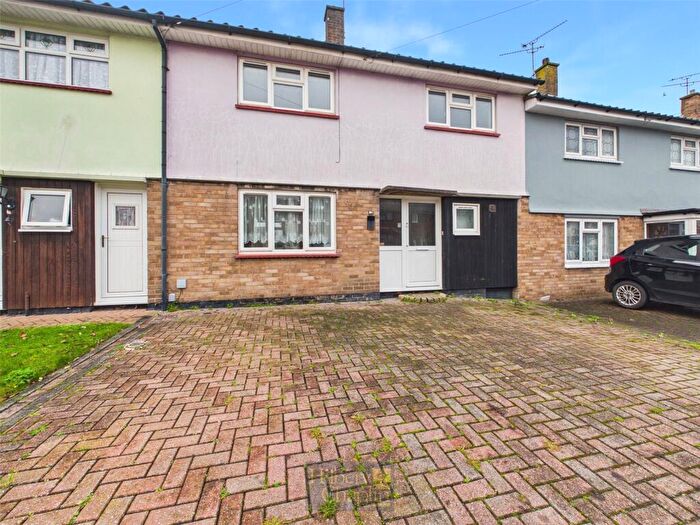
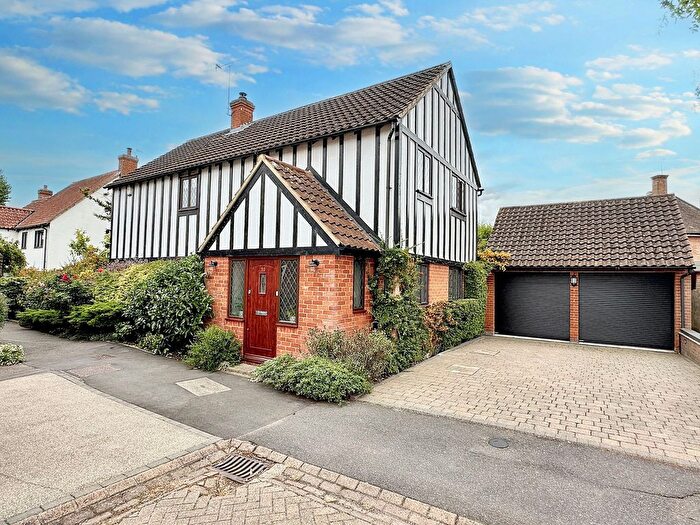
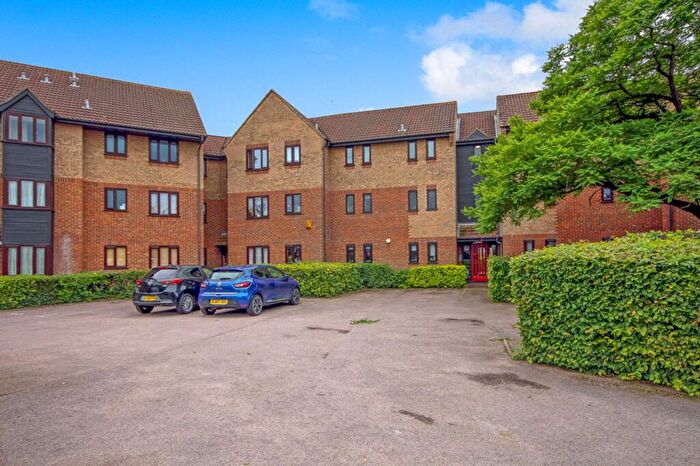
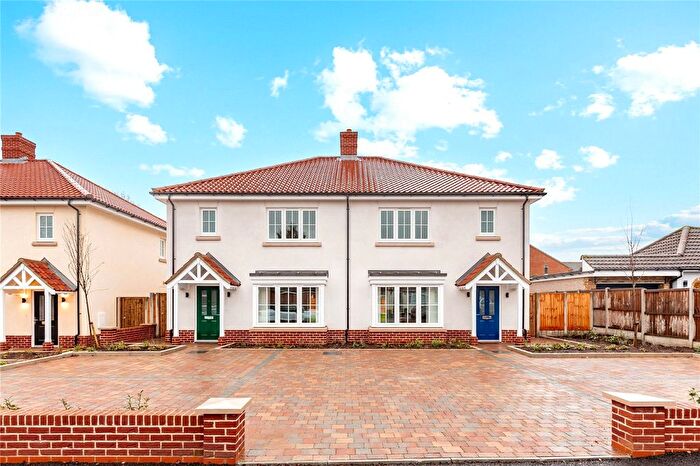
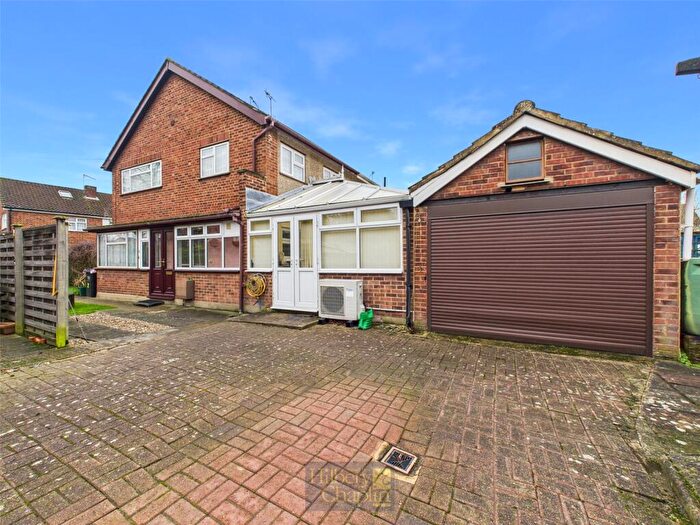
Houses for sale & to rent in Crouch, Basildon
House Prices in Crouch
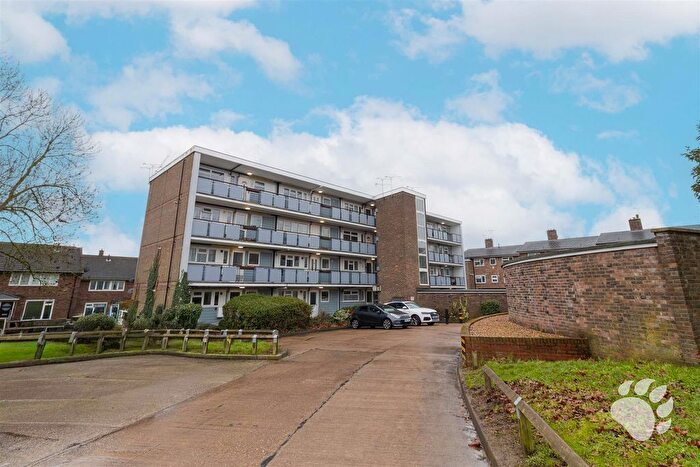
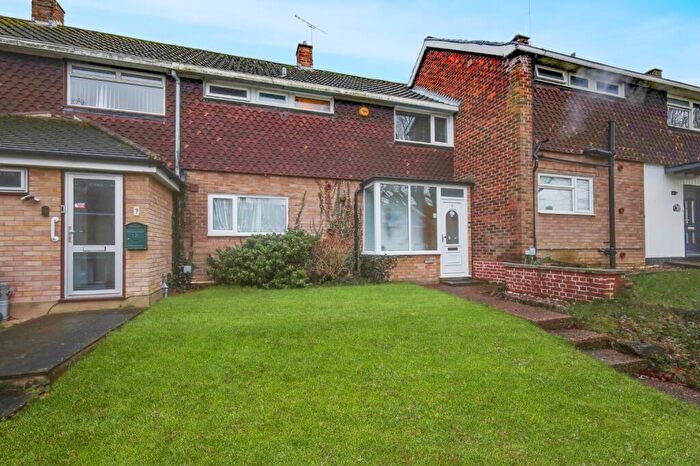
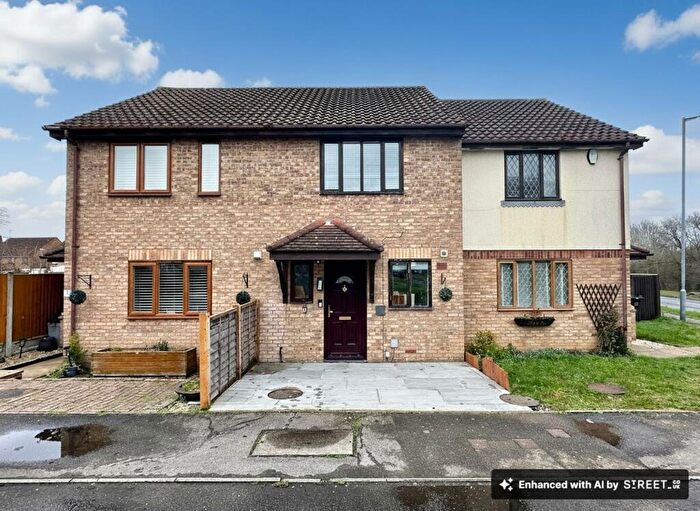
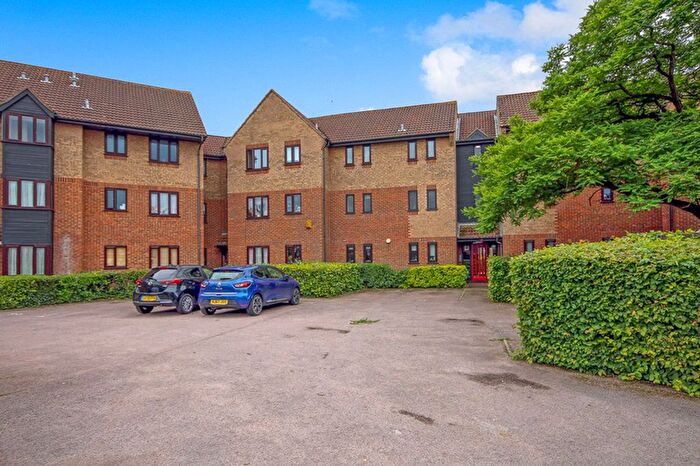
Properties in Crouch have an average house price of £363,208.00 and had 260 Property Transactions within the last 3 years¹.
Crouch is an area in Basildon, Essex with 2,436 households², where the most expensive property was sold for £1,075,000.00.
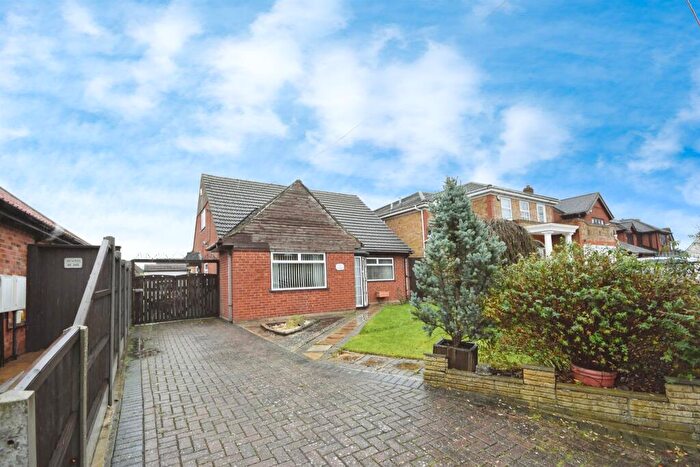
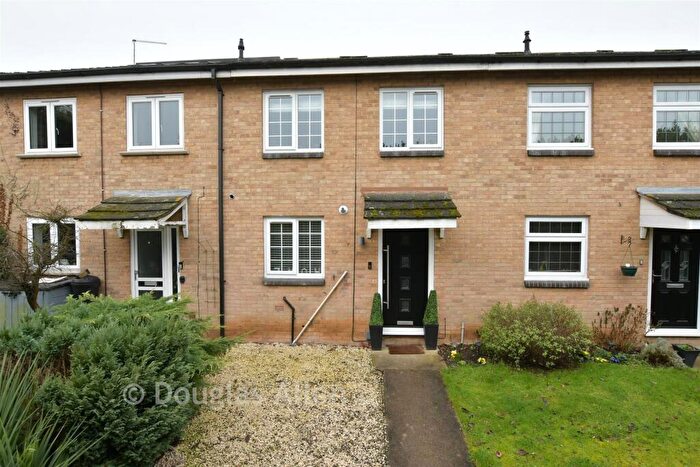
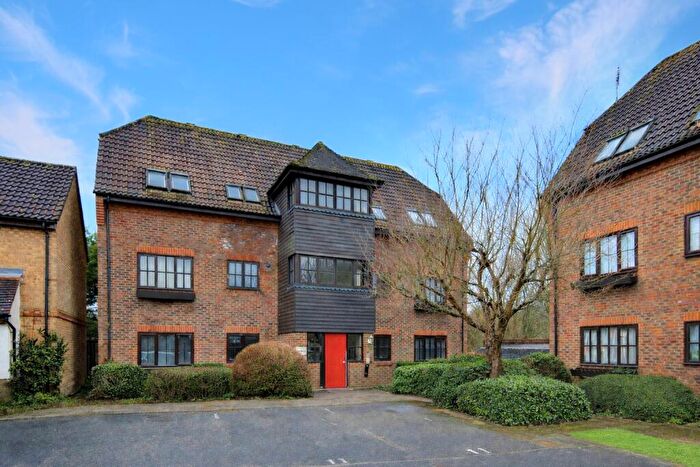
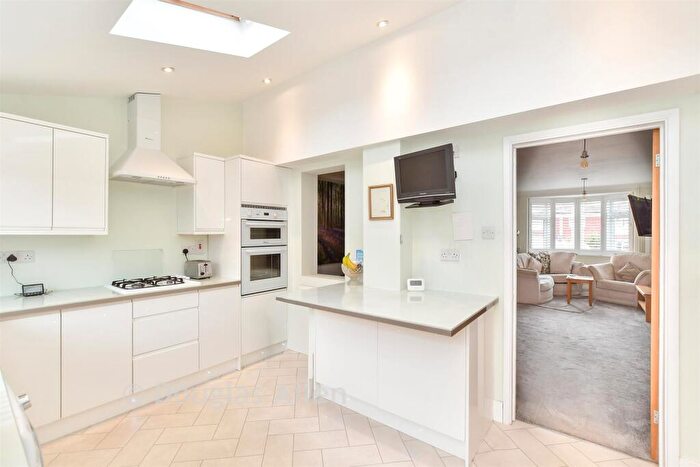
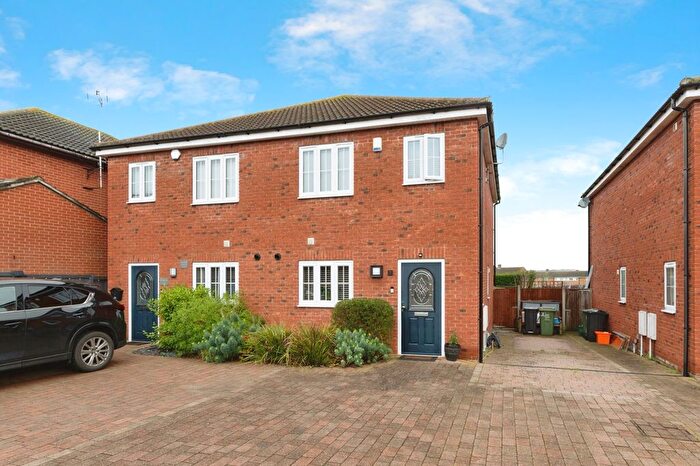
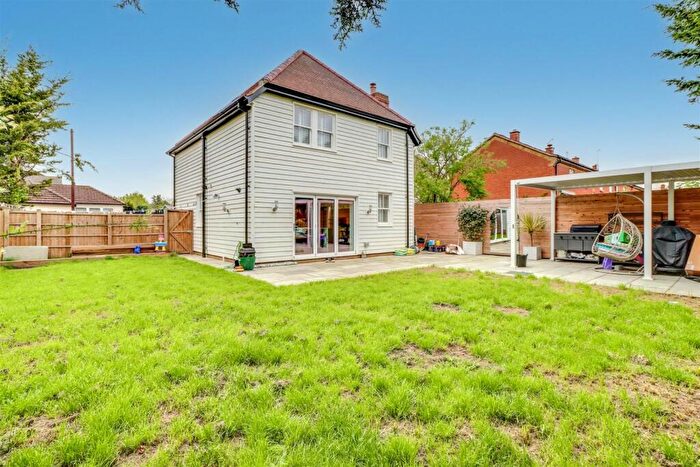
Properties for sale in Crouch
Roads and Postcodes in Crouch
Navigate through our locations to find the location of your next house in Crouch, Basildon for sale or to rent.
| Streets | Postcodes |
|---|---|
| Abbots Court | SS15 5TA SS15 5TB |
| Alder Close | SS15 4AA |
| Arterial Road | SS14 3JN SS14 3AS SS15 4DR SS15 6DR |
| Aspen Court | SS15 4DZ |
| Autumn Mews | SS15 4LE |
| Aylesbury Mews | SS15 4JZ |
| Barleylands Road | SS15 4BG |
| Box Close | SS15 4AG |
| Bramble Tye | SS15 5GR SS15 5GS |
| Bridge Street | SS15 4AY SS15 4EZ |
| Bridgecote Lane | SS15 4BW |
| Calvinia Close | SS15 4FG |
| Cavendish Way | SS15 4ET |
| Chaplin Close | SS15 4EJ |
| Chenies Drive | SS15 4AE |
| Chesham Drive | SS15 4AH |
| Church Road | SS15 4EE SS15 4EH SS15 4EL |
| Coppice Lane | SS15 4JS |
| Crouch Street | SS15 4AT SS15 4AU SS15 4AX SS15 4BA SS15 4BL |
| Cypress Close | SS15 4BF |
| Doves Mews | SS15 4HZ |
| Dunton Road | SS15 4BU SS15 4BX SS15 4BY SS15 4DD SS15 4DA SS15 4DB |
| Durban Lane | SS15 4JU |
| Eastfield Road | SS15 4FH SS15 4JE |
| Ellswood | SS15 4HE |
| Fawcett Drive | SS15 4HX |
| Fir Court | SS15 4EY |
| Fore Street | SS15 4JP SS15 4JR |
| Gate Lodge Square | SS15 4AP |
| Gate Lodge Way | SS15 4AR |
| Goodview Road | SS14 3DN |
| Handleys Chase | SS15 4JB |
| Handleys Court | SS15 4JD |
| Hazel Close | SS15 5GT |
| Hedgerow Court | SS15 5GU |
| High Road North | SS15 4DH SS15 4DP SS15 4HJ |
| Hornbeam Way | SS15 4HF |
| Kenilworth Place | SS15 4DG SS15 4DQ |
| Kimberley Drive | SS15 4DU |
| Kings Crescent | SS15 4AW |
| Kings Road | SS15 4AB SS15 4AQ |
| Ladysmith Way | SS15 4HS |
| Larch Close | SS15 4DY |
| Latimer Drive | SS15 4AD SS15 4AJ |
| Lime Place | SS15 4DN |
| Littlehurst Lane | SS15 4JT |
| Lower Street | SS15 4BB SS15 4BD |
| Lutea Close | SS15 4HB |
| Magnolia Lane | SS15 4HL |
| Martindale Avenue | SS15 4EP |
| New Waverley Road | SS15 4BH SS15 4BJ |
| Noak Hill Road | SS15 4DE SS15 4FL |
| Osier Drive | SS15 4HP |
| Palm Mews | SS15 4JF |
| Pear Tree Close | SS15 4HN |
| Pound Lane Central | SS15 4EX |
| Pound Lane North | SS15 4ES |
| Pretoria Avenue | SS15 4HT |
| Queens Road | SS15 4AL SS15 4AN |
| Redwood Drive | SS15 4AF |
| River View Close | SS15 4FA |
| Robinia Close | SS15 4HD |
| Royston Avenue | SS15 4EW |
| Saling Green | SS15 4AS |
| Spruce Close | SS15 4DF |
| Sweet Briar Drive | SS15 4HA |
| The Pines | SS15 4DW |
| Thetford Place | SS15 4ED |
| Thistle Close | SS15 5GX |
| Tudor Court | SS15 4DX |
| Walnut Close | SS15 4DS SS15 4DT |
| Wash Road | SS15 4AZ SS15 4BE SS15 4BP SS15 4EA SS15 4EN SS15 4ER SS15 4BS |
| Wash Road West | SS15 4BT |
| Waverley Road | SS15 4HU SS15 4EG |
| Whelps Cottages | SS15 4BZ |
| Willowfield | SS15 4EQ |
| Winchester Gardens | SS15 4DJ |
| Wraysbury Drive | SS15 4EF SS15 4HY |
| Wych Mews | SS15 4JG |
| Yew Close | SS15 4EU |
Transport near Crouch
- FAQ
- Price Paid By Year
- Property Type Price
Frequently asked questions about Crouch
What is the average price for a property for sale in Crouch?
The average price for a property for sale in Crouch is £363,208. This amount is 11% higher than the average price in Basildon. There are 3,810 property listings for sale in Crouch.
What streets have the most expensive properties for sale in Crouch?
The streets with the most expensive properties for sale in Crouch are Pound Lane North at an average of £720,000, Dunton Road at an average of £656,000 and Kimberley Drive at an average of £580,000.
What streets have the most affordable properties for sale in Crouch?
The streets with the most affordable properties for sale in Crouch are Walnut Close at an average of £191,214, Spruce Close at an average of £214,250 and Osier Drive at an average of £220,437.
Which train stations are available in or near Crouch?
Some of the train stations available in or near Crouch are Laindon, Basildon and Billericay.
Property Price Paid in Crouch by Year
The average sold property price by year was:
| Year | Average Sold Price | Price Change |
Sold Properties
|
|---|---|---|---|
| 2025 | £372,932 | 1% |
94 Properties |
| 2024 | £369,857 | 9% |
102 Properties |
| 2023 | £338,329 | -12% |
64 Properties |
| 2022 | £378,447 | 7% |
129 Properties |
| 2021 | £351,873 | 0,1% |
176 Properties |
| 2020 | £351,527 | 8% |
92 Properties |
| 2019 | £321,763 | 9% |
118 Properties |
| 2018 | £291,591 | -4% |
98 Properties |
| 2017 | £302,183 | 7% |
114 Properties |
| 2016 | £280,749 | 8% |
132 Properties |
| 2015 | £258,674 | 6% |
121 Properties |
| 2014 | £242,015 | 12% |
133 Properties |
| 2013 | £211,991 | -6% |
92 Properties |
| 2012 | £224,358 | 9% |
92 Properties |
| 2011 | £205,013 | 3% |
87 Properties |
| 2010 | £199,441 | 7% |
105 Properties |
| 2009 | £186,298 | -10% |
71 Properties |
| 2008 | £204,350 | -5% |
58 Properties |
| 2007 | £215,014 | 7% |
197 Properties |
| 2006 | £200,201 | - |
188 Properties |
| 2005 | £200,217 | 12% |
159 Properties |
| 2004 | £175,877 | 4% |
290 Properties |
| 2003 | £168,178 | 14% |
190 Properties |
| 2002 | £144,335 | 18% |
232 Properties |
| 2001 | £117,716 | 4% |
192 Properties |
| 2000 | £112,485 | 14% |
199 Properties |
| 1999 | £96,363 | 13% |
329 Properties |
| 1998 | £84,088 | 2% |
215 Properties |
| 1997 | £82,400 | 7% |
300 Properties |
| 1996 | £76,711 | 4% |
232 Properties |
| 1995 | £73,866 | - |
142 Properties |
Property Price per Property Type in Crouch
Here you can find historic sold price data in order to help with your property search.
The average Property Paid Price for specific property types in the last three years are:
| Property Type | Average Sold Price | Sold Properties |
|---|---|---|
| Semi Detached House | £403,697.00 | 48 Semi Detached Houses |
| Detached House | £515,729.00 | 65 Detached Houses |
| Terraced House | £337,842.00 | 82 Terraced Houses |
| Flat | £212,788.00 | 65 Flats |

