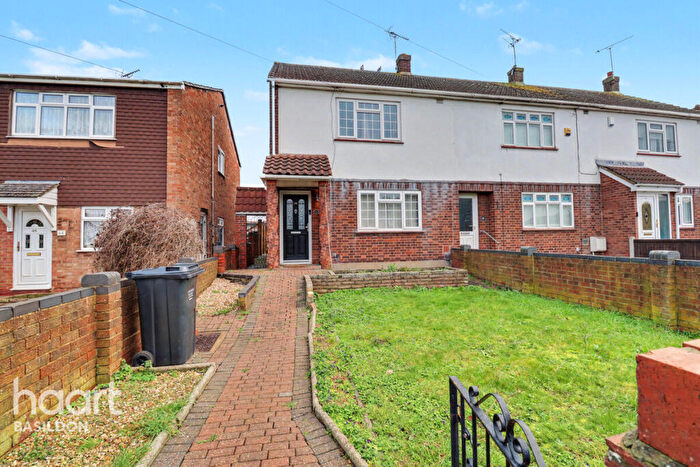
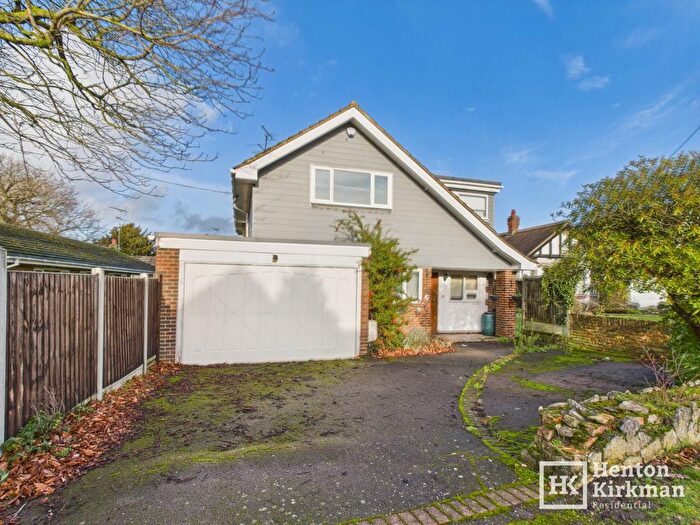
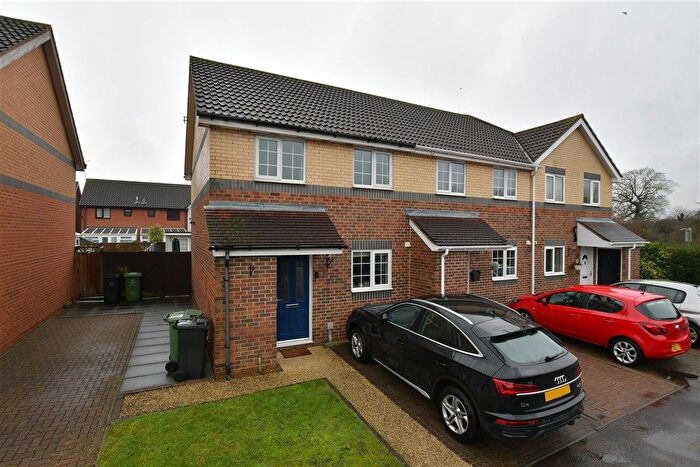
Houses for sale & to rent in Crouch, Billericay
House Prices in Crouch
Properties in Crouch have an average house price of £865,476.00 and had 63 Property Transactions within the last 3 years¹.
Crouch is an area in Billericay, Essex with 852 households², where the most expensive property was sold for £2,860,000.00.
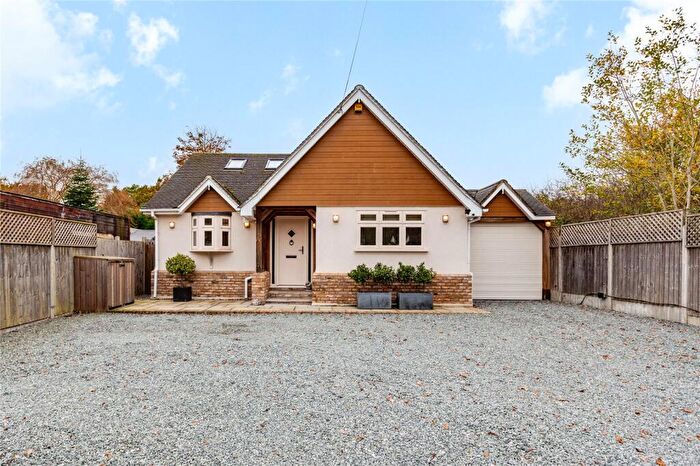
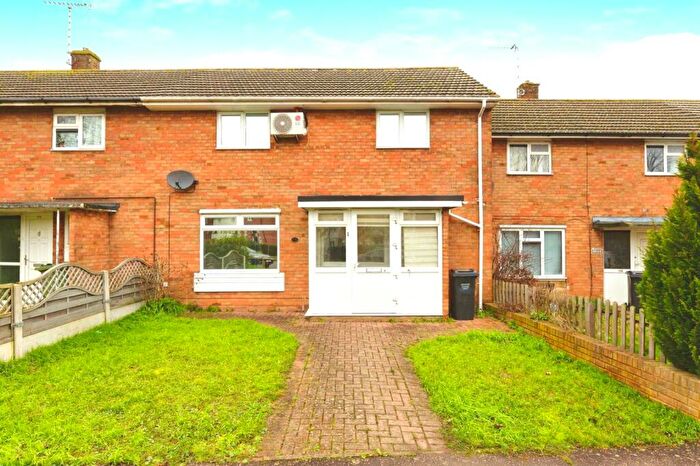
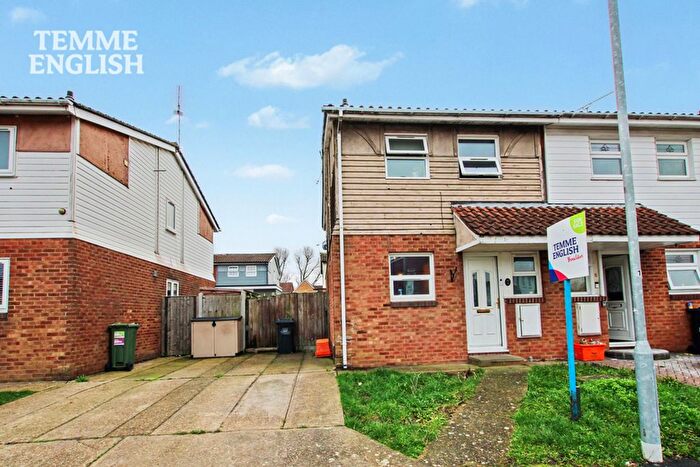
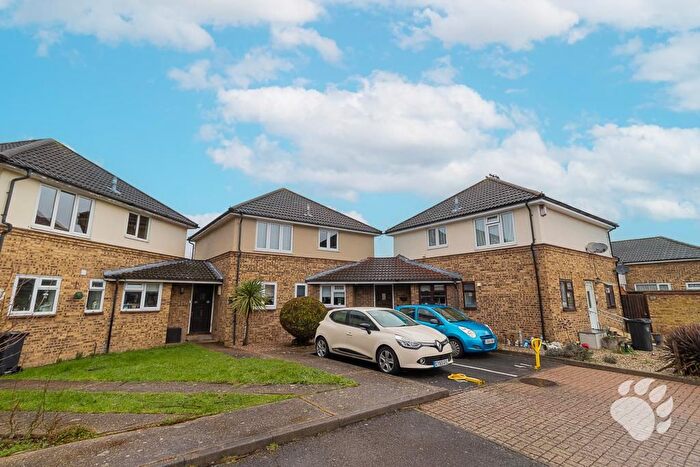
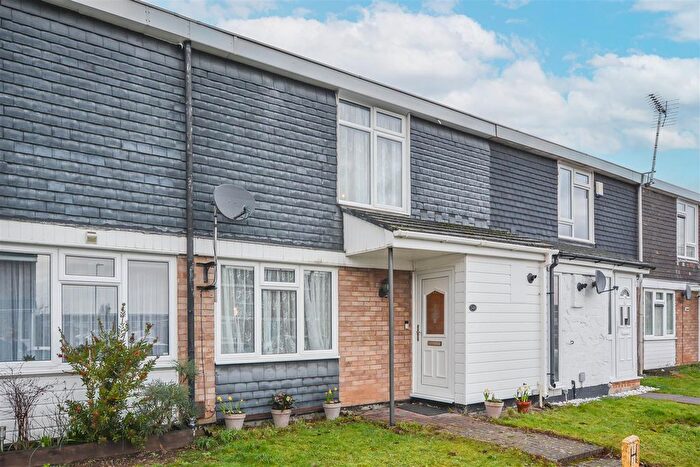
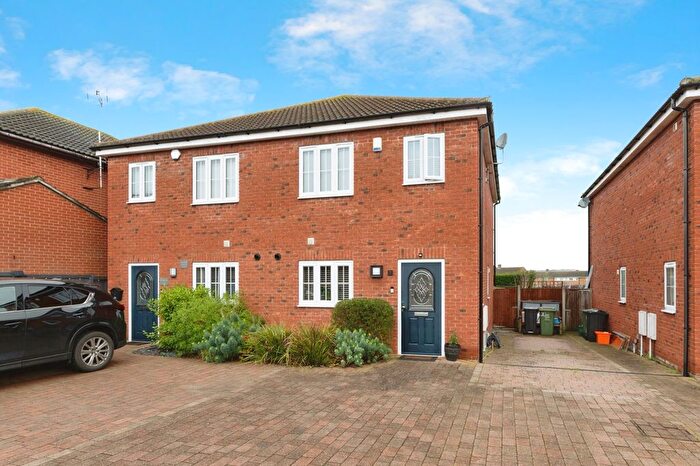
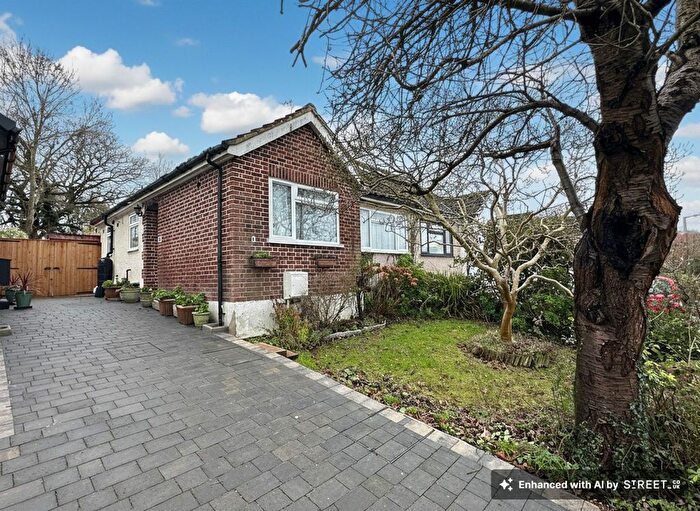
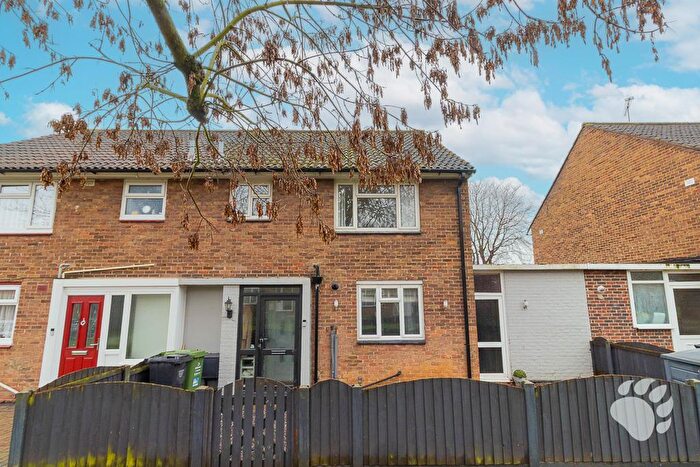
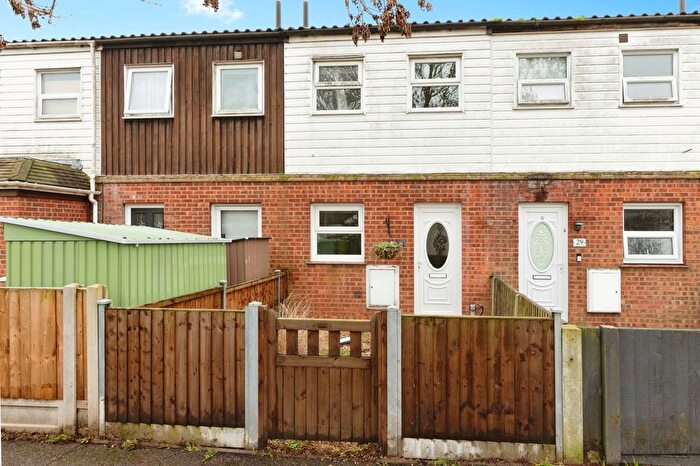
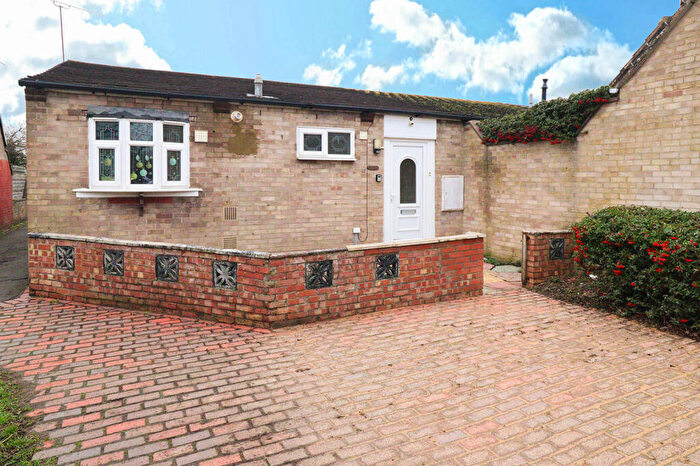
Properties for sale in Crouch
Roads and Postcodes in Crouch
Navigate through our locations to find the location of your next house in Crouch, Billericay for sale or to rent.
| Streets | Postcodes |
|---|---|
| Approach Road | CM11 2UT |
| Barleylands Road | CM11 2UF |
| Belvedere Close | CM11 2ET CM11 2FA CM11 2FB |
| Belvedere Lane | CM11 2FD |
| Borwick Lane | CM11 2XF |
| Bromfelde Road | CM11 2XT |
| Bury Farm Lane | CM11 2XG |
| Church Lane | CM11 2UN |
| Church Road | CM11 1PJ CM11 1RH CM11 1RN CM11 1RR CM11 1RT CM11 1PL CM11 1RG |
| Corner Road | CM11 2UX |
| Crays Hill | CM11 2XJ CM11 2XL CM11 2XN CM11 2XP CM11 2XR CM11 2YA CM11 2YB CM11 2UL |
| Crays Hill Park | CM11 2XZ |
| Crays Hill Road | CM11 2YP CM11 2YR CM11 2YW |
| Dunton Road | CM12 9TY CM12 9TZ |
| Gardiners Lane North | CM11 2XA CM11 2XE |
| Glebe Road | CM11 1RJ CM11 1RL |
| Hardings Elms Road | CM11 2UH |
| High View Rise | CM11 2JE CM11 2XU |
| Homestead Road | CM11 1RP |
| Hope Road | CM11 2XS |
| Jubilee Road | CM11 2YF |
| London Road | CM11 2UR CM11 2UY CM11 2XY CM11 2UP CM11 2UZ |
| Matthews Mead | CM11 2ZD |
| North Road | CM11 2XD |
| Oak Avenue | CM11 2YD CM11 2YE |
| Oak Lane | CM11 2YH CM11 2YJ |
| Oak Road | CM11 2YG CM11 2YL CM11 2YQ |
| Orchard Avenue | CM11 1PH |
| Park Lane | CM11 1NP |
| Pipps Hill Road North | CM11 2UJ |
| Pitsea View Road | CM11 2YN |
| Ramsden Park Road | CM11 1NR CM11 1NS |
| Southlands Road | CM11 2XB |
| Staceys Mount | CM11 2XH |
Transport near Crouch
- FAQ
- Price Paid By Year
- Property Type Price
Frequently asked questions about Crouch
What is the average price for a property for sale in Crouch?
The average price for a property for sale in Crouch is £865,476. This amount is 60% higher than the average price in Billericay. There are more than 10,000 property listings for sale in Crouch.
What streets have the most expensive properties for sale in Crouch?
The streets with the most expensive properties for sale in Crouch are Glebe Road at an average of £1,785,000, Homestead Road at an average of £1,363,125 and Church Road at an average of £1,195,000.
What streets have the most affordable properties for sale in Crouch?
The streets with the most affordable properties for sale in Crouch are High View Rise at an average of £420,000, Hope Road at an average of £515,000 and Oak Avenue at an average of £560,000.
Which train stations are available in or near Crouch?
Some of the train stations available in or near Crouch are Wickford, Basildon and Billericay.
Property Price Paid in Crouch by Year
The average sold property price by year was:
| Year | Average Sold Price | Price Change |
Sold Properties
|
|---|---|---|---|
| 2025 | £923,666 | 12% |
24 Properties |
| 2024 | £813,190 | -4% |
21 Properties |
| 2023 | £848,888 | 2% |
18 Properties |
| 2022 | £833,257 | 10% |
33 Properties |
| 2021 | £753,209 | 0,1% |
29 Properties |
| 2020 | £752,305 | 16% |
18 Properties |
| 2019 | £634,571 | -18% |
28 Properties |
| 2018 | £747,803 | -0,2% |
26 Properties |
| 2017 | £749,552 | 2% |
38 Properties |
| 2016 | £735,217 | 17% |
23 Properties |
| 2015 | £607,710 | 3% |
39 Properties |
| 2014 | £589,860 | 10% |
25 Properties |
| 2013 | £531,144 | -3% |
18 Properties |
| 2012 | £545,545 | -4% |
11 Properties |
| 2011 | £565,416 | 10% |
24 Properties |
| 2010 | £509,000 | -10% |
15 Properties |
| 2009 | £560,261 | 4% |
14 Properties |
| 2008 | £540,289 | 8% |
19 Properties |
| 2007 | £497,585 | 13% |
29 Properties |
| 2006 | £433,027 | 19% |
18 Properties |
| 2005 | £349,673 | -9% |
23 Properties |
| 2004 | £381,012 | -8% |
37 Properties |
| 2003 | £411,652 | 23% |
36 Properties |
| 2002 | £315,257 | -1% |
41 Properties |
| 2001 | £319,824 | 4% |
39 Properties |
| 2000 | £306,030 | 29% |
32 Properties |
| 1999 | £217,484 | -5% |
34 Properties |
| 1998 | £227,410 | 21% |
28 Properties |
| 1997 | £178,988 | 24% |
46 Properties |
| 1996 | £136,506 | -4% |
34 Properties |
| 1995 | £141,929 | - |
24 Properties |
Property Price per Property Type in Crouch
Here you can find historic sold price data in order to help with your property search.
The average Property Paid Price for specific property types in the last three years are:
| Property Type | Average Sold Price | Sold Properties |
|---|---|---|
| Semi Detached House | £492,111.00 | 9 Semi Detached Houses |
| Detached House | £927,703.00 | 54 Detached Houses |

