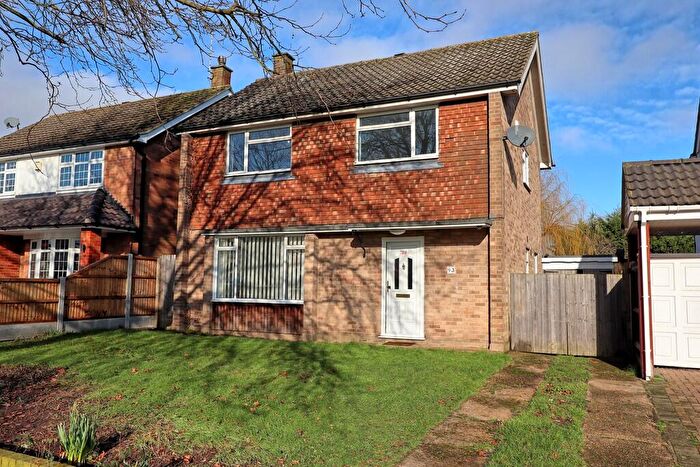
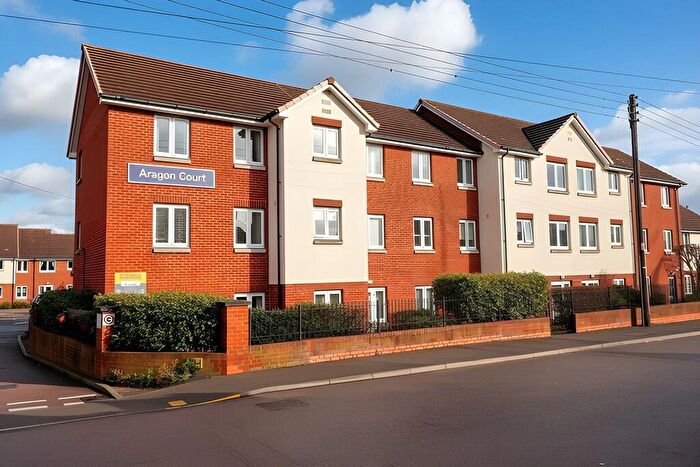
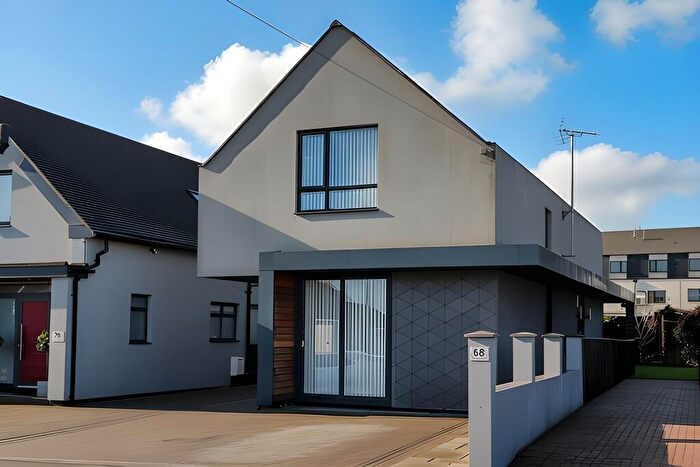
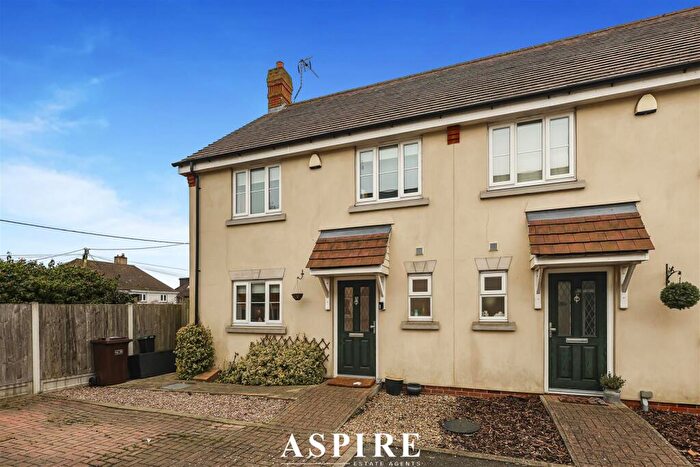
Houses for sale & to rent in St James, Benfleet
House Prices in St James
Properties in St James have an average house price of £379,564.00 and had 320 Property Transactions within the last 3 years¹.
St James is an area in Benfleet, Essex with 2,778 households², where the most expensive property was sold for £999,950.00.
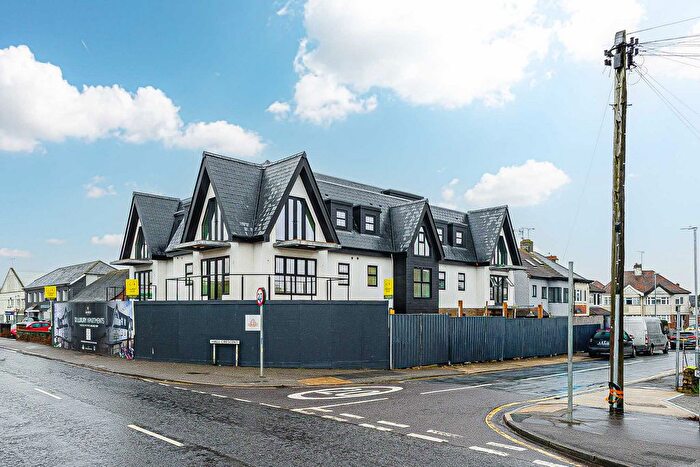
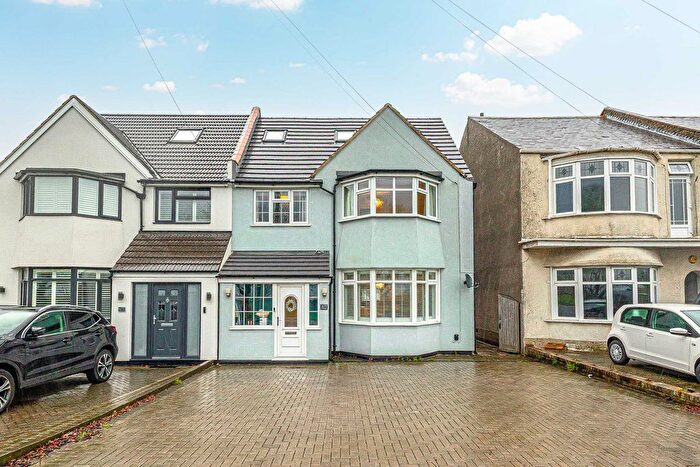
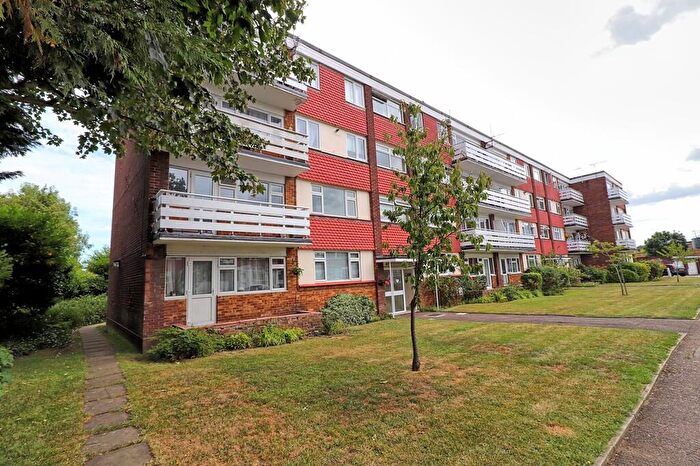
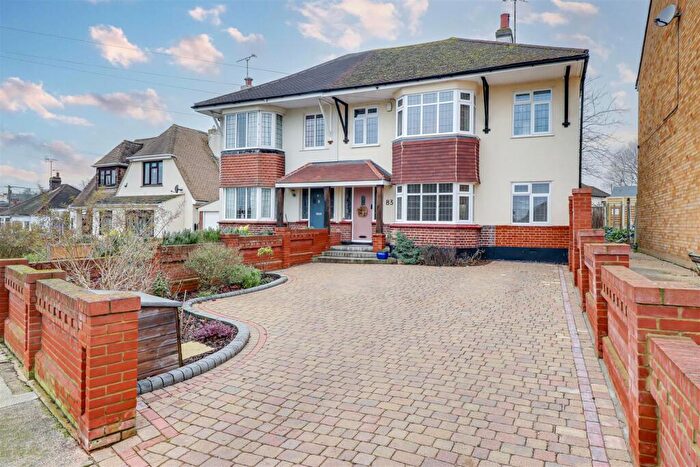
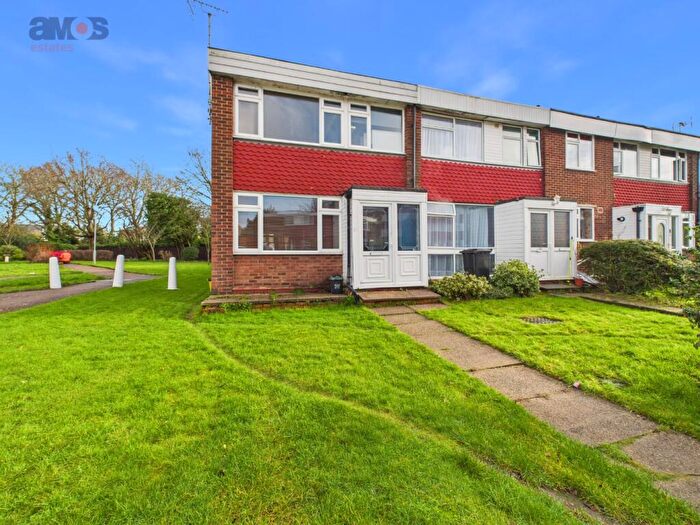
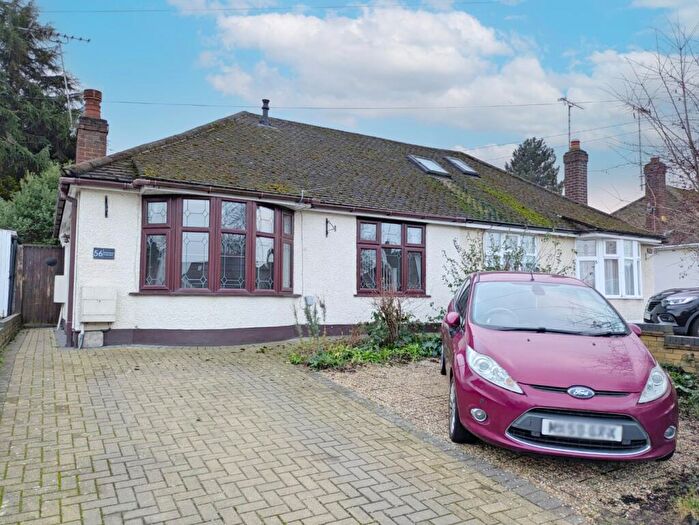
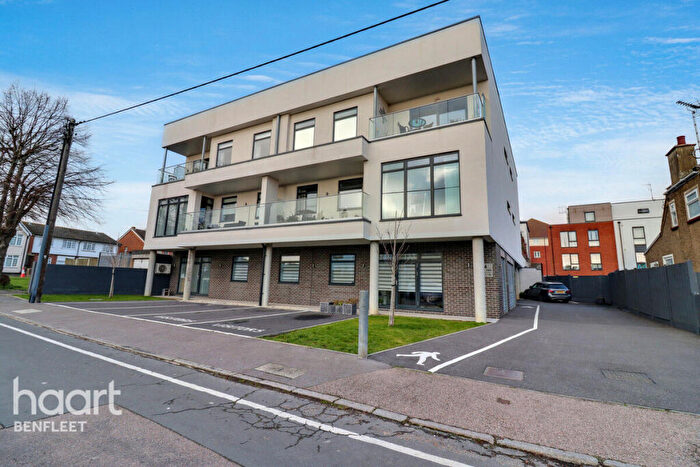
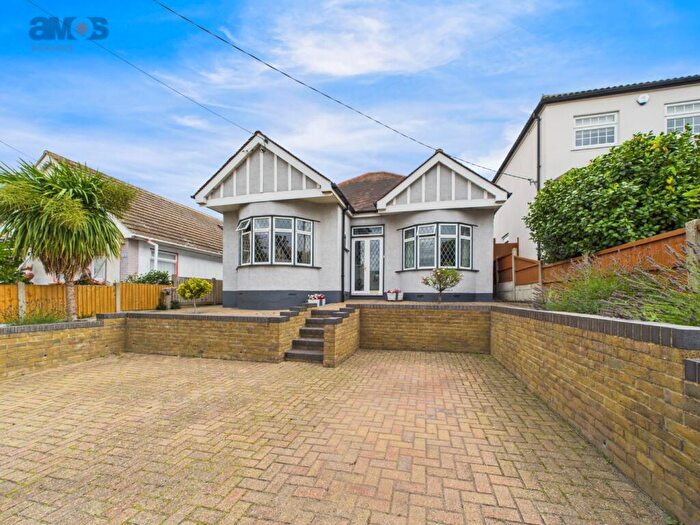
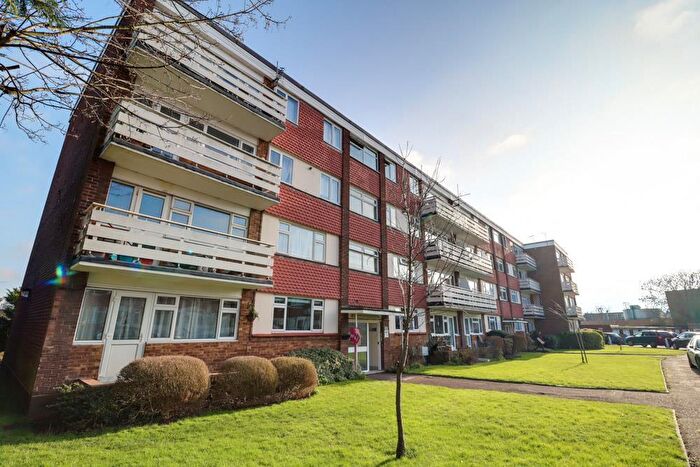
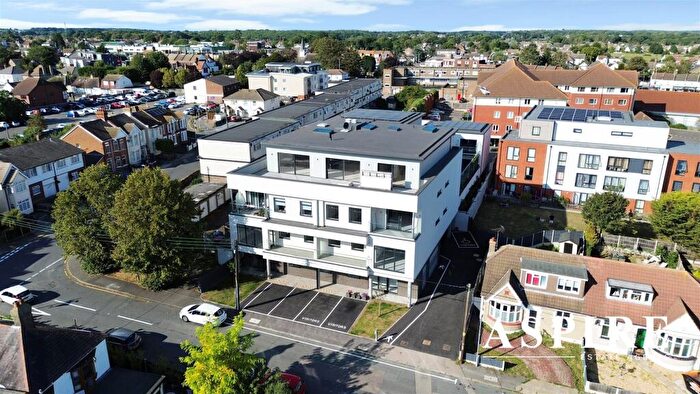
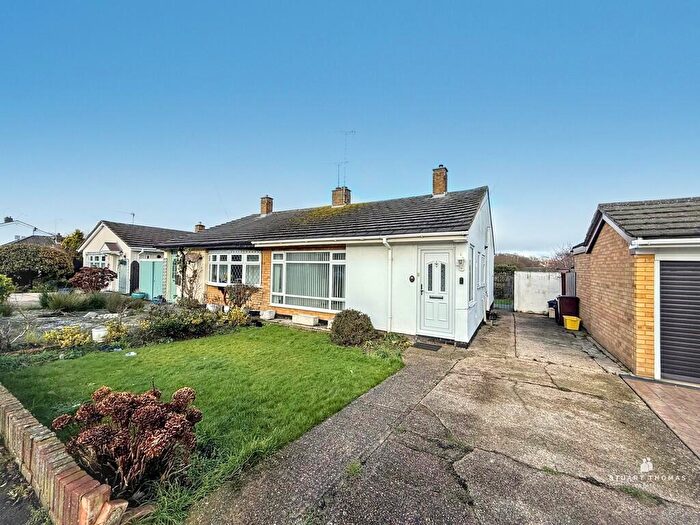
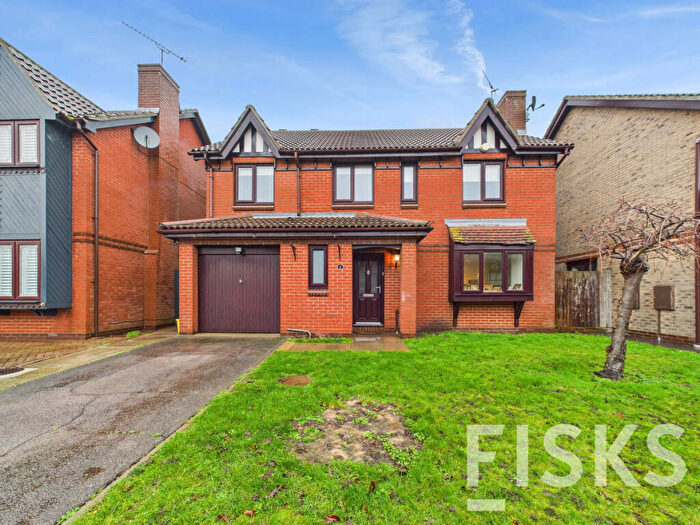
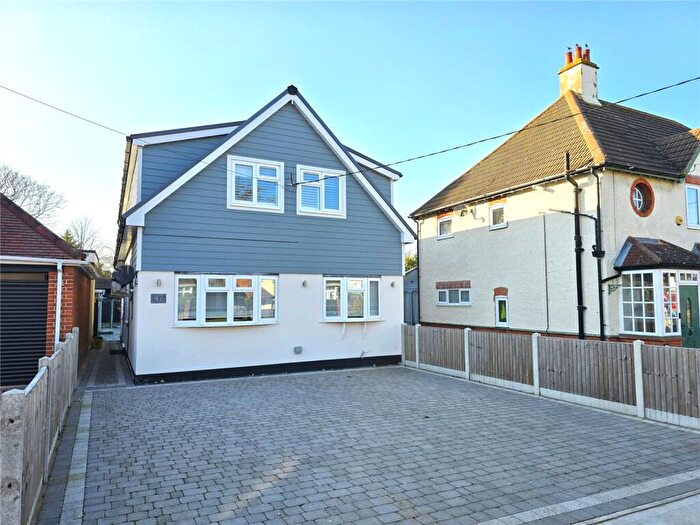
Properties for sale in St James
Roads and Postcodes in St James
Navigate through our locations to find the location of your next house in St James, Benfleet for sale or to rent.
| Streets | Postcodes |
|---|---|
| Castle Lane | SS7 2AR SS7 2AE SS7 2AF SS7 2AL SS7 2AP |
| Alma Close | SS7 2EG |
| Alma Road | SS7 2EF |
| Ash Road | SS7 2BA |
| Beech Road | SS7 2AG SS7 2AZ SS7 2FW |
| Benfleet Road | SS7 1LY SS7 1NY |
| Bilton Road | SS7 2HH SS7 2HQ |
| Branch Road | SS7 2AX |
| Broughton Road | SS7 2HD |
| Burlington Gardens | SS7 2JJ SS7 2JL |
| Castle Road | SS7 2AT SS7 2AU SS7 2AY |
| Chandos Parade | SS7 2HT |
| Chapel Lane | SS7 2PP SS7 2PQ SS7 2PW |
| Church Road | SS7 2DG SS7 2DQ SS7 2DW SS7 2EJ SS7 2GB SS7 2HA SS7 2GA |
| Church Way | SS7 2EU |
| Conifers | SS7 2JR |
| Crescent Place | SS7 2FN |
| Douglas Road | SS7 2HN |
| Elm Road | SS7 2AH |
| Estate Road | SS7 2EW |
| Fairlight Road | SS7 2QJ |
| Fernwood | SS7 2LT |
| Florence Close | SS7 2PN |
| Florence Gardens | SS7 2PJ SS7 2PH |
| Galleydene | SS7 2QA |
| Glebe Way | SS7 2HS |
| Greenacres | SS7 2JB SS7 2JD |
| Hazel Close | SS7 2EP |
| Heather Drive | SS7 2EL |
| High Street | SS7 2PA SS7 2PB |
| Homestead Gardens | SS7 2AB |
| Homestead Road | SS7 2AD |
| Homestead Way | SS7 2AA |
| Leigh Heights | SS7 2JN |
| Links Way | SS7 2ER |
| London Road | SS7 1BD SS7 2BN SS7 2BT SS7 2DA SS7 2DD SS7 2DE SS7 2EA SS7 2EB SS7 2ED SS7 2EE SS7 2PD SS7 2PG SS7 2RA SS7 2RD SS7 2RF SS7 2BY SS7 2FB SS7 2QP SS7 2RB |
| Lynton Road | SS7 2QG SS7 2QQ |
| Meadow Road | SS7 2DN SS7 2DP |
| Mornington Crescent | SS7 2HP SS7 2HW |
| Mountnessing | SS7 2QB |
| New Road | SS7 2RG SS7 2RL |
| Oak Road North | SS7 2DH SS7 2FJ SS7 2FL |
| Oak Road South | SS7 2BB SS7 2BF SS7 2BG |
| Orchill Drive | SS7 2LS |
| Ormonde Avenue | SS7 2EN |
| Park Chase | SS7 2BZ |
| Pilgrims Way | SS7 2HU |
| Pine Road | SS7 2AQ |
| Poors Lane | SS7 2LN |
| Rectory Close | SS7 2NF |
| Rectory Road | SS7 2NA SS7 2ND SS7 2NQ |
| Sandbanks | SS7 2AW |
| Scrub Lane | SS7 2JA SS7 2JE SS7 2JG SS7 2JP SS7 2JQ SS7 2JW |
| Seaview Terrace | SS7 2AS |
| Seymour Road | SS7 2HB SS7 2HJ SS7 2HL |
| Shepherds Close | SS7 2LR |
| Shepherds Walk | SS7 2LP |
| Short Road | SS7 2AJ |
| Softwater Lane | SS7 2NE |
| Solbys Lane | SS7 2NG |
| St Johns Road | SS7 2PT SS7 2PZ |
| St Marks Road | SS7 2PU SS7 2PY |
| Temple Close | SS7 2HR |
| Templewood Court | SS7 2RH SS7 2RQ |
| The Avenue | SS7 2DJ SS7 2DL SS7 2HG |
| The Crescent | SS7 2HE SS7 2HF |
| The Endway | SS7 2AN |
| The Saltings | SS7 2BD |
| The Woods | SS7 2JF |
| Tylewood | SS7 2QH |
| Wilkinson Drop | SS7 2FA |
| Woodfield Road | SS7 2EH SS7 2EQ SS7 2ES SS7 2ET |
| Woodland Close | SS7 2JH |
Transport near St James
- FAQ
- Price Paid By Year
- Property Type Price
Frequently asked questions about St James
What is the average price for a property for sale in St James?
The average price for a property for sale in St James is £379,564. This amount is 8% lower than the average price in Benfleet. There are 1,175 property listings for sale in St James.
What streets have the most expensive properties for sale in St James?
The streets with the most expensive properties for sale in St James are Woodland Close at an average of £700,000, The Woods at an average of £698,625 and Greenacres at an average of £636,250.
What streets have the most affordable properties for sale in St James?
The streets with the most affordable properties for sale in St James are Benfleet Road at an average of £205,937, Oak Road South at an average of £224,125 and High Street at an average of £229,071.
Which train stations are available in or near St James?
Some of the train stations available in or near St James are Leigh-On-Sea, Benfleet and Rayleigh.
Property Price Paid in St James by Year
The average sold property price by year was:
| Year | Average Sold Price | Price Change |
Sold Properties
|
|---|---|---|---|
| 2025 | £397,076 | 2% |
111 Properties |
| 2024 | £387,850 | 9% |
100 Properties |
| 2023 | £354,128 | -4% |
109 Properties |
| 2022 | £367,986 | 5% |
132 Properties |
| 2021 | £349,647 | 3% |
175 Properties |
| 2020 | £338,857 | 5% |
125 Properties |
| 2019 | £321,216 | 4% |
127 Properties |
| 2018 | £308,460 | 1% |
132 Properties |
| 2017 | £304,116 | 8% |
131 Properties |
| 2016 | £279,261 | 7% |
132 Properties |
| 2015 | £259,407 | 11% |
168 Properties |
| 2014 | £231,519 | 8% |
149 Properties |
| 2013 | £213,345 | -7% |
138 Properties |
| 2012 | £227,682 | 3% |
93 Properties |
| 2011 | £221,599 | 1% |
110 Properties |
| 2010 | £220,399 | 10% |
122 Properties |
| 2009 | £197,484 | -9% |
102 Properties |
| 2008 | £216,033 | -1% |
103 Properties |
| 2007 | £218,035 | 9% |
170 Properties |
| 2006 | £198,061 | 4% |
195 Properties |
| 2005 | £189,194 | 7% |
155 Properties |
| 2004 | £176,416 | 6% |
211 Properties |
| 2003 | £165,828 | 20% |
152 Properties |
| 2002 | £132,984 | 9% |
177 Properties |
| 2001 | £121,065 | 22% |
155 Properties |
| 2000 | £93,837 | 10% |
172 Properties |
| 1999 | £84,507 | 14% |
156 Properties |
| 1998 | £72,878 | 0,2% |
126 Properties |
| 1997 | £72,719 | 9% |
148 Properties |
| 1996 | £66,085 | 11% |
155 Properties |
| 1995 | £58,675 | - |
122 Properties |
Property Price per Property Type in St James
Here you can find historic sold price data in order to help with your property search.
The average Property Paid Price for specific property types in the last three years are:
| Property Type | Average Sold Price | Sold Properties |
|---|---|---|
| Semi Detached House | £391,018.00 | 91 Semi Detached Houses |
| Detached House | £527,852.00 | 109 Detached Houses |
| Terraced House | £332,947.00 | 19 Terraced Houses |
| Flat | £217,978.00 | 101 Flats |

