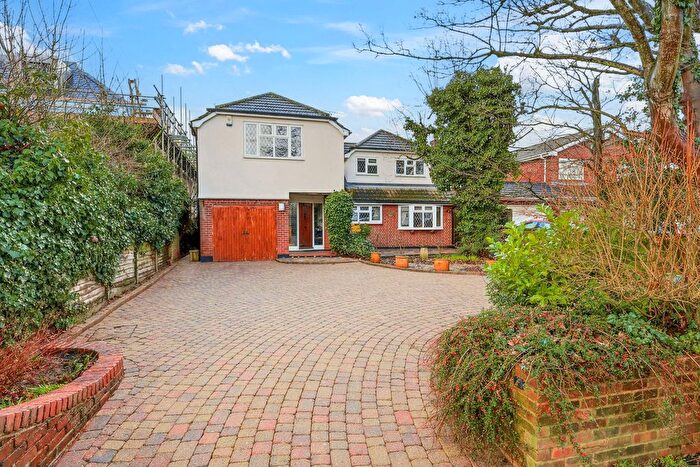
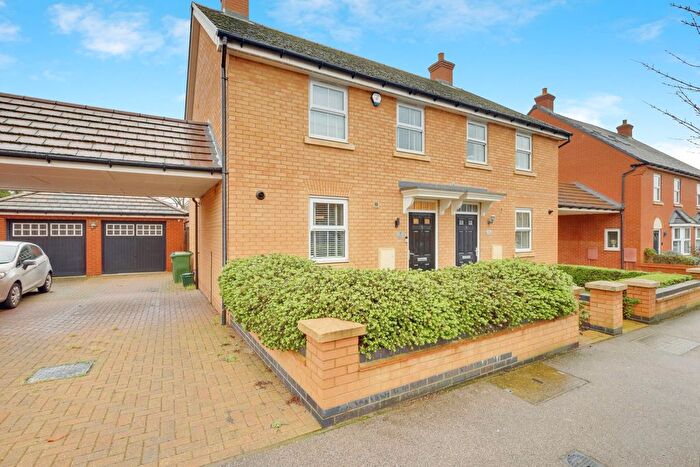
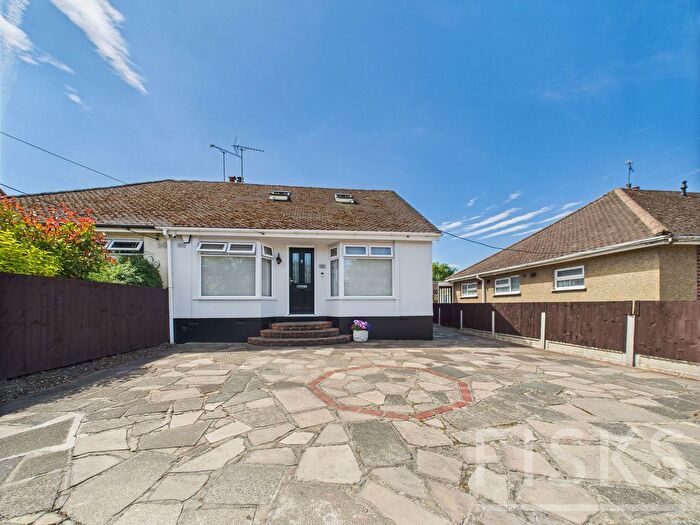
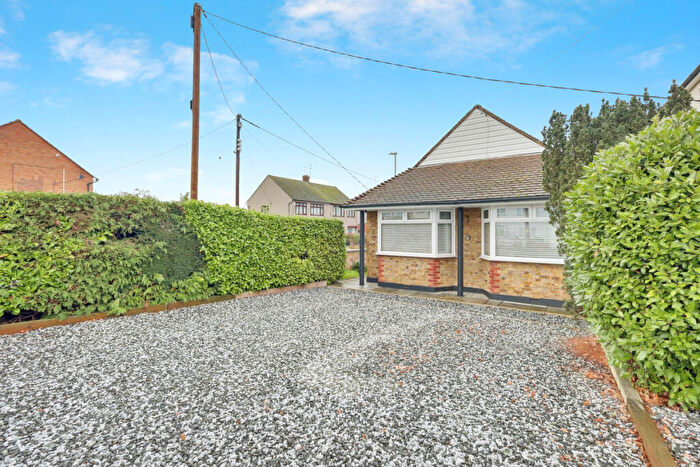
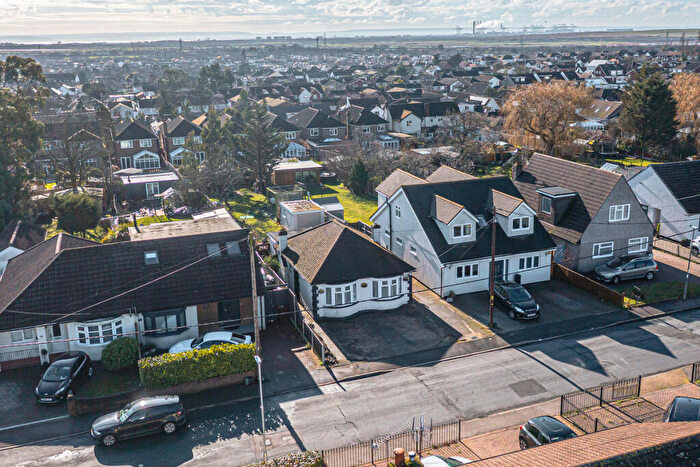
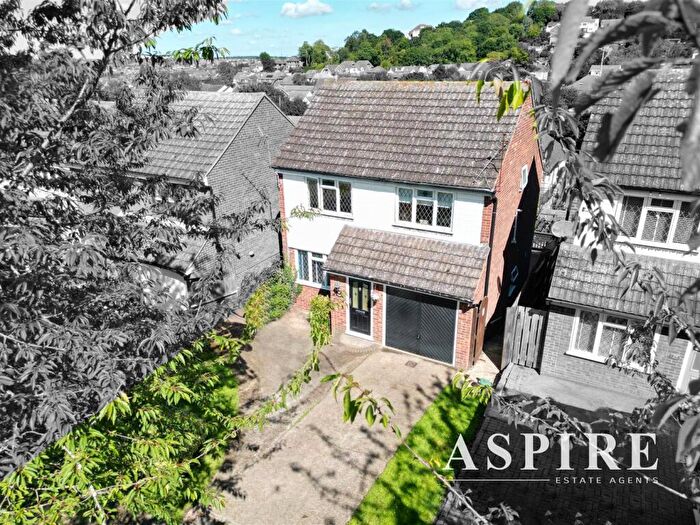
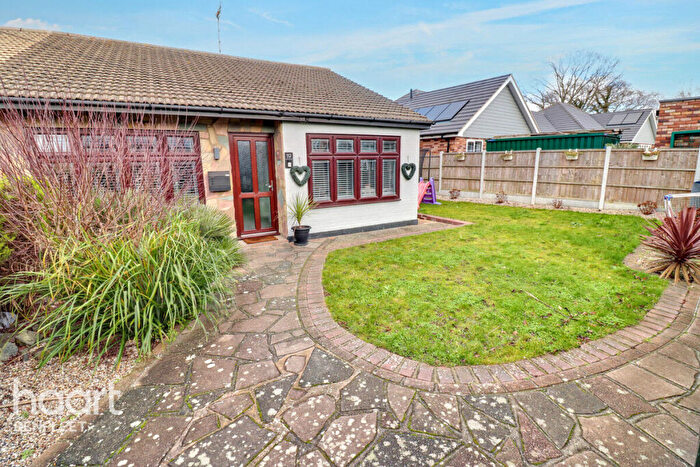
Houses for sale & to rent in Benfleet, Essex
House Prices in Benfleet
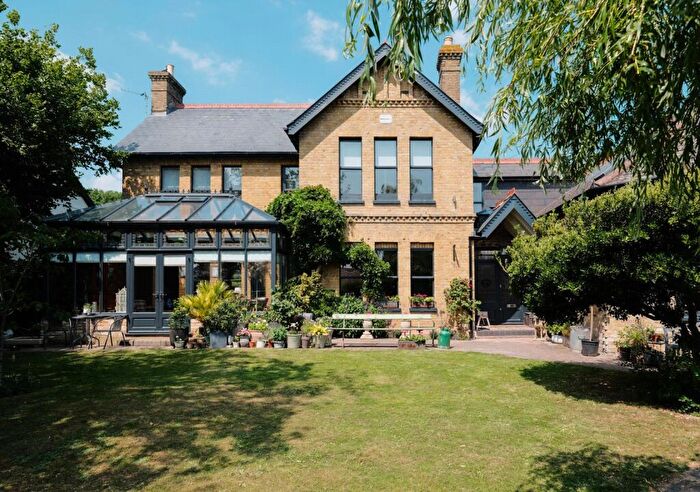
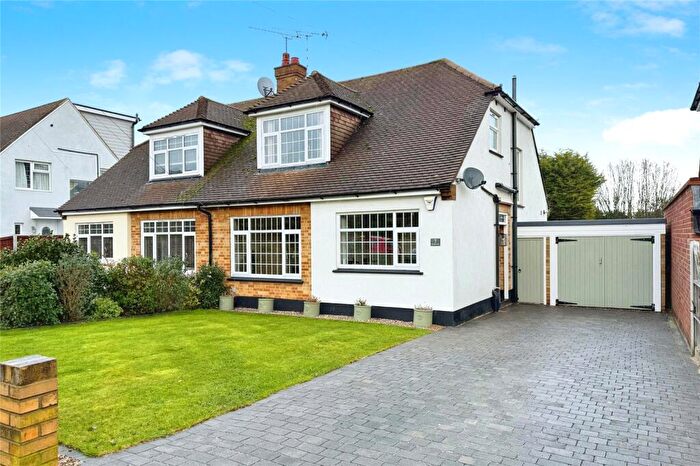
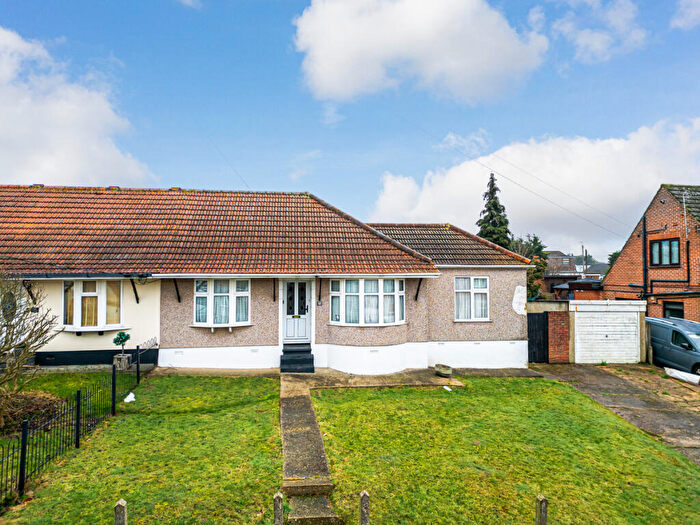
Properties in Benfleet have an average house price of £414,766.00 and had 1,994 Property Transactions within the last 3 years.¹
Benfleet is an area in Essex with 20,267 households², where the most expensive property was sold for £1,840,000.00.
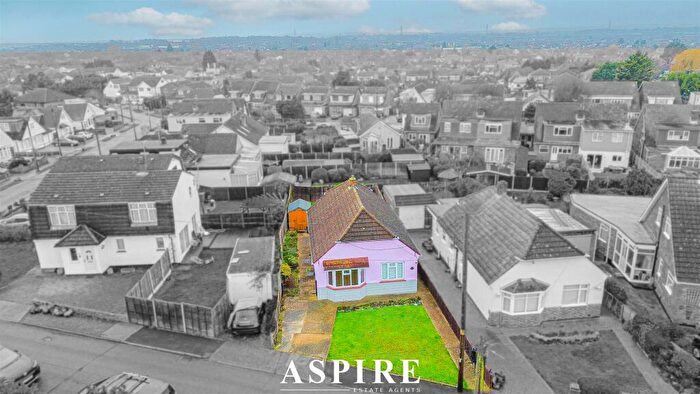
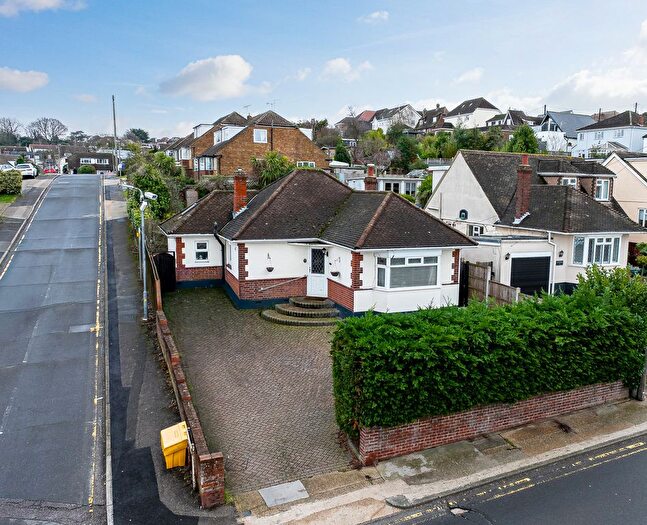
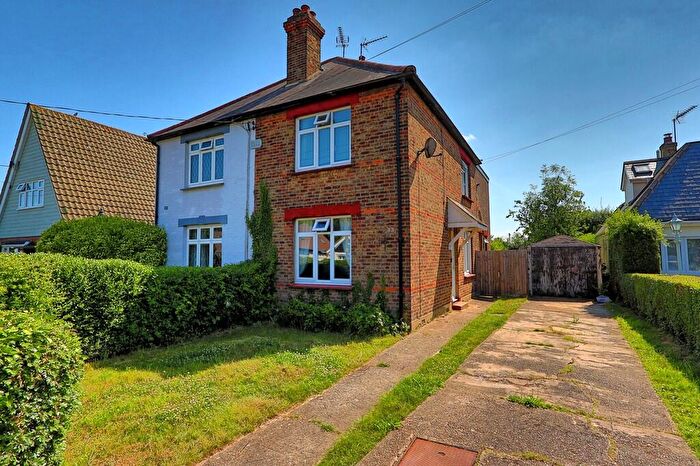
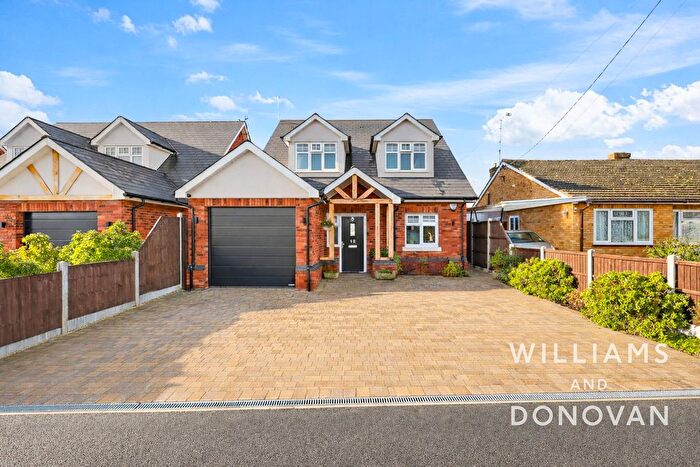
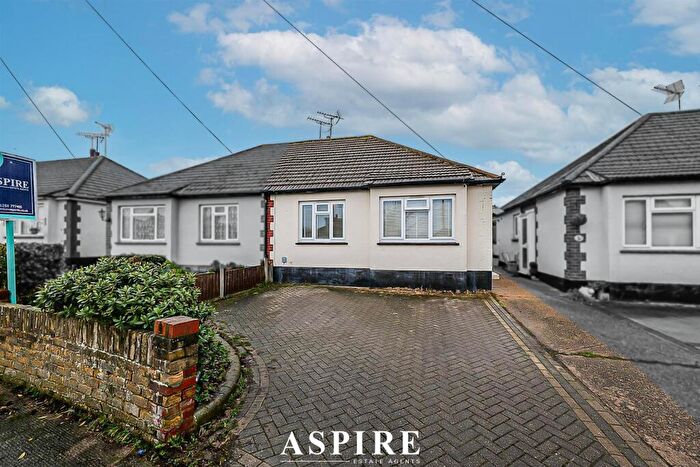
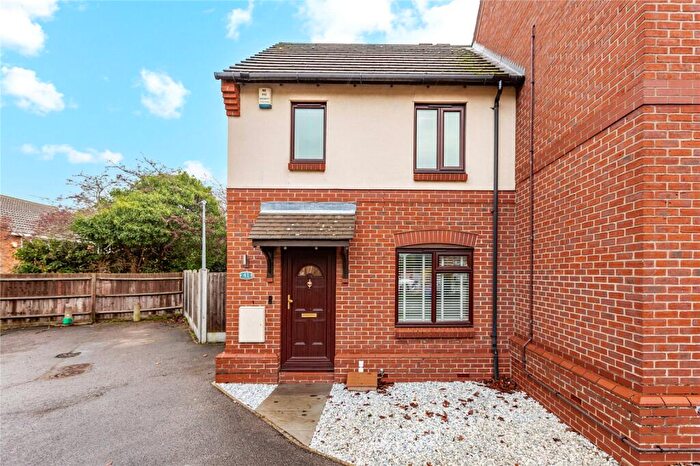
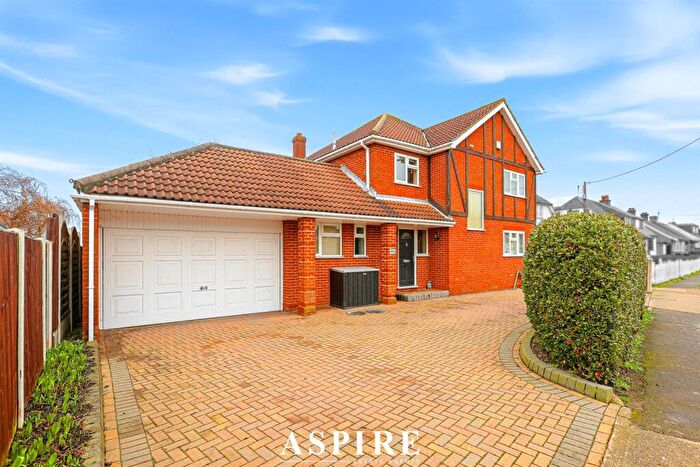
Properties for sale in Benfleet
Neighbourhoods in Benfleet
Navigate through our locations to find the location of your next house in Benfleet, Essex for sale or to rent.
Transport in Benfleet
Please see below transportation links in this area:
-
Benfleet Station
-
Rayleigh Station
-
Leigh-On-Sea Station
-
Pitsea Station
-
Chalkwell Station
-
Battlesbridge Station
-
Wickford Station
-
Hockley Station
- FAQ
- Price Paid By Year
- Property Type Price
Frequently asked questions about Benfleet
What is the average price for a property for sale in Benfleet?
The average price for a property for sale in Benfleet is £414,766. This amount is 2% higher than the average price in Essex. There are 8,250 property listings for sale in Benfleet.
What locations have the most expensive properties for sale in Benfleet?
The locations with the most expensive properties for sale in Benfleet are Boyce at an average of £496,783, Victoria at an average of £433,263 and Appleton at an average of £425,176.
What locations have the most affordable properties for sale in Benfleet?
The locations with the most affordable properties for sale in Benfleet are St Georges at an average of £373,431, St James at an average of £379,564 and St Marys at an average of £398,003.
Which train stations are available in or near Benfleet?
Some of the train stations available in or near Benfleet are Benfleet, Rayleigh and Leigh-On-Sea.
Property Price Paid in Benfleet by Year
The average sold property price by year was:
| Year | Average Sold Price | Price Change |
Sold Properties
|
|---|---|---|---|
| 2025 | £417,929 | 2% |
605 Properties |
| 2024 | £411,618 | -1% |
746 Properties |
| 2023 | £415,441 | -1% |
643 Properties |
| 2022 | £418,731 | 6% |
833 Properties |
| 2021 | £392,697 | 5% |
1,196 Properties |
| 2020 | £372,681 | 4% |
805 Properties |
| 2019 | £356,690 | 2% |
831 Properties |
| 2018 | £350,623 | -1% |
822 Properties |
| 2017 | £354,465 | 10% |
905 Properties |
| 2016 | £320,312 | 8% |
902 Properties |
| 2015 | £293,554 | 10% |
982 Properties |
| 2014 | £264,574 | 8% |
957 Properties |
| 2013 | £243,830 | 5% |
834 Properties |
| 2012 | £232,692 | 2% |
629 Properties |
| 2011 | £228,378 | -3% |
599 Properties |
| 2010 | £234,732 | 7% |
650 Properties |
| 2009 | £219,140 | -6% |
634 Properties |
| 2008 | £231,390 | -3% |
593 Properties |
| 2007 | £237,481 | 7% |
1,140 Properties |
| 2006 | £221,598 | 6% |
1,130 Properties |
| 2005 | £207,647 | 5% |
962 Properties |
| 2004 | £196,479 | 6% |
1,072 Properties |
| 2003 | £184,361 | 17% |
973 Properties |
| 2002 | £152,708 | 15% |
1,197 Properties |
| 2001 | £129,366 | 15% |
1,090 Properties |
| 2000 | £110,461 | 11% |
1,014 Properties |
| 1999 | £98,043 | 11% |
1,157 Properties |
| 1998 | £87,026 | 9% |
932 Properties |
| 1997 | £79,127 | 9% |
1,060 Properties |
| 1996 | £71,875 | 5% |
1,033 Properties |
| 1995 | £68,278 | - |
793 Properties |
Property Price per Property Type in Benfleet
Here you can find historic sold price data in order to help with your property search.
The average Property Paid Price for specific property types in the last three years are:
| Property Type | Average Sold Price | Sold Properties |
|---|---|---|
| Semi Detached House | £386,588.00 | 942 Semi Detached Houses |
| Terraced House | £344,644.00 | 144 Terraced Houses |
| Detached House | £552,560.00 | 645 Detached Houses |
| Flat | £216,146.00 | 263 Flats |

