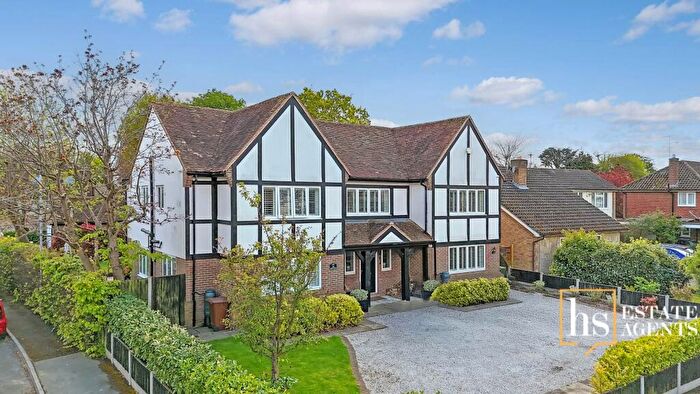
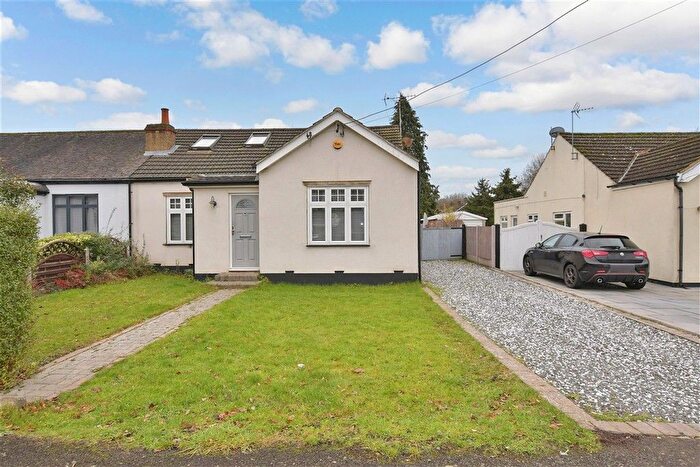
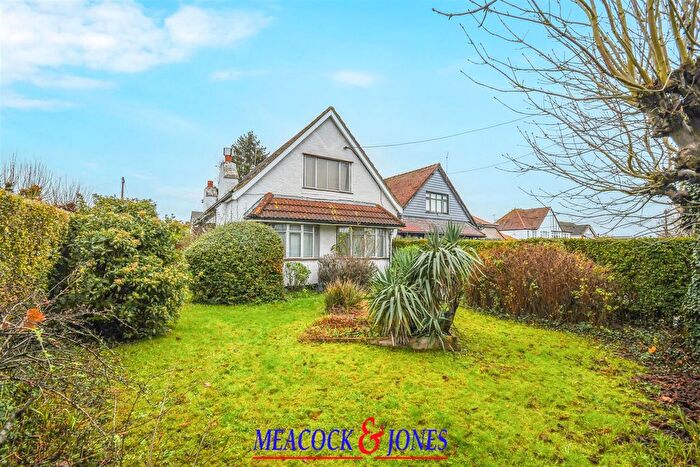
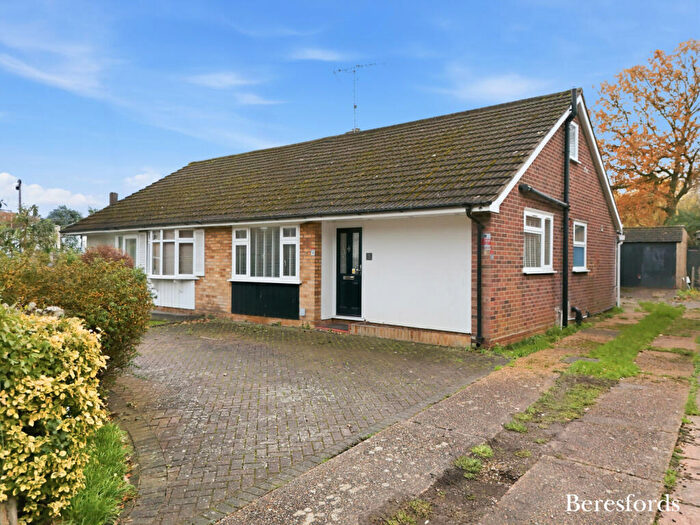
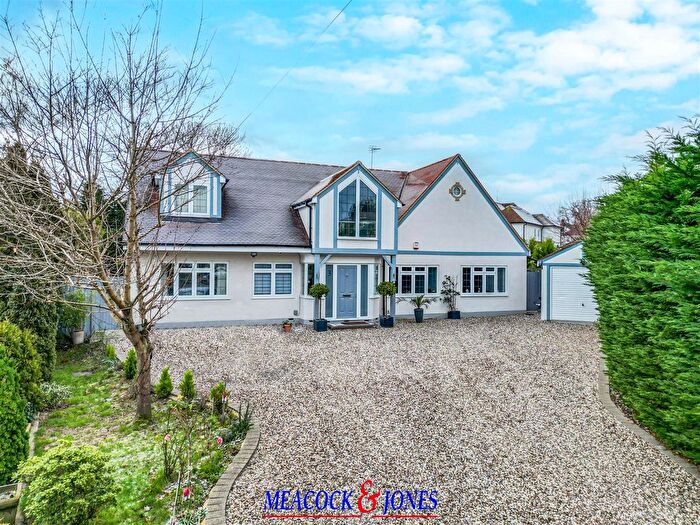
Houses for sale & to rent in Hutton Central, Brentwood
House Prices in Hutton Central
Properties in Hutton Central have an average house price of £717,867.00 and had 203 Property Transactions within the last 3 years¹.
Hutton Central is an area in Brentwood, Essex with 1,585 households², where the most expensive property was sold for £1,775,000.00.
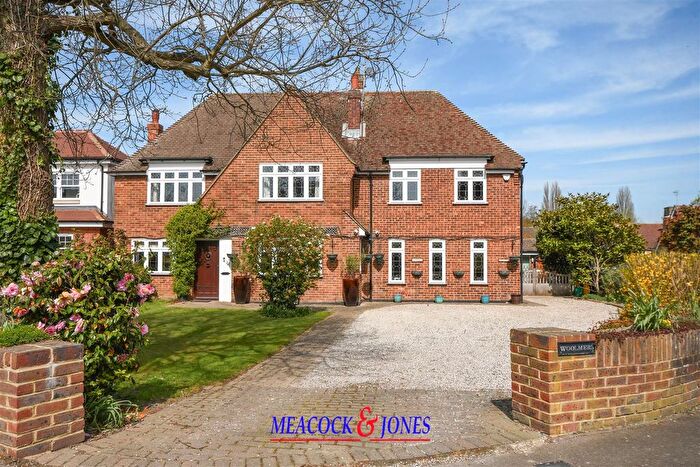
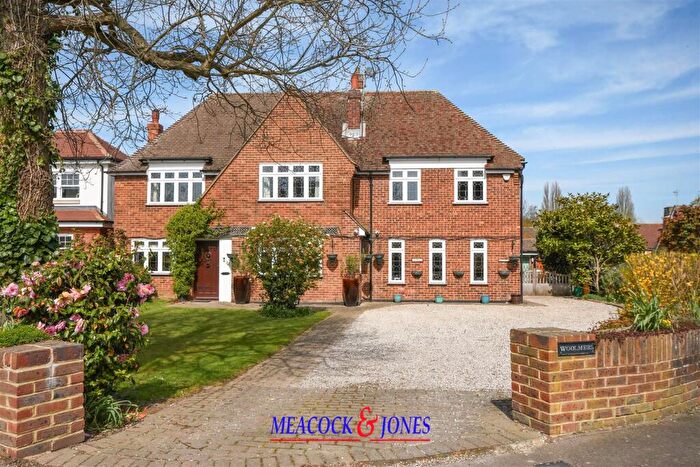
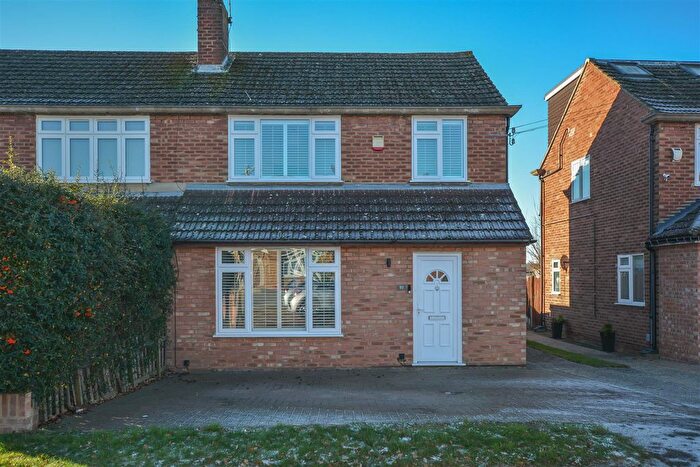
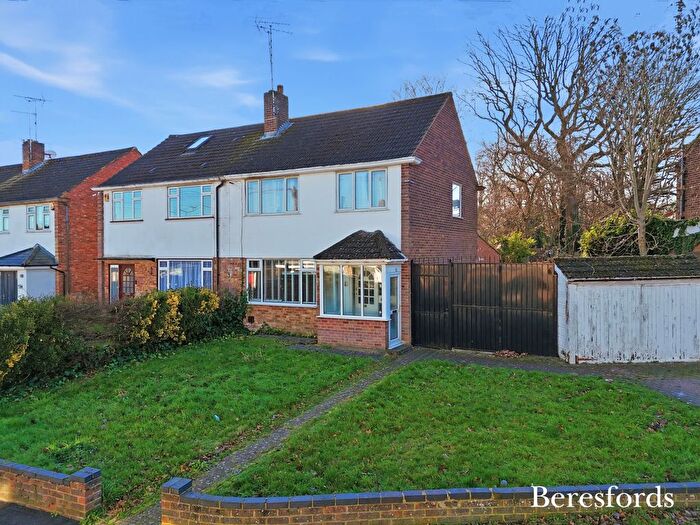
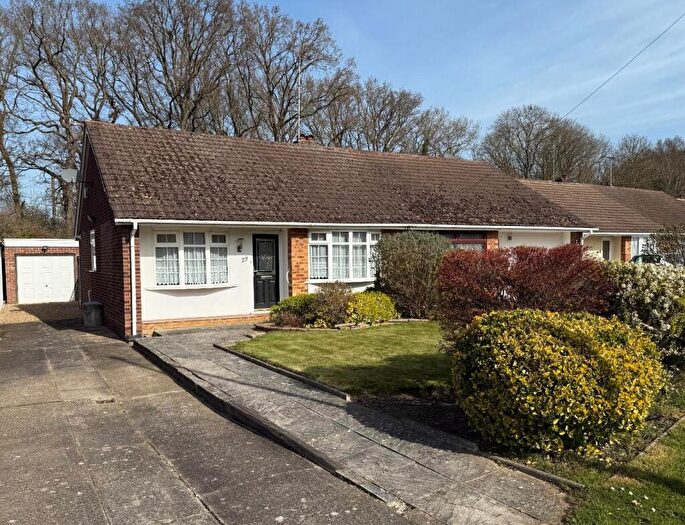
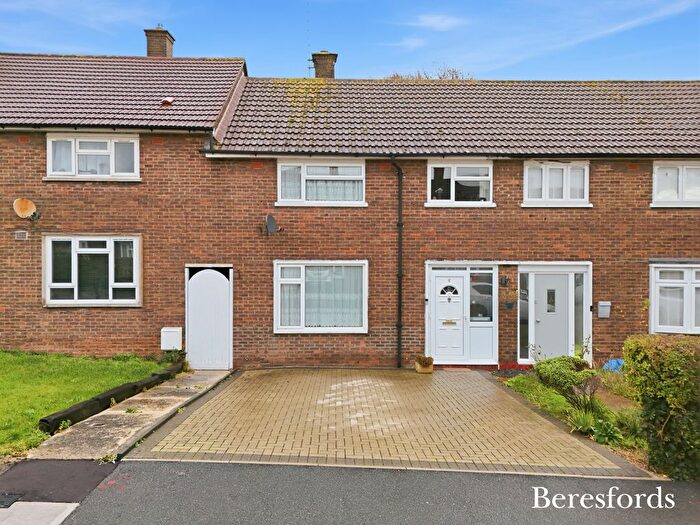
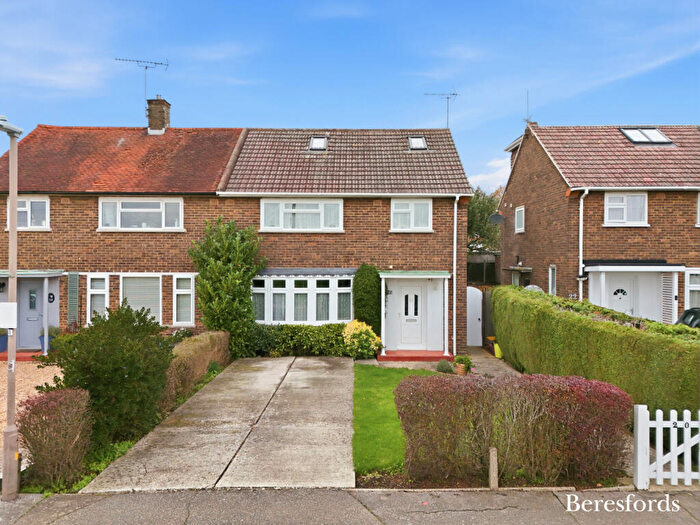
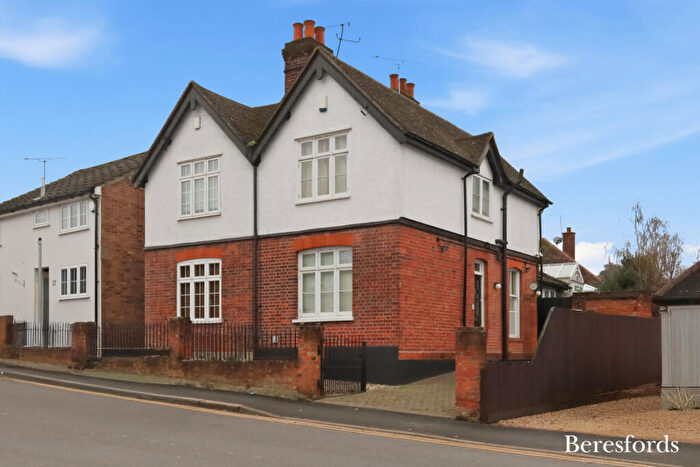
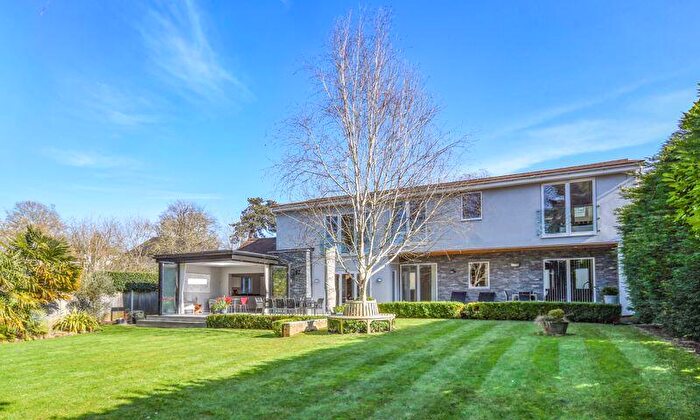
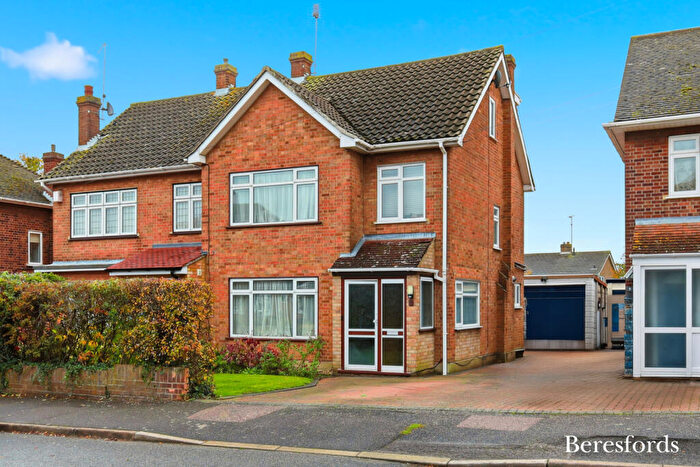
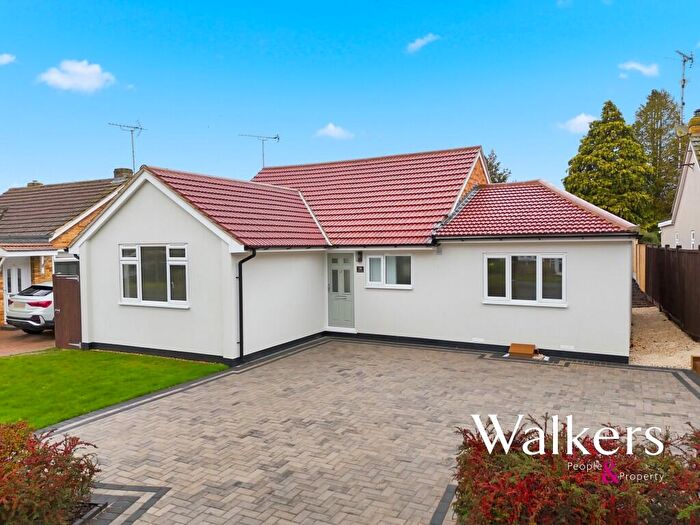
Properties for sale in Hutton Central
Roads and Postcodes in Hutton Central
Navigate through our locations to find the location of your next house in Hutton Central, Brentwood for sale or to rent.
| Streets | Postcodes |
|---|---|
| Alexander Lane | CM13 1AY |
| Bayleys Mead | CM13 2HL |
| Brindles Close | CM13 2HW |
| Brookfield Close | CM13 2RG |
| Burns Way | CM13 2SU |
| Burses Way | CM13 2PL CM13 2PS CM13 2PX |
| Byron Road | CM13 2RU CM13 2SA |
| Clifton Way | CM13 2QR |
| Coleridge Walk | CM13 2RT |
| Compton Avenue | CM13 2HH |
| Copeman Road | CM13 2RN |
| Cory Drive | CM13 2PT |
| Courage Walk | CM13 2TA |
| Darcy Close | CM13 2PY |
| Farm Close | CM13 2PN |
| Fawters Close | CM13 2SY |
| Gainsborough Place | CM13 2RF |
| Grays Walk | CM13 2RX |
| Great Oaks | CM13 1AZ |
| Hall Green Lane | CM13 2QT CM13 2QU CM13 2QX CM13 2RA |
| Hanging Hill Lane | CM13 2HE CM13 2HG CM13 2QE CM13 2QF CM13 2QG CM13 2QH CM13 2QJ |
| Hove Close | CM13 2JF |
| Hutton Drive | CM13 2RH CM13 2RJ CM13 2RL CM13 2RP CM13 2RQ CM13 2RW |
| Hutton Place | CM13 1HE |
| Janmead | CM13 2PU |
| Keats Walk | CM13 2RY |
| Kingsley Road | CM13 2RZ CM13 2SH |
| Larkin Close | CM13 2SL |
| Laurel Court | CM13 1XP |
| Leafy Way | CM13 2QW |
| Long Meadow | CM13 2HJ |
| Longfellow Drive | CM13 2QQ |
| Lordship Close | CM13 2QY |
| Lyndhurst Way | CM13 2QZ |
| Mills Way | CM13 2QN |
| Newlands Close | CM13 2SD |
| Newmans Drive | CM13 2PZ |
| Newmans Gate | CM13 2FB |
| Park Avenue | CM13 2QL CM13 2QP |
| Quennel Way | CM13 2RR |
| Quennell Way | CM13 2RS |
| Rayleigh Close | CM13 1AR CM13 1FD CM13 1FF |
| Rayleigh Road | CM13 1AB CM13 1AD CM13 1AE CM13 1AF CM13 1AJ CM13 1AP CM13 1AT CM13 1AU CM13 1AX CM13 1BA CM13 1LX CM13 1LY CM13 1LZ |
| Reubens Road | CM13 1BE |
| Rosen Crescent | CM13 2TU |
| Shelley Road | CM13 2SE CM13 2SF |
| St Georges Court | CM13 2QD |
| St Martins Close | CM13 2HQ |
| Surman Crescent | CM13 2PP CM13 2PW |
| Tennyson Road | CM13 2SG CM13 2SJ |
| The Retreat | CM13 1AN |
| The Spinney | CM13 1AS |
| The Tyburns | CM13 2JD |
| Wainwright Avenue | CM13 2SR CM13 2SS CM13 2ST CM13 2SX CM13 2SZ CM13 2FA |
| Weston Close | CM13 2PR |
| Windy Hill | CM13 2HF |
| Yew Tree Close | CM13 1AH |
Transport near Hutton Central
- FAQ
- Price Paid By Year
- Property Type Price
Frequently asked questions about Hutton Central
What is the average price for a property for sale in Hutton Central?
The average price for a property for sale in Hutton Central is £717,867. This amount is 29% higher than the average price in Brentwood. There are 1,643 property listings for sale in Hutton Central.
What streets have the most expensive properties for sale in Hutton Central?
The streets with the most expensive properties for sale in Hutton Central are Hove Close at an average of £1,440,000, Park Avenue at an average of £1,208,333 and Janmead at an average of £1,190,750.
What streets have the most affordable properties for sale in Hutton Central?
The streets with the most affordable properties for sale in Hutton Central are Laurel Court at an average of £340,000, Courage Walk at an average of £343,750 and Rosen Crescent at an average of £366,356.
Which train stations are available in or near Hutton Central?
Some of the train stations available in or near Hutton Central are Shenfield and Brentwood.
Property Price Paid in Hutton Central by Year
The average sold property price by year was:
| Year | Average Sold Price | Price Change |
Sold Properties
|
|---|---|---|---|
| 2025 | £608,000 | -21% |
32 Properties |
| 2024 | £733,779 | -10% |
49 Properties |
| 2023 | £804,620 | 14% |
50 Properties |
| 2022 | £695,624 | -12% |
72 Properties |
| 2021 | £777,347 | 10% |
78 Properties |
| 2020 | £701,683 | 3% |
57 Properties |
| 2019 | £679,256 | -0,3% |
59 Properties |
| 2018 | £681,611 | 6% |
54 Properties |
| 2017 | £640,952 | 9% |
53 Properties |
| 2016 | £585,176 | 15% |
49 Properties |
| 2015 | £498,147 | 4% |
77 Properties |
| 2014 | £475,807 | 12% |
91 Properties |
| 2013 | £421,025 | -7% |
64 Properties |
| 2012 | £449,924 | -10% |
54 Properties |
| 2011 | £496,138 | 3% |
36 Properties |
| 2010 | £482,760 | 1% |
48 Properties |
| 2009 | £478,880 | 10% |
46 Properties |
| 2008 | £430,651 | 6% |
33 Properties |
| 2007 | £403,162 | 3% |
84 Properties |
| 2006 | £392,790 | 2% |
70 Properties |
| 2005 | £383,822 | 5% |
72 Properties |
| 2004 | £365,618 | 6% |
76 Properties |
| 2003 | £345,235 | 18% |
58 Properties |
| 2002 | £281,961 | 16% |
73 Properties |
| 2001 | £237,178 | -4% |
67 Properties |
| 2000 | £246,463 | 22% |
65 Properties |
| 1999 | £191,593 | 8% |
83 Properties |
| 1998 | £177,074 | 16% |
66 Properties |
| 1997 | £147,962 | 18% |
73 Properties |
| 1996 | £120,849 | -36% |
51 Properties |
| 1995 | £164,038 | - |
65 Properties |
Property Price per Property Type in Hutton Central
Here you can find historic sold price data in order to help with your property search.
The average Property Paid Price for specific property types in the last three years are:
| Property Type | Average Sold Price | Sold Properties |
|---|---|---|
| Semi Detached House | £579,956.00 | 42 Semi Detached Houses |
| Detached House | £966,634.00 | 104 Detached Houses |
| Terraced House | £427,941.00 | 34 Terraced Houses |
| Flat | £273,436.00 | 23 Flats |

