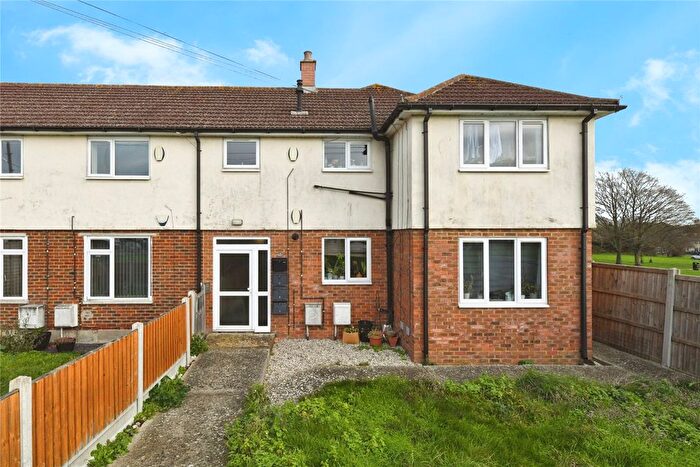
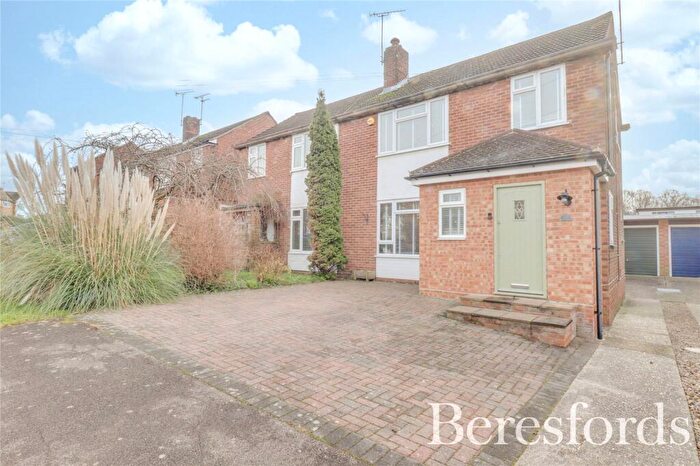
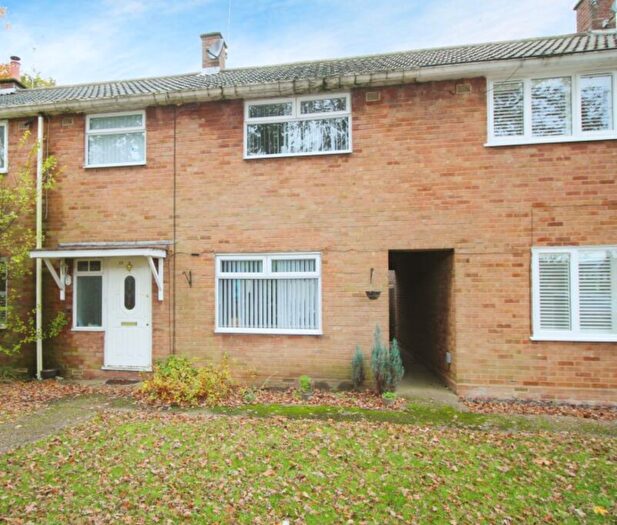
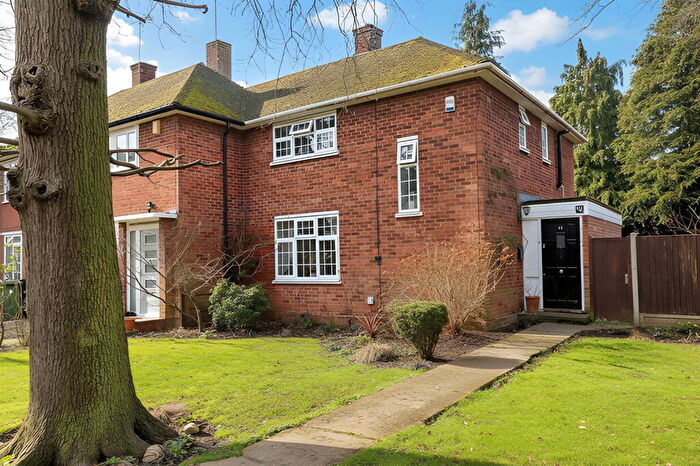
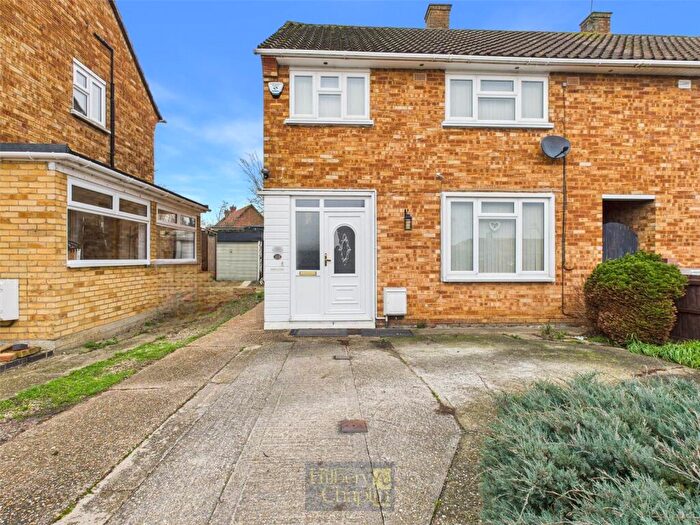
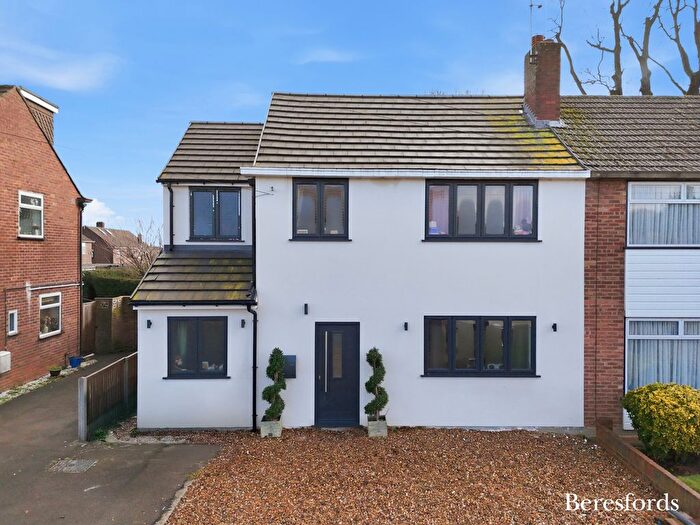
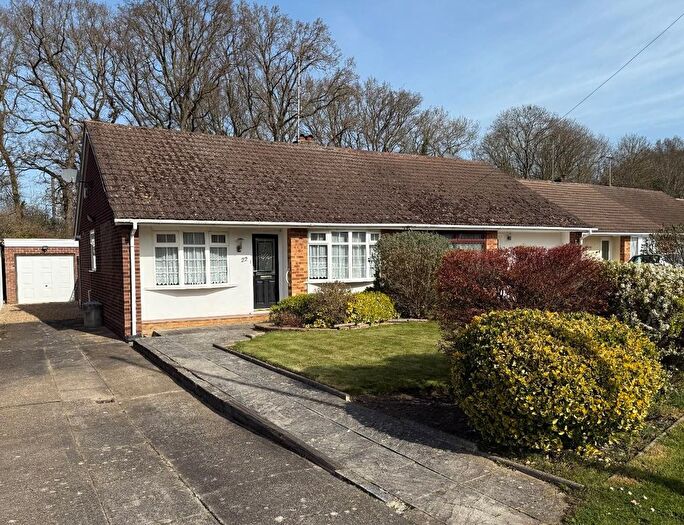
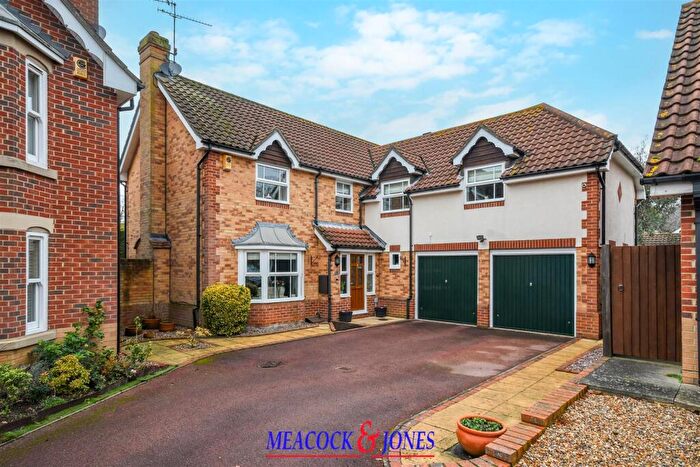
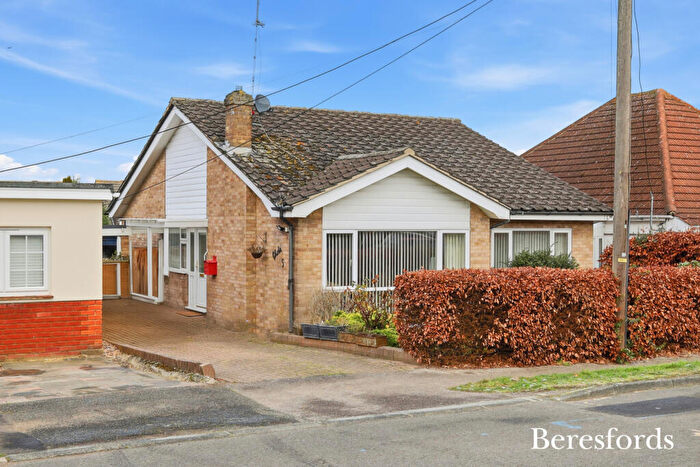
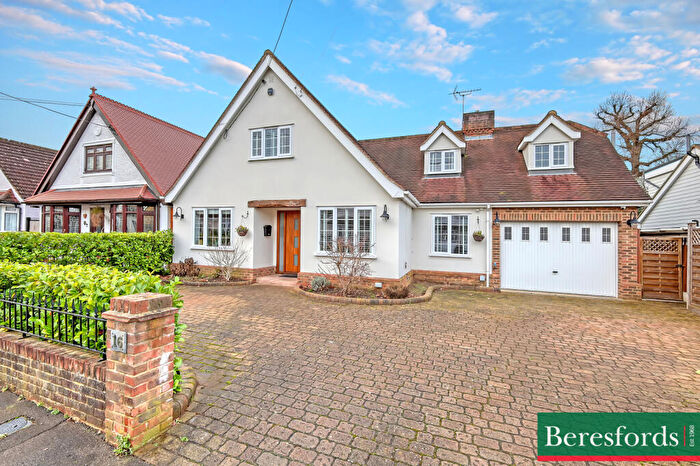
Houses for sale & to rent in Hutton North, Brentwood
House Prices in Hutton North
Properties in Hutton North have an average house price of £509,419.00 and had 181 Property Transactions within the last 3 years¹.
Hutton North is an area in Brentwood, Essex with 1,762 households², where the most expensive property was sold for £1,800,000.00.
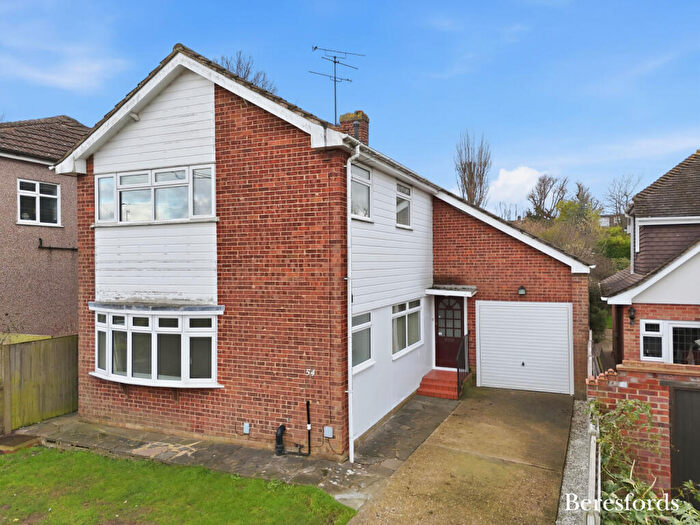
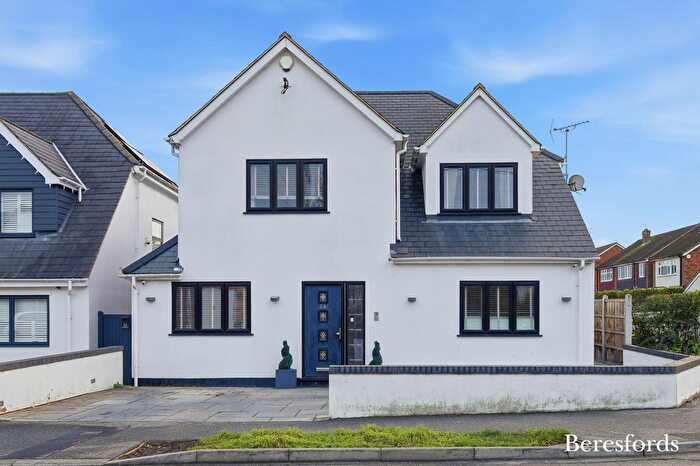
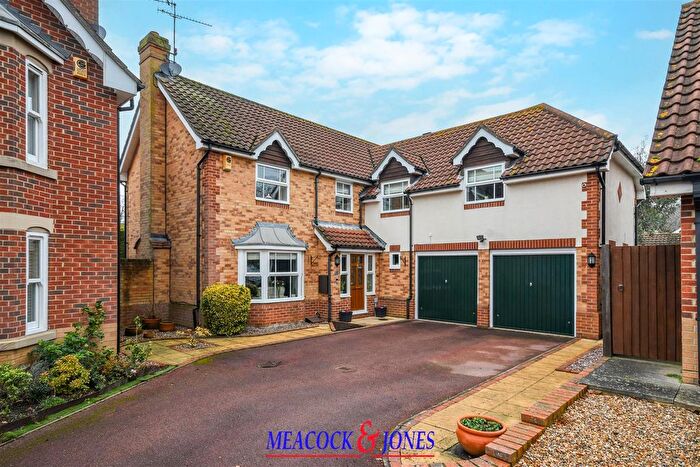
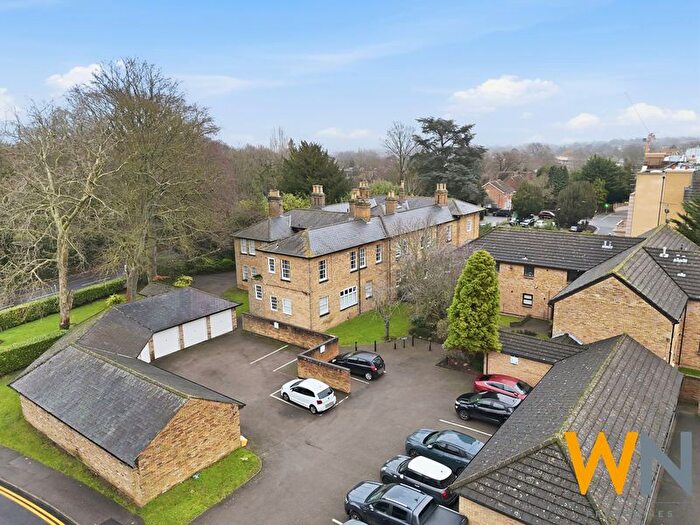
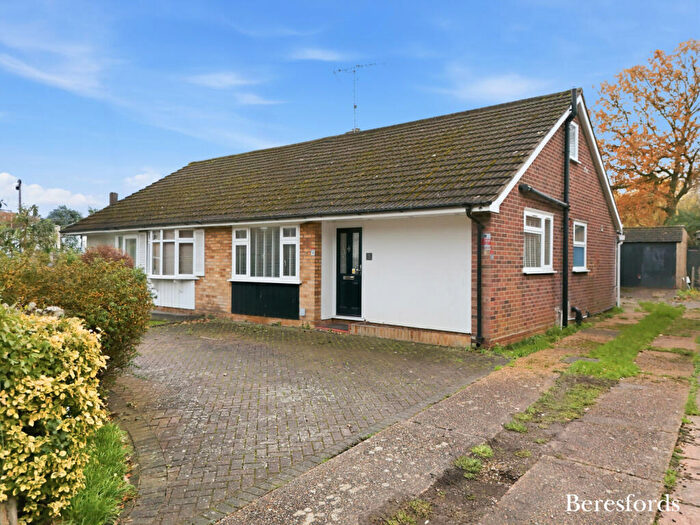
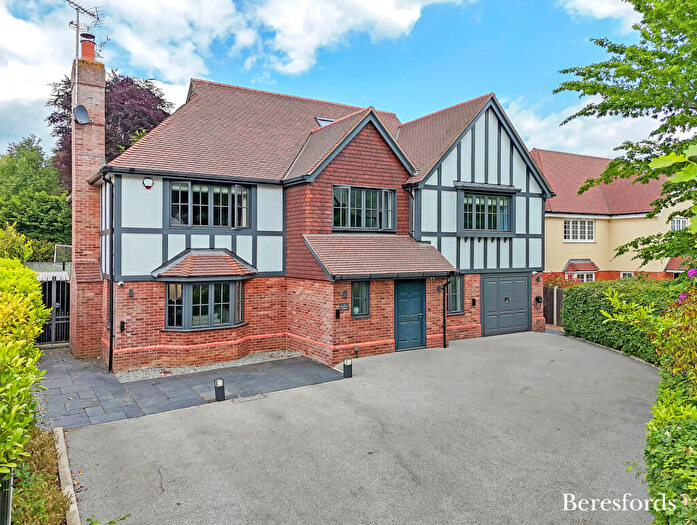
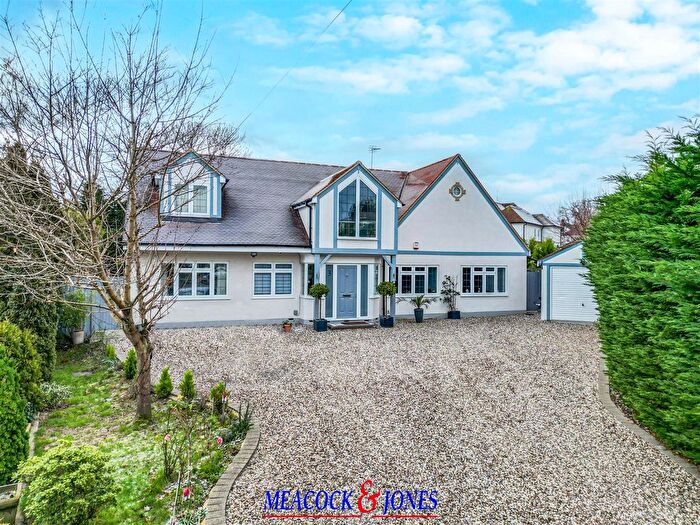
Properties for sale in Hutton North
Roads and Postcodes in Hutton North
Navigate through our locations to find the location of your next house in Hutton North, Brentwood for sale or to rent.
Transport near Hutton North
- FAQ
- Price Paid By Year
- Property Type Price
Frequently asked questions about Hutton North
What is the average price for a property for sale in Hutton North?
The average price for a property for sale in Hutton North is £509,419. This amount is 9% lower than the average price in Brentwood. There are 1,499 property listings for sale in Hutton North.
What streets have the most expensive properties for sale in Hutton North?
The streets with the most expensive properties for sale in Hutton North are Broxted Mews at an average of £1,012,500, Wenham Gardens at an average of £969,000 and Alexander Lane at an average of £941,200.
What streets have the most affordable properties for sale in Hutton North?
The streets with the most affordable properties for sale in Hutton North are Barnston Way at an average of £207,500, Hawksmoor Green at an average of £291,500 and Coram Green at an average of £369,687.
Which train stations are available in or near Hutton North?
Some of the train stations available in or near Hutton North are Shenfield, Brentwood and Ingatestone.
Property Price Paid in Hutton North by Year
The average sold property price by year was:
| Year | Average Sold Price | Price Change |
Sold Properties
|
|---|---|---|---|
| 2025 | £530,847 | 8% |
59 Properties |
| 2024 | £490,266 | -4% |
72 Properties |
| 2023 | £511,715 | 5% |
50 Properties |
| 2022 | £484,243 | -1% |
79 Properties |
| 2021 | £490,892 | 4% |
108 Properties |
| 2020 | £469,800 | 6% |
68 Properties |
| 2019 | £442,447 | 6% |
53 Properties |
| 2018 | £417,914 | -0,1% |
62 Properties |
| 2017 | £418,386 | 3% |
59 Properties |
| 2016 | £405,390 | 15% |
65 Properties |
| 2015 | £343,460 | 8% |
68 Properties |
| 2014 | £317,268 | 6% |
67 Properties |
| 2013 | £298,192 | 6% |
72 Properties |
| 2012 | £279,152 | 1% |
68 Properties |
| 2011 | £275,300 | -10% |
57 Properties |
| 2010 | £303,205 | 12% |
48 Properties |
| 2009 | £266,529 | -3% |
47 Properties |
| 2008 | £273,888 | 4% |
36 Properties |
| 2007 | £262,303 | 3% |
95 Properties |
| 2006 | £254,414 | -1% |
97 Properties |
| 2005 | £255,975 | 6% |
65 Properties |
| 2004 | £241,059 | 11% |
86 Properties |
| 2003 | £214,281 | 17% |
80 Properties |
| 2002 | £178,683 | 9% |
77 Properties |
| 2001 | £162,320 | 14% |
83 Properties |
| 2000 | £139,229 | 14% |
75 Properties |
| 1999 | £120,066 | 5% |
93 Properties |
| 1998 | £113,490 | 16% |
80 Properties |
| 1997 | £94,948 | -3% |
103 Properties |
| 1996 | £97,449 | 12% |
98 Properties |
| 1995 | £85,569 | - |
54 Properties |
Property Price per Property Type in Hutton North
Here you can find historic sold price data in order to help with your property search.
The average Property Paid Price for specific property types in the last three years are:
| Property Type | Average Sold Price | Sold Properties |
|---|---|---|
| Semi Detached House | £492,297.00 | 84 Semi Detached Houses |
| Detached House | £729,078.00 | 38 Detached Houses |
| Terraced House | £416,000.00 | 42 Terraced Houses |
| Flat | £333,823.00 | 17 Flats |

