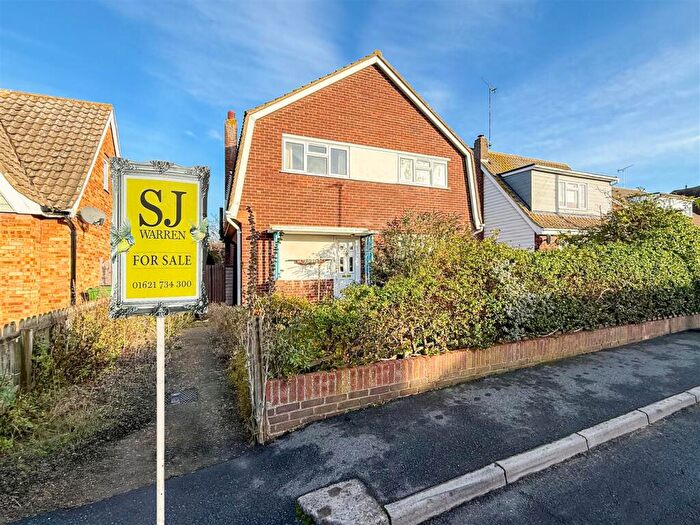
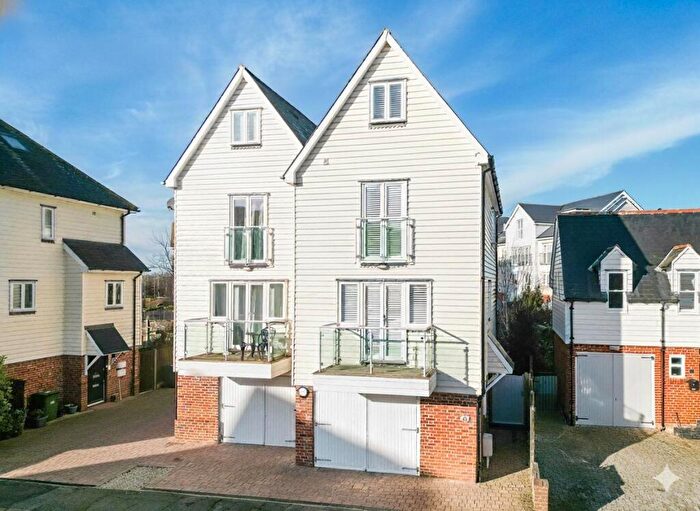
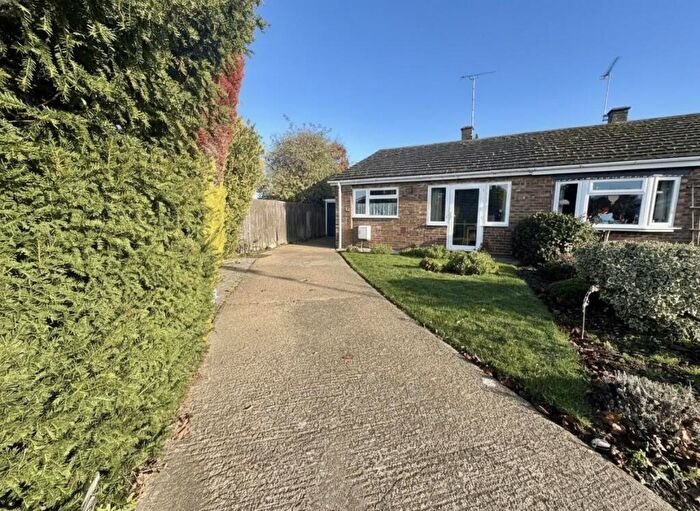
Houses for sale & to rent in Burnham-on-crouch South, Burnham-on-crouch
House Prices in Burnham-on-crouch South
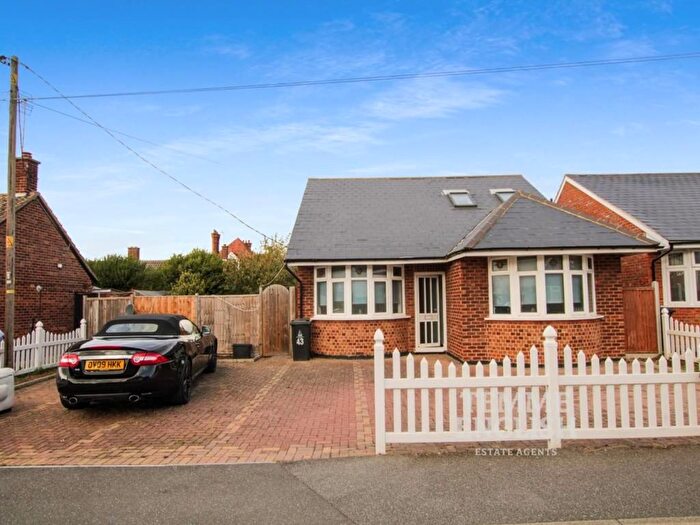
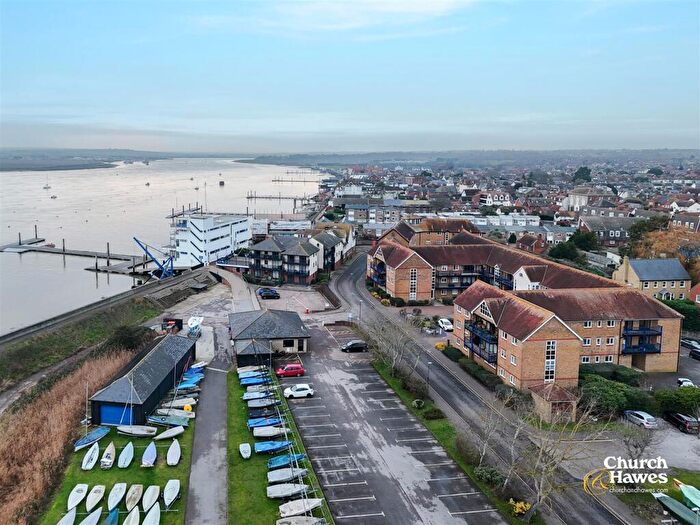
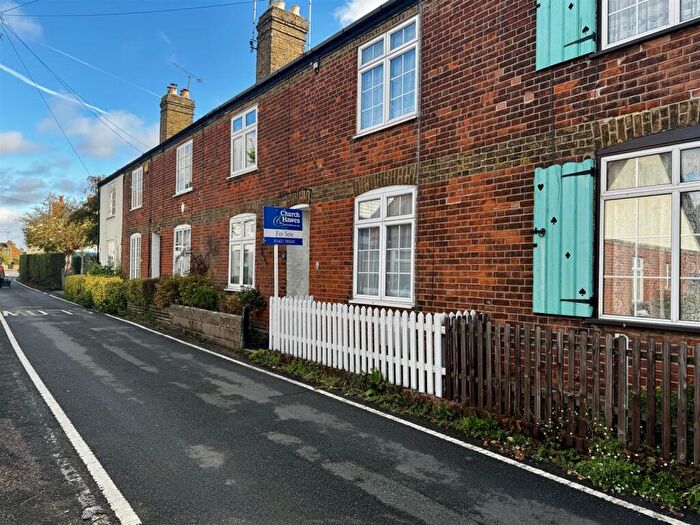
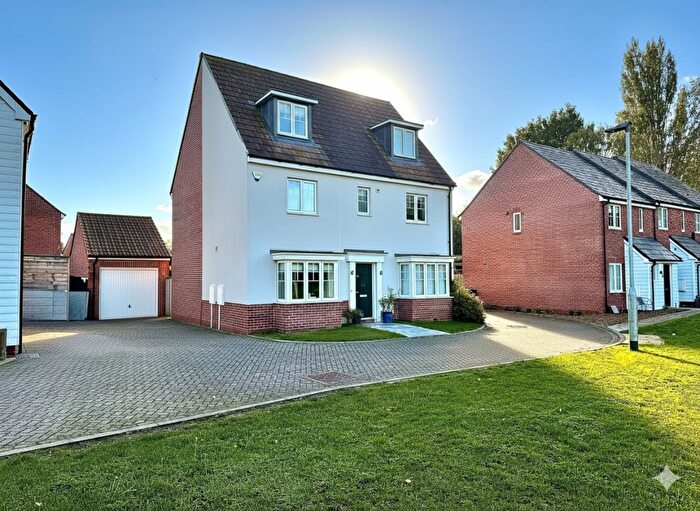
Properties in Burnham-on-crouch South have an average house price of £332,679.00 and had 199 Property Transactions within the last 3 years¹.
Burnham-on-crouch South is an area in Burnham-on-crouch, Essex with 1,927 households², where the most expensive property was sold for £875,000.00.
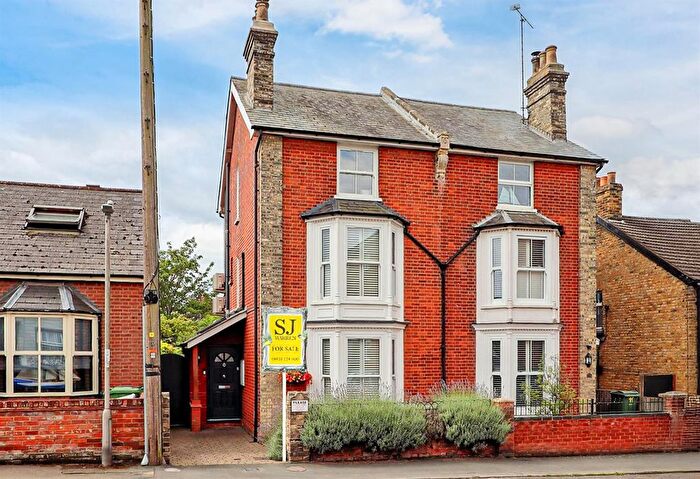
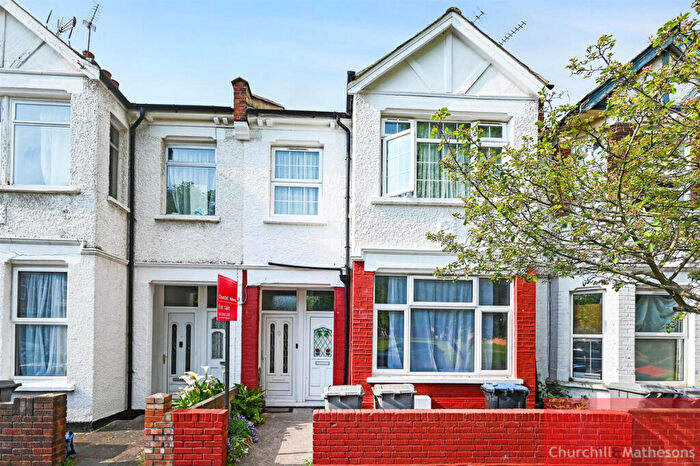
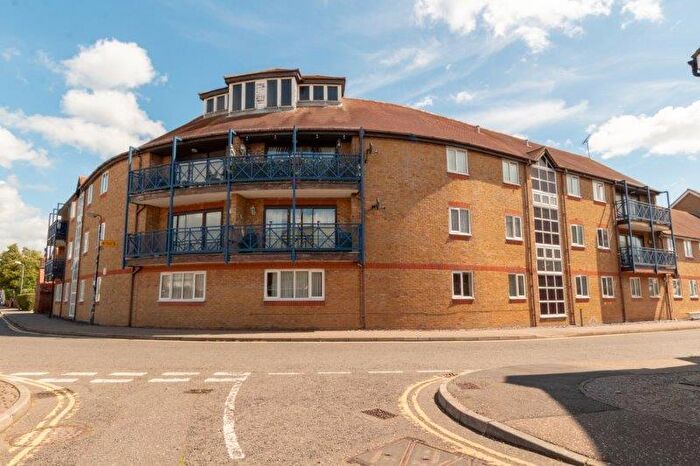
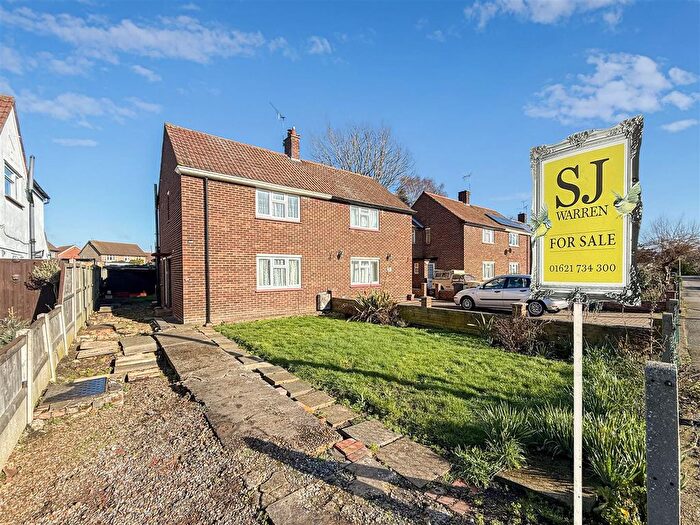
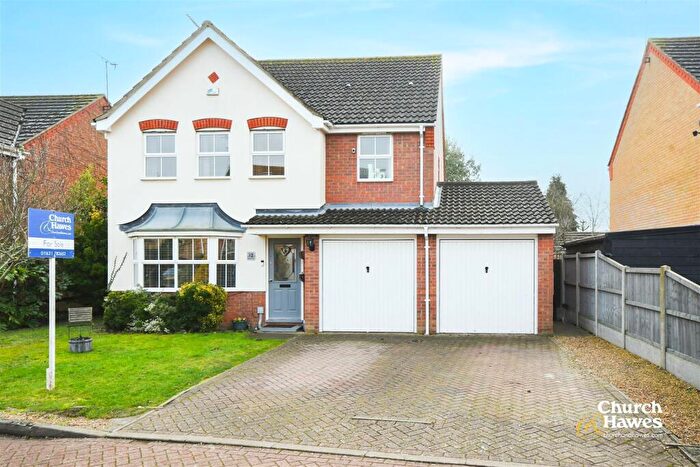
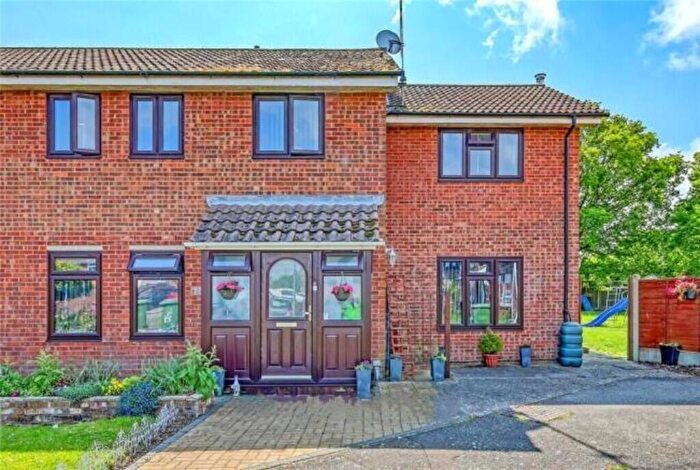
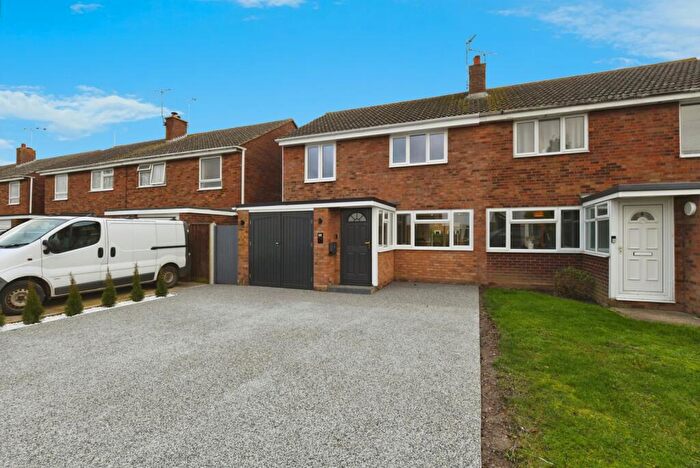
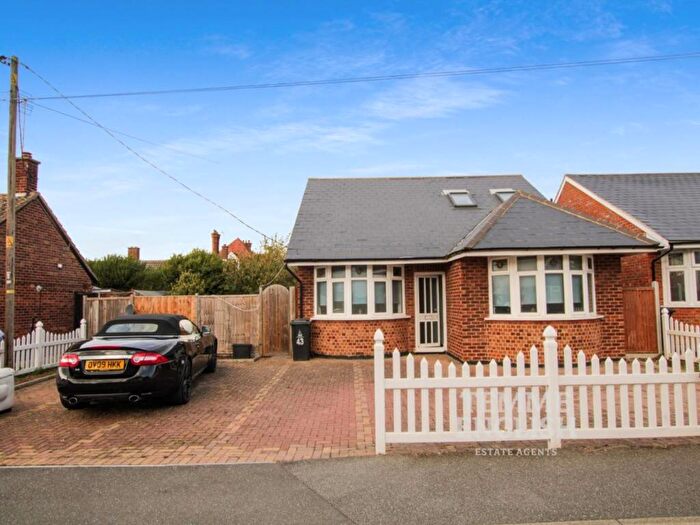
Properties for sale in Burnham-on-crouch South
Roads and Postcodes in Burnham-on-crouch South
Navigate through our locations to find the location of your next house in Burnham-on-crouch South, Burnham-on-crouch for sale or to rent.
| Streets | Postcodes |
|---|---|
| Alamein Road | CM0 8GH CM0 8JH |
| Albert Road | CM0 8DZ CM0 8EA |
| Alpha Road | CM0 8DU |
| Arcadia Road | CM0 8EF |
| Argyle Road | CM0 8JZ |
| Arnheim Road | CM0 8LE |
| Belvedere Court | CM0 8AP |
| Belvedere Road | CM0 8AJ |
| Booth Place | CM0 8RX |
| Brickwall Close | CM0 8HB |
| Chapel Road | CM0 8JA CM0 8JB CM0 8JD CM0 8HX |
| Coronation Road | CM0 8HW |
| Crouch Road | CM0 8DX |
| Dorset Road | CM0 8EB |
| Dragon Close | CM0 8PW |
| Dunkirk Road | CM0 8LF CM0 8LG |
| Essex Road | CM0 8EQ |
| Fairway Drive | CM0 8PN |
| Falklands Road | CM0 8SN |
| Fernlea Road | CM0 8EJ CM0 8EX |
| Foundry Lane | CM0 8BL CM0 8SJ |
| Galahad Close | CM0 8EP |
| Granville Terrace | CM0 8JT |
| Hardings Reach | CM0 8LL |
| Hermes Drive | CM0 8SW |
| High Street | CM0 8AA CM0 8AG CM0 8AH CM0 8BD CM0 8BE CM0 8RR |
| Hillside Road | CM0 8EY |
| Hornet Way | CM0 8EW |
| Kings Road | CM0 8PP CM0 8RP |
| Leslie Park | CM0 8SY CM0 8SZ |
| Lilian Road | CM0 8DS CM0 8DT |
| Mildmay Industrial Estate | CM0 8SH |
| Mildmay Road | CM0 8ED |
| Mill Green | CM0 8HT |
| New Road | CM0 8EH CM0 8EU |
| Normandy Avenue | CM0 8JJ CM0 8JR |
| Orchard Road | CM0 8JL CM0 8JN CM0 8JQ CM0 8LB CM0 8LD |
| Oyster Close | CM0 8GL |
| Park Road | CM0 8ER CM0 8ES |
| Providence | CM0 8JU |
| Queens Road | CM0 8DY |
| Ramblers Way | CM0 8LR |
| Rememberance Avenue | CM0 8HA |
| Riverside Road | CM0 8GZ CM0 8JY CM0 8TG |
| Sea End Boat House | CM0 8AN |
| Sheerwater Close | CM0 8EN |
| Ship Road | CM0 8JX |
| Shore Road | CM0 8AR |
| Silver Road | CM0 8LA |
| Station Industrial Estate | CM0 8RW |
| Station Road | CM0 8BQ CM0 8HF CM0 8HJ CM0 8HQ CM0 8HR CM0 8EZ CM0 8HH CM0 8HS |
| Sunnymead | CM0 8LQ |
| The Belvedere | CM0 8AW |
| The Quay | CM0 8AS CM0 8AT CM0 8AU CM0 8AX |
| Wayfarer Gardens | CM0 8HL |
| West Ley | CM0 8LH |
| Western Road | CM0 8HY CM0 8JE CM0 8JF CM0 8JG |
| Wick Road | CM0 8LP CM0 8LS CM0 8FA CM0 8LT CM0 8LU |
| Winstree Road | CM0 8ET |
| Witney Road | CM0 8JS |
| York Road | CM0 8HP |
| CM0 8AB CM0 8GG CM0 8WW CM0 8XB CM0 8XH CM0 8XJ CM0 8XL CM0 8YU |
Transport near Burnham-on-crouch South
- FAQ
- Price Paid By Year
- Property Type Price
Frequently asked questions about Burnham-on-crouch South
What is the average price for a property for sale in Burnham-on-crouch South?
The average price for a property for sale in Burnham-on-crouch South is £332,679. This amount is 12% lower than the average price in Burnham-on-crouch. There are 653 property listings for sale in Burnham-on-crouch South.
What streets have the most expensive properties for sale in Burnham-on-crouch South?
The streets with the most expensive properties for sale in Burnham-on-crouch South are Dragon Close at an average of £677,500, Rememberance Avenue at an average of £636,000 and Oyster Close at an average of £570,000.
What streets have the most affordable properties for sale in Burnham-on-crouch South?
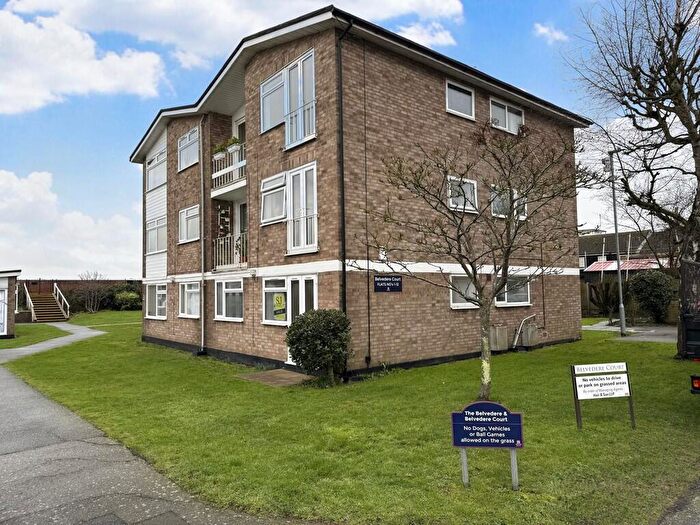
The streets with the most affordable properties for sale in Burnham-on-crouch South are Mill Green at an average of £174,500, Belvedere Court at an average of £216,000 and New Road at an average of £216,000.
Which train stations are available in or near Burnham-on-crouch South?
Some of the train stations available in or near Burnham-on-crouch South are Burnham-On-Crouch, Southminster and Althorne.
Property Price Paid in Burnham-on-crouch South by Year
The average sold property price by year was:
| Year | Average Sold Price | Price Change |
Sold Properties
|
|---|---|---|---|
| 2025 | £306,636 | -12% |
53 Properties |
| 2024 | £344,214 | 1% |
79 Properties |
| 2023 | £339,679 | -6% |
67 Properties |
| 2022 | £361,490 | 15% |
70 Properties |
| 2021 | £308,766 | 3% |
96 Properties |
| 2020 | £297,973 | -2% |
90 Properties |
| 2019 | £303,047 | 6% |
77 Properties |
| 2018 | £285,058 | -3% |
101 Properties |
| 2017 | £292,223 | 15% |
96 Properties |
| 2016 | £248,125 | 14% |
111 Properties |
| 2015 | £214,065 | 3% |
90 Properties |
| 2014 | £207,626 | 4% |
97 Properties |
| 2013 | £198,681 | -1% |
76 Properties |
| 2012 | £201,430 | 7% |
91 Properties |
| 2011 | £187,945 | 9% |
82 Properties |
| 2010 | £171,080 | 0,5% |
68 Properties |
| 2009 | £170,291 | -19% |
62 Properties |
| 2008 | £203,119 | 5% |
63 Properties |
| 2007 | £192,310 | 4% |
155 Properties |
| 2006 | £185,507 | 7% |
150 Properties |
| 2005 | £173,113 | 4% |
106 Properties |
| 2004 | £165,501 | 12% |
144 Properties |
| 2003 | £146,166 | 14% |
142 Properties |
| 2002 | £125,184 | 23% |
161 Properties |
| 2001 | £95,791 | 9% |
174 Properties |
| 2000 | £87,599 | 21% |
122 Properties |
| 1999 | £69,068 | 3% |
171 Properties |
| 1998 | £66,938 | 7% |
144 Properties |
| 1997 | £62,198 | 4% |
155 Properties |
| 1996 | £59,631 | 9% |
121 Properties |
| 1995 | £53,971 | - |
112 Properties |
Property Price per Property Type in Burnham-on-crouch South
Here you can find historic sold price data in order to help with your property search.
The average Property Paid Price for specific property types in the last three years are:
| Property Type | Average Sold Price | Sold Properties |
|---|---|---|
| Semi Detached House | £315,590.00 | 50 Semi Detached Houses |
| Detached House | £469,931.00 | 44 Detached Houses |
| Terraced House | £302,100.00 | 82 Terraced Houses |
| Flat | £216,282.00 | 23 Flats |

