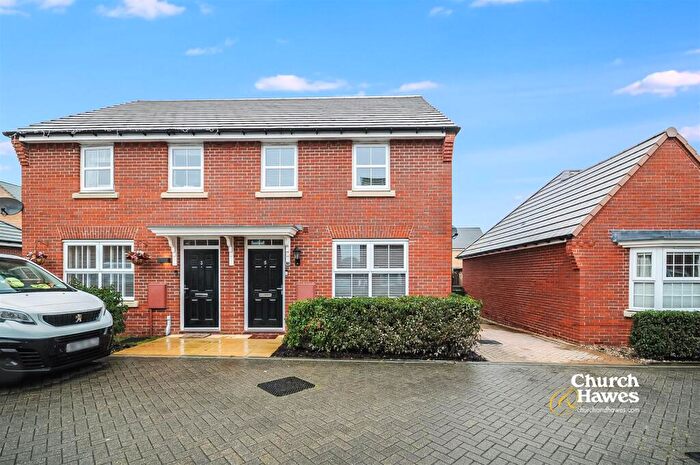
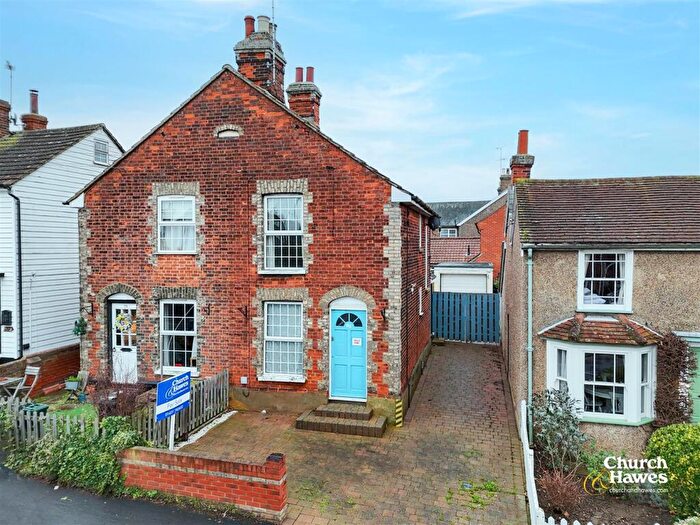
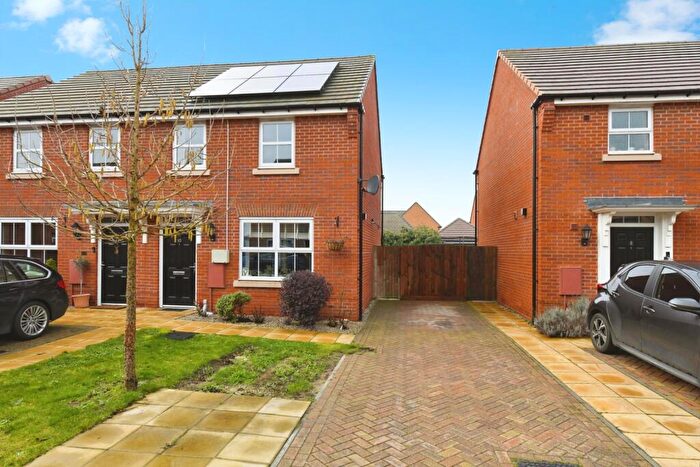
Houses for sale & to rent in Burnham-on-crouch North, Burnham-on-crouch
House Prices in Burnham-on-crouch North
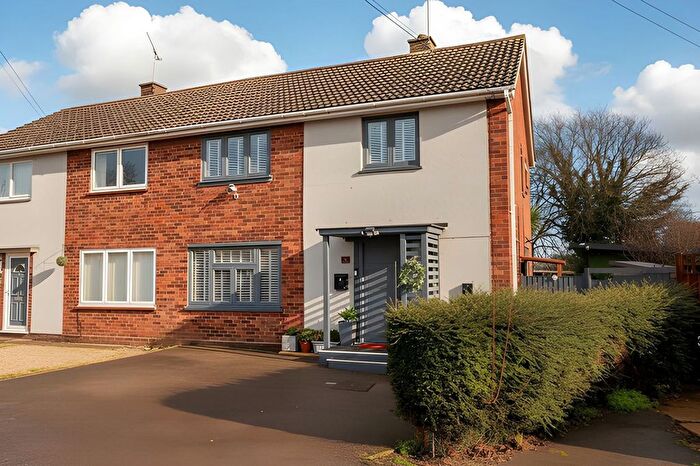
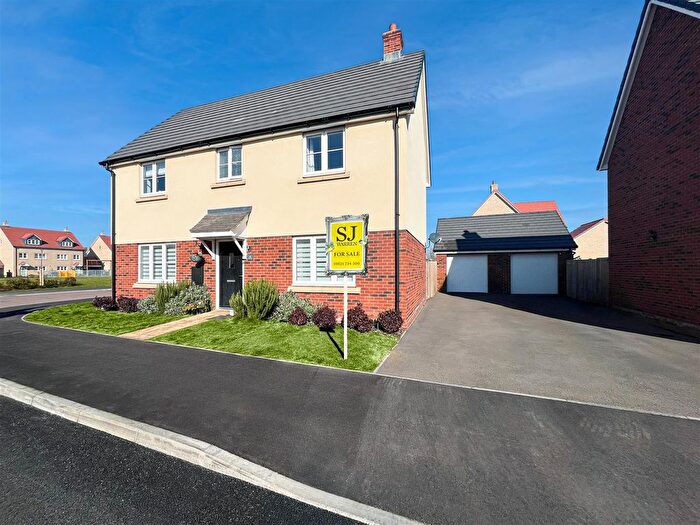
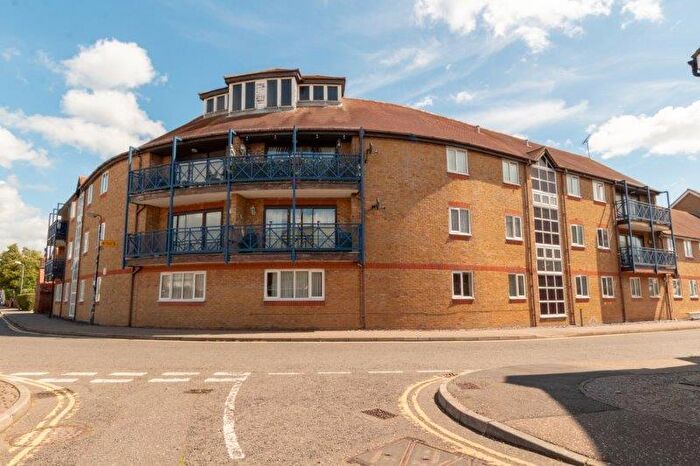
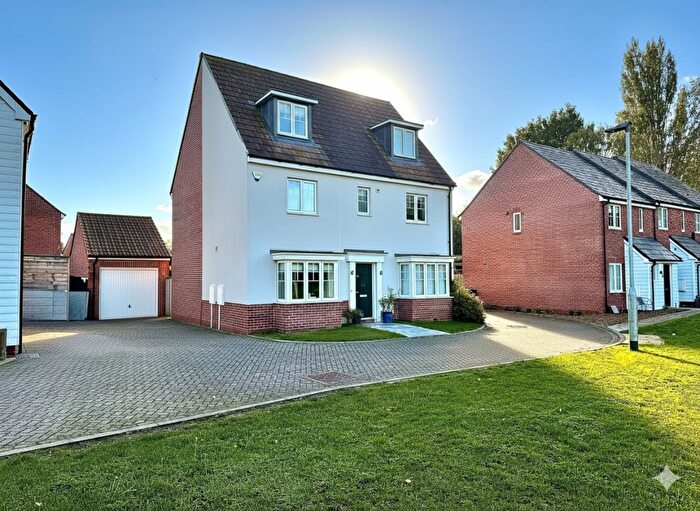
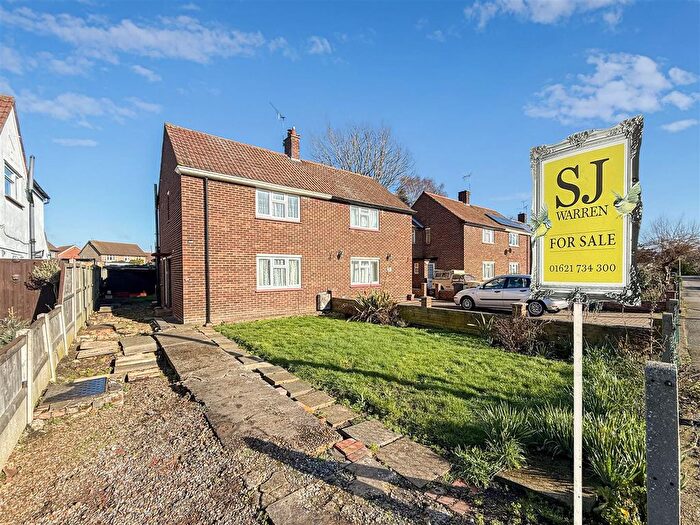
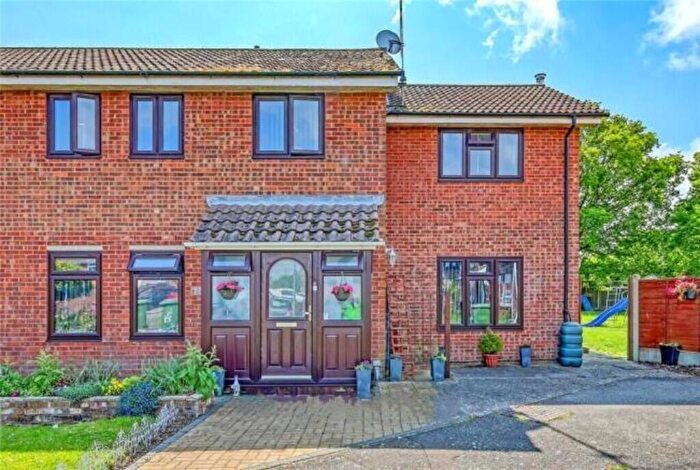
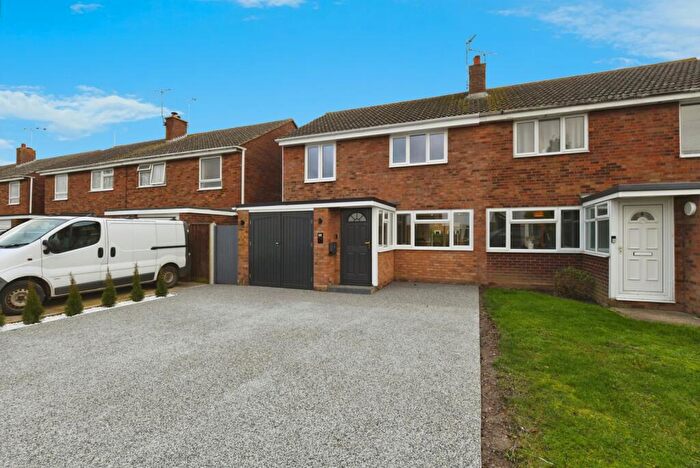
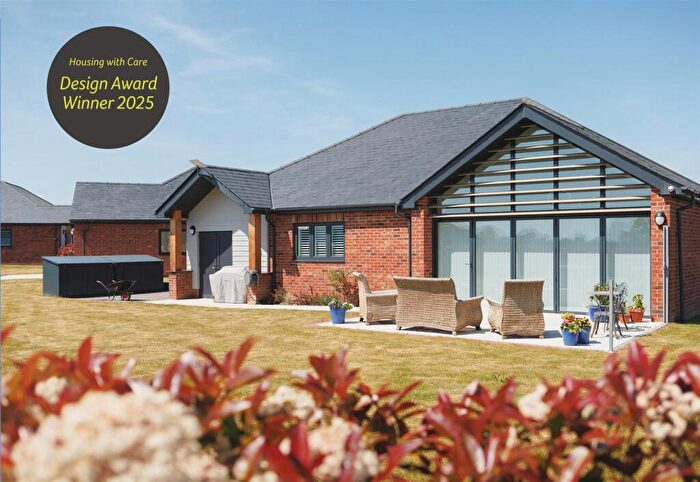
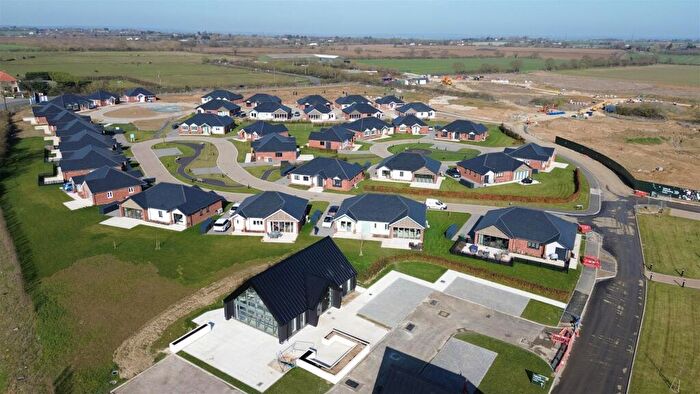
Properties in Burnham-on-crouch North have an average house price of £431,330.00 and had 159 Property Transactions within the last 3 years¹.
Burnham-on-crouch North is an area in Burnham-on-crouch, Essex with 1,591 households², where the most expensive property was sold for £1,200,000.00.
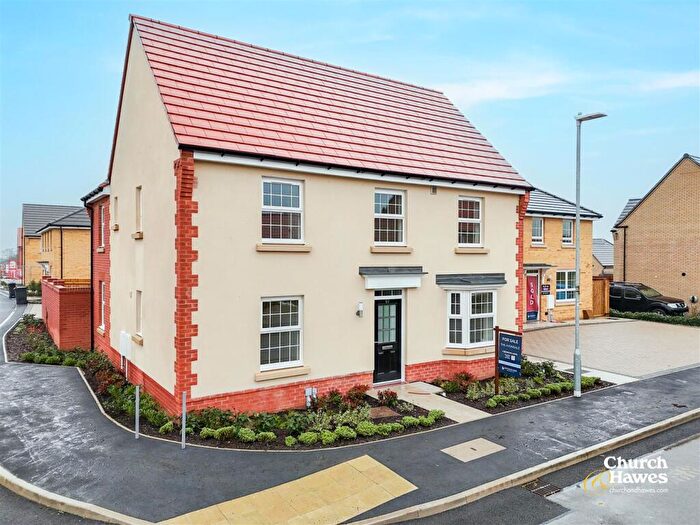
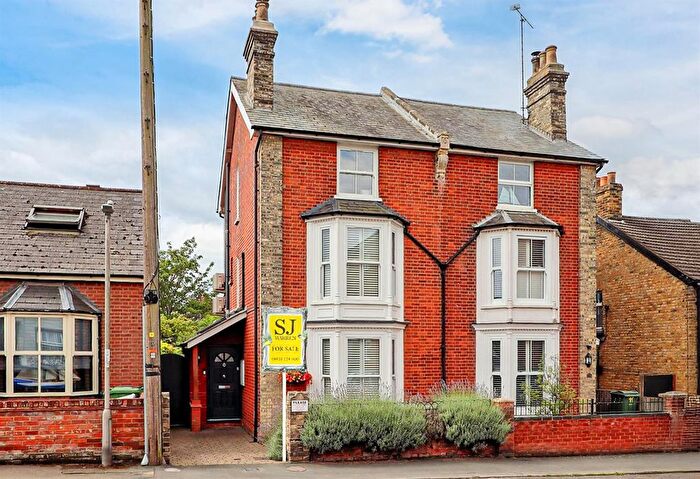
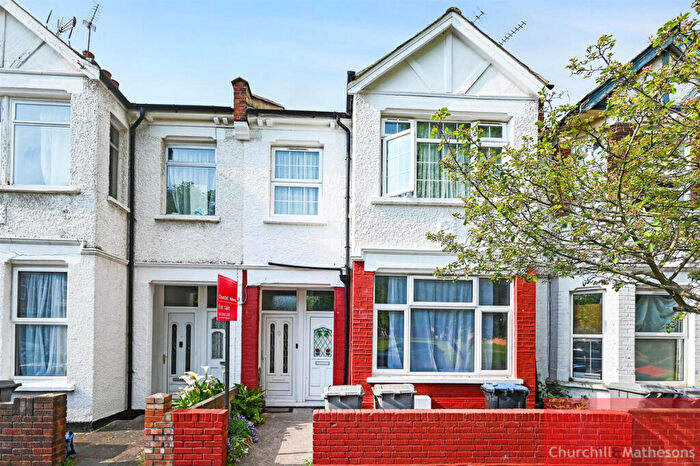
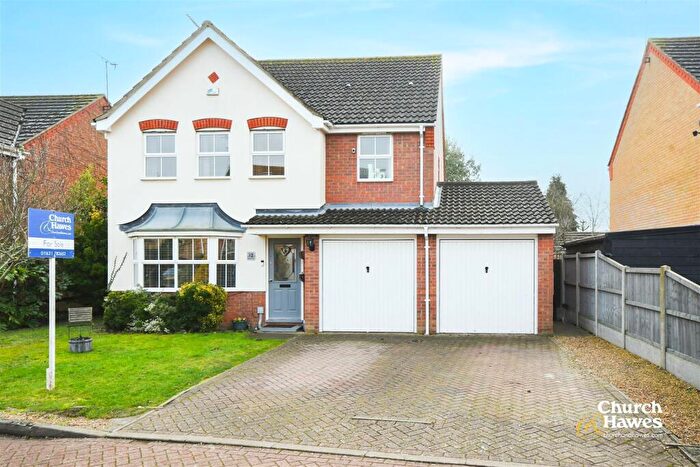
Properties for sale in Burnham-on-crouch North
Roads and Postcodes in Burnham-on-crouch North
Navigate through our locations to find the location of your next house in Burnham-on-crouch North, Burnham-on-crouch for sale or to rent.
| Streets | Postcodes |
|---|---|
| Springfield Road | CM0 8TA CM0 8TF |
| Acorn Street | CM0 8SR |
| Alexandra Road | CM0 8BW |
| Ambrosia Avenue | CM0 8FU |
| Appleberry Place | CM0 8QN |
| Ashgrove | CM0 8DP |
| Ashwood Close | CM0 8PS |
| Badgers Keep | CM0 8UD |
| Barclay Drive | CM0 8SQ |
| Barnmead Way | CM0 8QD |
| Baynard Walk | CM0 8UG |
| Beauchamps | CM0 8PR |
| Beech Close | CM0 8DG |
| Benson Close | CM0 8GP |
| Best Drive | CM0 8SD |
| Blackwater Close | CM0 8AE |
| Boatyard Avenue | CM0 8FR |
| Bouvel Drive | CM0 8TW |
| Bowland Way | CM0 8ST |
| Braeburn Close | CM0 8FW |
| Bramley Avenue | CM0 8FT |
| Brent Way | CM0 8GQ |
| Burnham Business Park | CM0 8TE |
| Cedar Grove | CM0 8DQ |
| Chandlers | CM0 8NY |
| Chelmer Way | CM0 8TN |
| Chestnut Close | CM0 8RL |
| Church Road | CM0 8BZ CM0 8DA |
| Cobbins Chase | CM0 8QF |
| Cobbins Close | CM0 8SE |
| Cobbins Grove | CM0 8JP |
| Compass Gardens | CM0 8TB |
| Corinthia Mews | CM0 8FD |
| Creeksea Lane | CM0 8PH |
| Croxon Way | CM0 8QR |
| Darcy Close | CM0 8QY |
| Debden Way | CM0 8TU |
| Devonshire Road | CM0 8BH CM0 8DR |
| Drewry Street | CM0 8RT |
| East Wick Cottages | CM0 8NF |
| Eastern Road | CM0 8BS CM0 8BT |
| Edmund Street | CM0 8GN |
| Ember Way | CM0 8TJ |
| Endeavour Way | CM0 8FY |
| Ferry Road | CM0 8PL CM0 8PG CM0 8PJ CM0 8PQ |
| Glebe Way | CM0 8QJ |
| Glendale Close | CM0 8LJ |
| Glendale Road | CM0 8LY CM0 8LW |
| Glynn Road | CM0 8BY |
| Grangewood Park Avenue | CM0 8FF CM0 8FG |
| Green Lane | CM0 8PT CM0 8PU CM0 8PX |
| Hamble Way | CM0 8TT |
| Harbour Road | CM0 8FJ |
| Harris Street | CM0 8GF |
| Heron Grove | CM0 8SX |
| Hester Place | CM0 8SA |
| Hewlett Road | CM0 8SU |
| Holly Close | CM0 8DL |
| Hornsby Road | CM0 8RZ |
| King Edward Avenue | CM0 8NU CM0 8PA CM0 8PB |
| Lime Way | CM0 8RH |
| Lord Darby Way | CM0 8FX |
| Maldon Road | CM0 8DB CM0 8DD CM0 8NP CM0 8NR CM0 8NS CM0 8NT |
| Mangapp Chase | CM0 8QQ |
| Maple Way | CM0 8DE CM0 8DF CM0 8DN CM0 8DW CM0 8TR CM0 8TS |
| Maplins Garden | CM0 8GE |
| Marsh Road | CM0 8LZ CM0 8PY CM0 8NA CM0 8NB |
| Marshes | CM0 8NE CM0 8NG |
| Meadow Way | CM0 8PF |
| Medway | CM0 8TL |
| Mill Grange | CM0 8PD |
| Mill Road | CM0 8PZ |
| Montagu Chase | CM0 8SP |
| Murrayfields | CM0 8FE |
| Newman Drive | CM0 8GY |
| Oak Crescent | CM0 8FP |
| Orchard Close | CM0 8GW |
| Orwell Way | CM0 8TH |
| Pannels Brook Crescent | CM0 8FN |
| Pinners Close | CM0 8QH |
| Pippins Road | CM0 8DH |
| Plane Tree Close | CM0 8RQ |
| Pond View | CM0 8FH |
| Poplar Grove | CM0 8RJ |
| Princes Road | CM0 8BX |
| Regatta Road | CM0 8FZ |
| Roman Way | CM0 8UE |
| Russet Way | CM0 8RB CM0 8RF |
| Ruston Road | CM0 8SL |
| Sandpit Lane | CM0 8EE |
| Southminster Road | CM0 8QE CM0 8QB CM0 8QG |
| Spinnakers Way | CM0 8FQ |
| Springfield Industrial Estate | CM0 8UA |
| St Marys Road | CM0 8LX |
| St Peters Field | CM0 8NX |
| Station Road | CM0 8BG |
| Stones Park | CM0 8FS |
| Stoney Hills | CM0 8QA |
| Swingate Close | CM0 8SS |
| The Cobbins | CM0 8QL |
| The Grove | CM0 8GU |
| The Hawthorns | CM0 8HZ |
| The Leas | CM0 8NH CM0 8JW |
| The Mayfield Centre | CM0 8UB |
| Thompson Avenue | CM0 8SG |
| Trent Close | CM0 8TP |
| Valley Road | CM0 8GR |
| Welland Road | CM0 8TX |
| Willow Close | CM0 8DJ |
| Woodcutters | CM0 8PE |
| Worcester Road | CM0 8RA |
| Yacht Way | CM0 8FL |
| CM0 8GJ CM0 8GT CM0 8ND CM0 8QS |
Transport near Burnham-on-crouch North
- FAQ
- Price Paid By Year
- Property Type Price
Frequently asked questions about Burnham-on-crouch North
What is the average price for a property for sale in Burnham-on-crouch North?
The average price for a property for sale in Burnham-on-crouch North is £431,330. This amount is 15% higher than the average price in Burnham-on-crouch. There are 1,321 property listings for sale in Burnham-on-crouch North.
What streets have the most expensive properties for sale in Burnham-on-crouch North?
The streets with the most expensive properties for sale in Burnham-on-crouch North are Mangapp Chase at an average of £985,000, Creeksea Lane at an average of £925,000 and Green Lane at an average of £852,500.
What streets have the most affordable properties for sale in Burnham-on-crouch North?
The streets with the most affordable properties for sale in Burnham-on-crouch North are Pannels Brook Crescent at an average of £161,000, Devonshire Road at an average of £252,500 and Chestnut Close at an average of £260,000.
Which train stations are available in or near Burnham-on-crouch North?
Some of the train stations available in or near Burnham-on-crouch North are Burnham-On-Crouch, Southminster and Althorne.
Property Price Paid in Burnham-on-crouch North by Year
The average sold property price by year was:
| Year | Average Sold Price | Price Change |
Sold Properties
|
|---|---|---|---|
| 2025 | £455,572 | 6% |
53 Properties |
| 2024 | £426,511 | 4% |
64 Properties |
| 2023 | £408,083 | -11% |
42 Properties |
| 2022 | £451,685 | -4% |
84 Properties |
| 2021 | £469,821 | 13% |
131 Properties |
| 2020 | £408,971 | 2% |
136 Properties |
| 2019 | £400,659 | 6% |
135 Properties |
| 2018 | £375,933 | -9% |
108 Properties |
| 2017 | £410,116 | 2% |
77 Properties |
| 2016 | £400,532 | 26% |
74 Properties |
| 2015 | £297,665 | 4% |
60 Properties |
| 2014 | £285,957 | 6% |
69 Properties |
| 2013 | £269,952 | 14% |
53 Properties |
| 2012 | £232,221 | -10% |
49 Properties |
| 2011 | £254,454 | 2% |
45 Properties |
| 2010 | £249,653 | 11% |
53 Properties |
| 2009 | £221,712 | -12% |
48 Properties |
| 2008 | £248,396 | 0,4% |
46 Properties |
| 2007 | £247,301 | -6% |
73 Properties |
| 2006 | £263,372 | 19% |
82 Properties |
| 2005 | £212,351 | 4% |
60 Properties |
| 2004 | £204,734 | 3% |
68 Properties |
| 2003 | £199,281 | 22% |
80 Properties |
| 2002 | £156,181 | 1% |
75 Properties |
| 2001 | £154,443 | 8% |
82 Properties |
| 2000 | £142,694 | 17% |
67 Properties |
| 1999 | £118,546 | 11% |
106 Properties |
| 1998 | £105,614 | 18% |
119 Properties |
| 1997 | £86,759 | 3% |
110 Properties |
| 1996 | £84,553 | 13% |
97 Properties |
| 1995 | £73,143 | - |
61 Properties |
Property Price per Property Type in Burnham-on-crouch North
Here you can find historic sold price data in order to help with your property search.
The average Property Paid Price for specific property types in the last three years are:
| Property Type | Average Sold Price | Sold Properties |
|---|---|---|
| Semi Detached House | £325,540.00 | 50 Semi Detached Houses |
| Detached House | £520,297.00 | 90 Detached Houses |
| Terraced House | £288,307.00 | 19 Terraced Houses |

