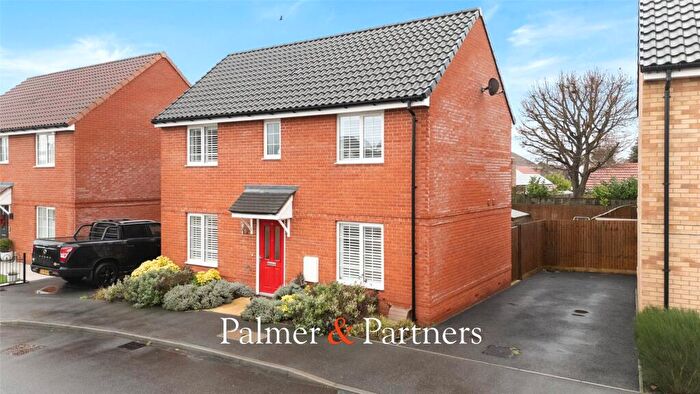
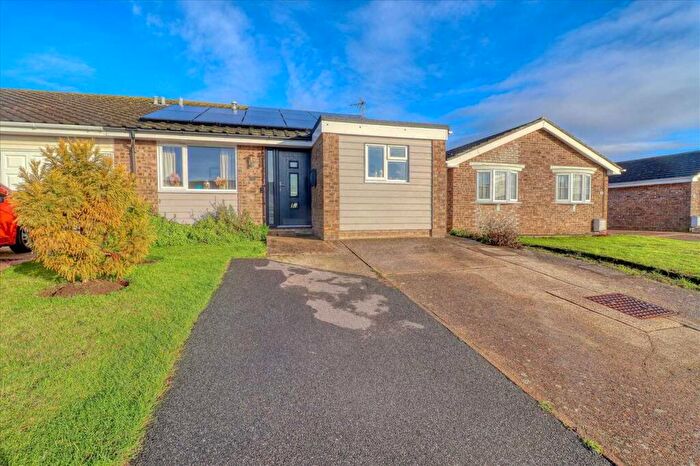
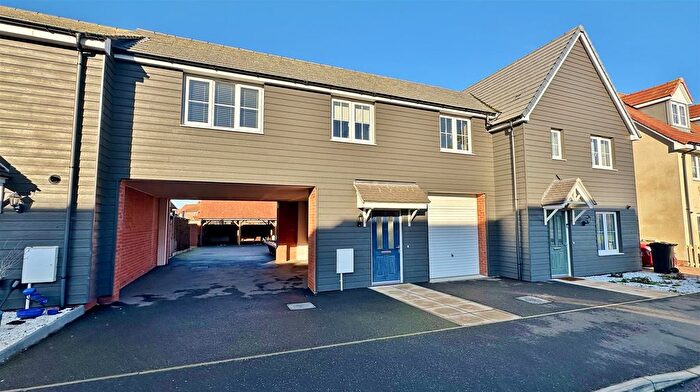
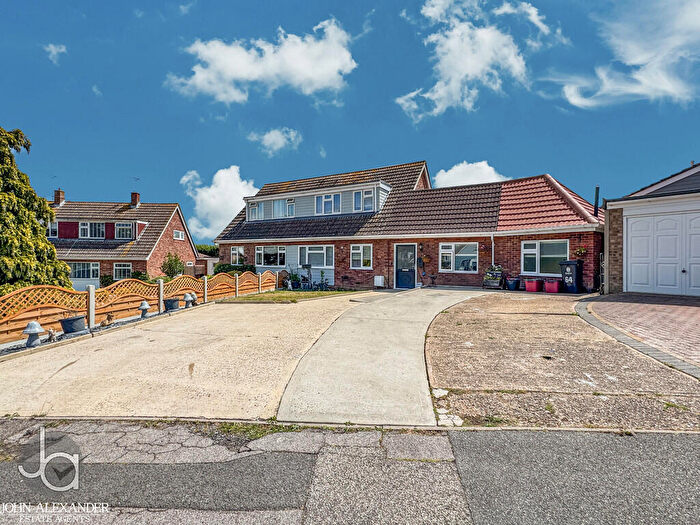
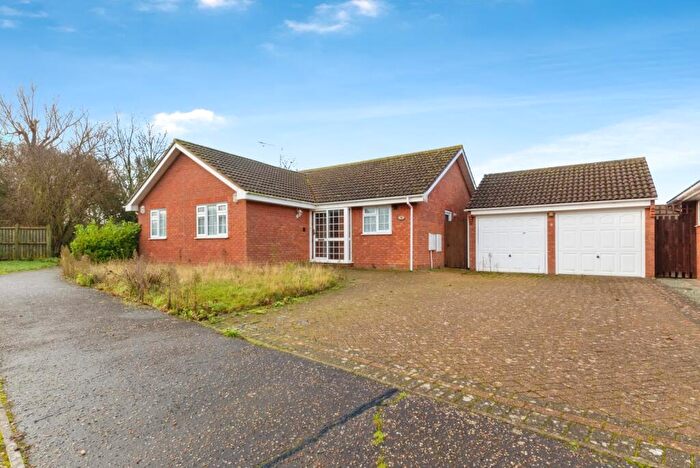
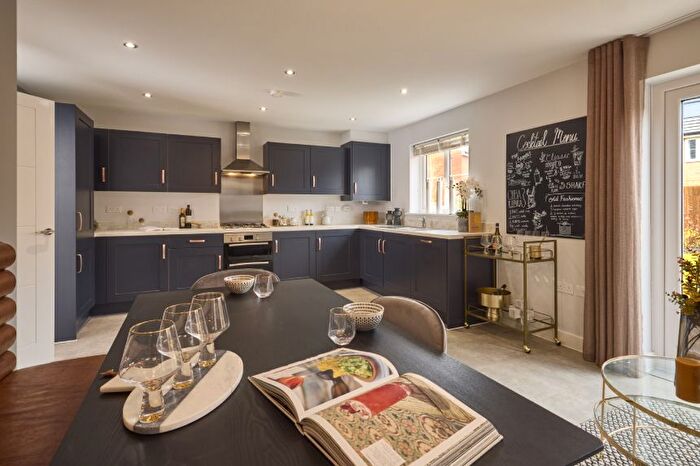
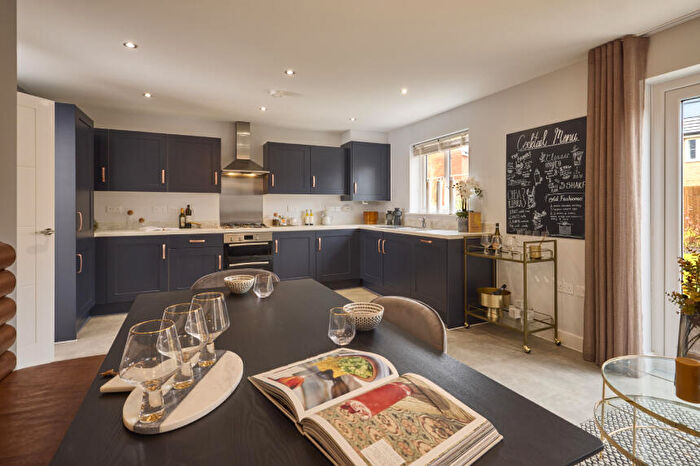
Houses for sale & to rent in Holland And Kirby, Frinton-on-sea
House Prices in Holland And Kirby
Properties in Holland And Kirby have an average house price of £359,178.00 and had 278 Property Transactions within the last 3 years¹.
Holland And Kirby is an area in Frinton-on-sea, Essex with 2,075 households², where the most expensive property was sold for £1,225,000.00.
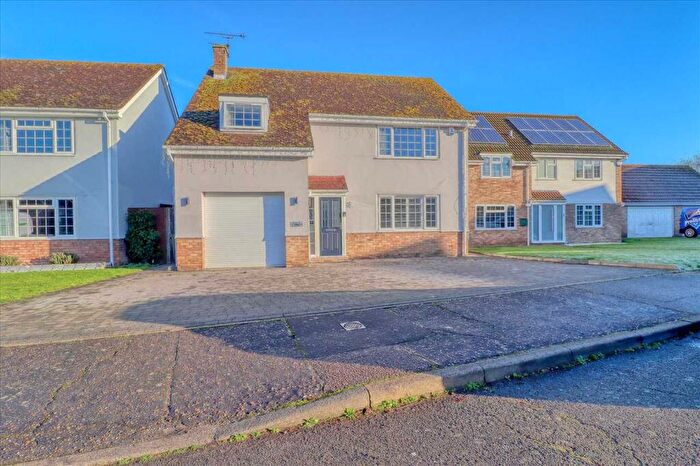
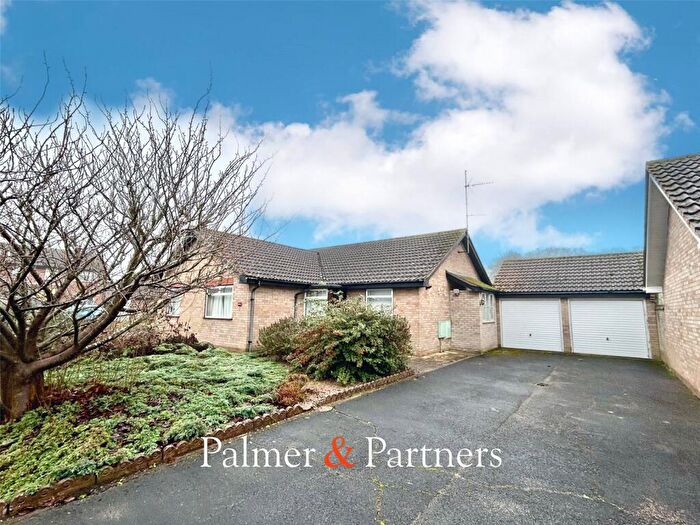
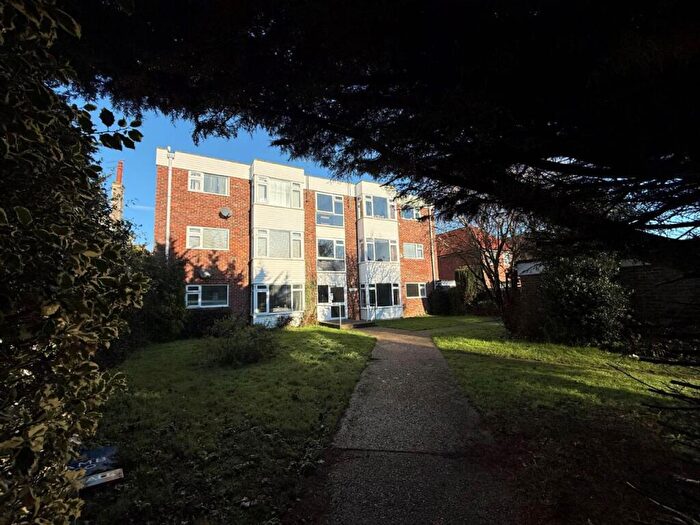
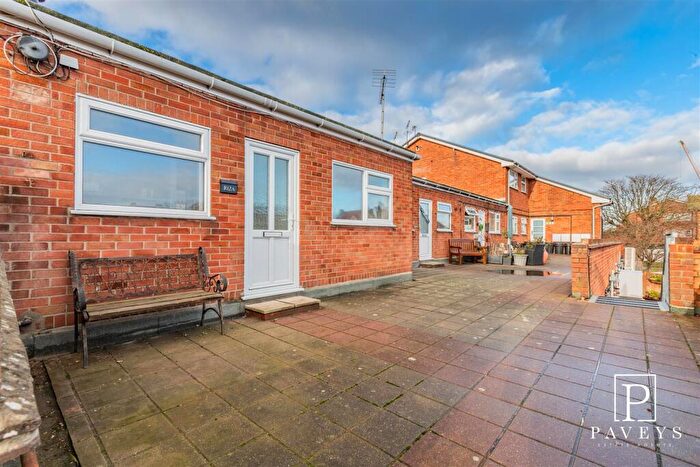
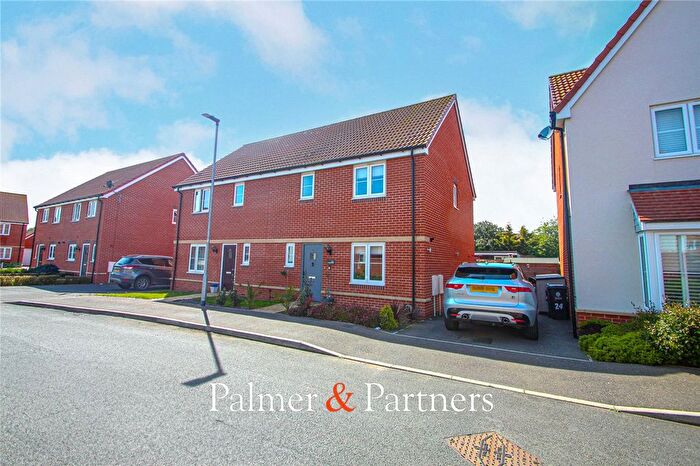
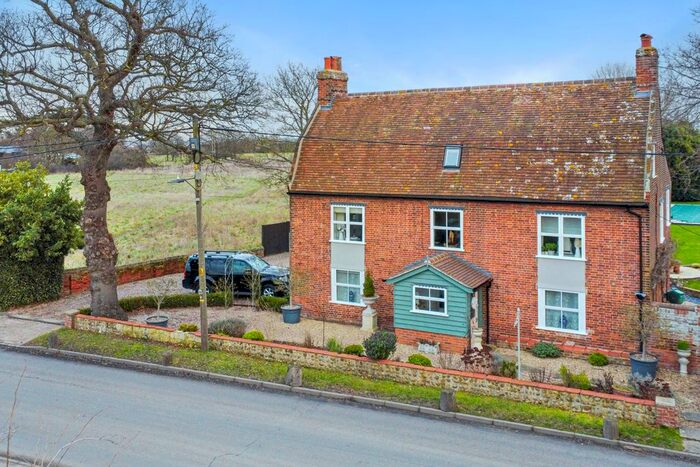
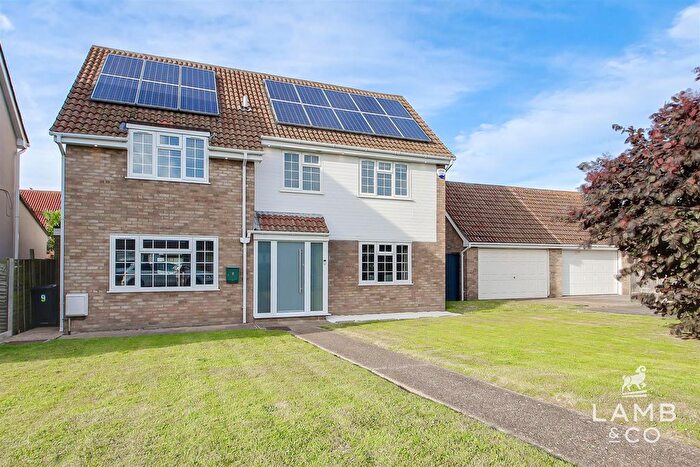
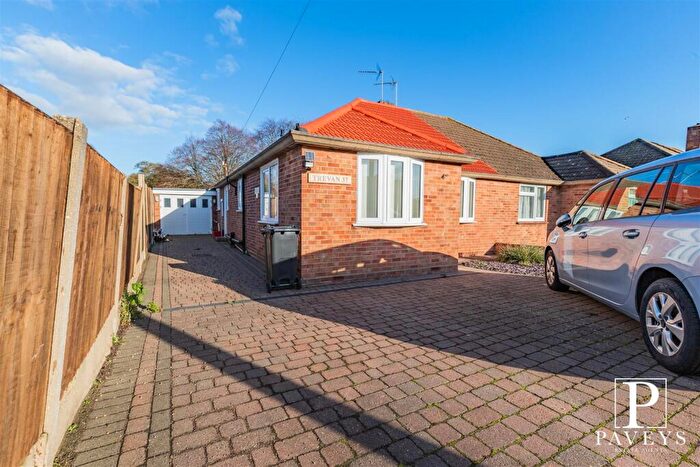
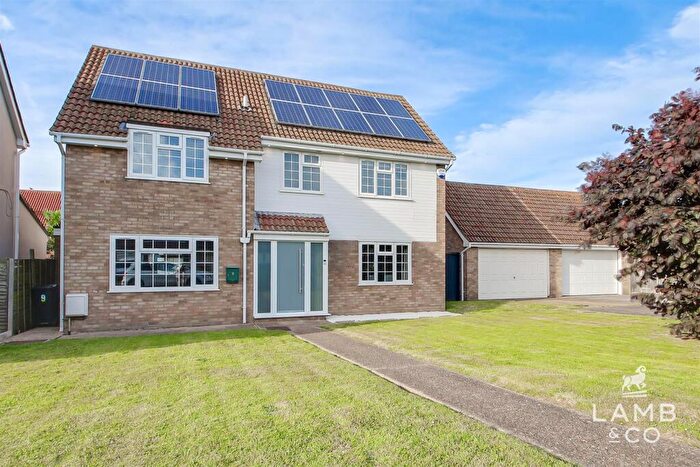
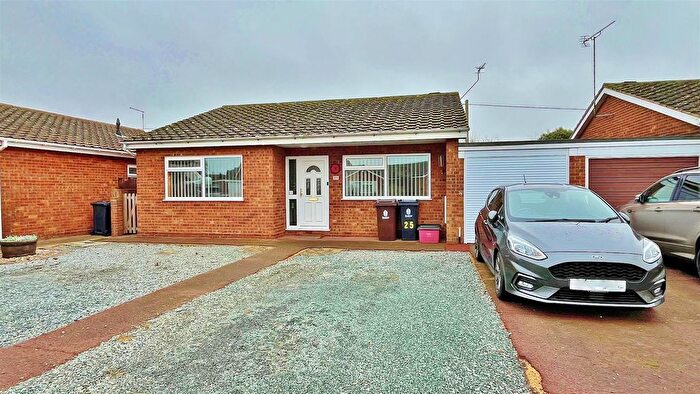
Properties for sale in Holland And Kirby
Roads and Postcodes in Holland And Kirby
Navigate through our locations to find the location of your next house in Holland And Kirby, Frinton-on-sea for sale or to rent.
| Streets | Postcodes |
|---|---|
| Addison Road | CO13 0HU |
| Bellamy Close | CO13 0PQ |
| Bemerton Gardens | CO13 0LG CO13 0LQ CO13 0PZ CO13 0QA CO13 0QE CO13 0QF |
| Blanchard Close | CO13 0NE |
| Briarfields | CO13 0HE |
| Buckfast Avenue | CO13 0PT CO13 0PU |
| Chapel Lane | CO13 0NF |
| Chartfield Drive | CO13 0DR |
| Chestnut Avenue | CO13 0LA |
| Church Lane | CO13 0JS |
| Clacton Road | CO13 0JU |
| Crabtree | CO13 0HF |
| Crossfield Way | CO13 0LL |
| Dugmore Avenue | CO13 0ED |
| Edith Road | CO13 0DH |
| Elm Grove | CO13 0HH |
| Frinton Road | CO13 0HJ CO13 0LD CO13 0LE CO13 0LF CO13 0PA CO13 0PD CO13 0PN CO13 0PW |
| Great Holland Court | CO13 0JY |
| Halstead Road | CO13 0DX CO13 0DY CO13 0LR CO13 0LW |
| Hamilton Road | CO13 0HX |
| Hillcrest | CO13 0EB |
| Holland Road | CO13 0HL |
| Holland Villas | CO13 0JJ |
| Horsey Road | CO13 0DZ CO13 0EQ |
| Hunters Chase | CO13 0JZ |
| Kew Lane | CO13 0JF |
| Kirby Road | CO13 0HS CO13 0HT CO13 0HZ CO13 0JD |
| Laxton Grove | CO13 0SD CO13 0SE CO13 0SF |
| Lily Cottages | CO13 0DD |
| Little Clacton Road | CO13 0ET CO13 0EU CO13 0EX CO13 0EY |
| Lynne Close | CO13 0PY |
| Main Road | CO13 0FD CO13 0JH CO13 0JL CO13 0JN |
| Malting Lane | CO13 0EH |
| Manor Road | CO13 0JT |
| Mumfords Lane | CO13 0NB |
| Orchard Drive | CO13 0SA CO13 0SB |
| Oxborrow Close | CO13 0SN |
| Peake Avenue | CO13 0SQ |
| Percival Road | CO13 0DL |
| Pondtail Court | CO13 0LJ |
| Pork Lane | CO13 0ES CO13 0JE |
| Prospect Park | CO13 0HR |
| Pyesand | CO13 0EA |
| Quay Lane | CO13 0DP CO13 0DS |
| Rectory Road | CO13 0JP |
| Rosery Mews | CO13 0SG |
| Sadlers Close | CO13 0QB |
| Southcroft Close | CO13 0QD |
| Station Road | CO13 0LU |
| The Close | CO13 0JR |
| The Crescent | CO13 0JG |
| The Sheltons | CO13 0LX CO13 0LY |
| The Sparlings | CO13 0HD |
| The Street | CO13 0EE CO13 0EF CO13 0EG |
| Thorpe Road | CO13 0LT CO13 0LZ CO13 0ND CO13 0NH CO13 0NQ |
| Tildesley Close | CO13 0SR |
| Turpins Lane | CO13 0PB |
| Victoria Avenue | CO13 0DJ |
| Village Close | CO13 0PF |
| Village Way | CO13 0PE CO13 0PG |
| Vista Avenue | CO13 0DN CO13 0DW |
| Walton Road | CO13 0DA CO13 0DB CO13 0DE CO13 0DF CO13 0DG CO13 0DU |
| Wellfield Way | CO13 0PH |
| Westbury Road | CO13 0JB |
| Willow Avenue | CO13 0PR CO13 0PS |
| Willow Court | CO13 0PP |
| Woburn Avenue | CO13 0PX |
Transport near Holland And Kirby
- FAQ
- Price Paid By Year
- Property Type Price
Frequently asked questions about Holland And Kirby
What is the average price for a property for sale in Holland And Kirby?
The average price for a property for sale in Holland And Kirby is £359,178. This amount is 5% lower than the average price in Frinton-on-sea. There are 1,356 property listings for sale in Holland And Kirby.
What streets have the most expensive properties for sale in Holland And Kirby?
The streets with the most expensive properties for sale in Holland And Kirby are Church Lane at an average of £706,666, Chartfield Drive at an average of £652,500 and Turpins Lane at an average of £583,750.
What streets have the most affordable properties for sale in Holland And Kirby?
The streets with the most affordable properties for sale in Holland And Kirby are The Sheltons at an average of £174,500, Hillcrest at an average of £253,250 and Bemerton Gardens at an average of £253,874.
Which train stations are available in or near Holland And Kirby?
Some of the train stations available in or near Holland And Kirby are Kirby Cross, Frinton and Walton-On-Naze.
Property Price Paid in Holland And Kirby by Year
The average sold property price by year was:
| Year | Average Sold Price | Price Change |
Sold Properties
|
|---|---|---|---|
| 2025 | £353,516 | -5% |
50 Properties |
| 2024 | £372,820 | 3% |
64 Properties |
| 2023 | £363,435 | 4% |
71 Properties |
| 2022 | £349,586 | 2% |
93 Properties |
| 2021 | £343,301 | 7% |
137 Properties |
| 2020 | £319,881 | 10% |
100 Properties |
| 2019 | £288,512 | -10% |
81 Properties |
| 2018 | £317,929 | 8% |
92 Properties |
| 2017 | £292,730 | 7% |
97 Properties |
| 2016 | £272,498 | 17% |
104 Properties |
| 2015 | £225,342 | 12% |
101 Properties |
| 2014 | £198,711 | 10% |
134 Properties |
| 2013 | £179,270 | -10% |
67 Properties |
| 2012 | £197,649 | -6% |
80 Properties |
| 2011 | £209,111 | 5% |
45 Properties |
| 2010 | £199,431 | 11% |
74 Properties |
| 2009 | £177,696 | -34% |
79 Properties |
| 2008 | £238,802 | 13% |
58 Properties |
| 2007 | £208,853 | 2% |
145 Properties |
| 2006 | £204,065 | 1% |
132 Properties |
| 2005 | £201,897 | 1% |
94 Properties |
| 2004 | £199,569 | 20% |
127 Properties |
| 2003 | £159,927 | 14% |
124 Properties |
| 2002 | £137,502 | 21% |
146 Properties |
| 2001 | £108,022 | 10% |
157 Properties |
| 2000 | £97,292 | 12% |
147 Properties |
| 1999 | £85,863 | 18% |
152 Properties |
| 1998 | £70,159 | 0,1% |
129 Properties |
| 1997 | £70,106 | 5% |
120 Properties |
| 1996 | £66,701 | -1% |
95 Properties |
| 1995 | £67,520 | - |
89 Properties |
Property Price per Property Type in Holland And Kirby
Here you can find historic sold price data in order to help with your property search.
The average Property Paid Price for specific property types in the last three years are:
| Property Type | Average Sold Price | Sold Properties |
|---|---|---|
| Semi Detached House | £288,001.00 | 79 Semi Detached Houses |
| Detached House | £404,798.00 | 180 Detached Houses |
| Terraced House | £234,312.00 | 16 Terraced Houses |
| Flat | £162,333.00 | 3 Flats |

