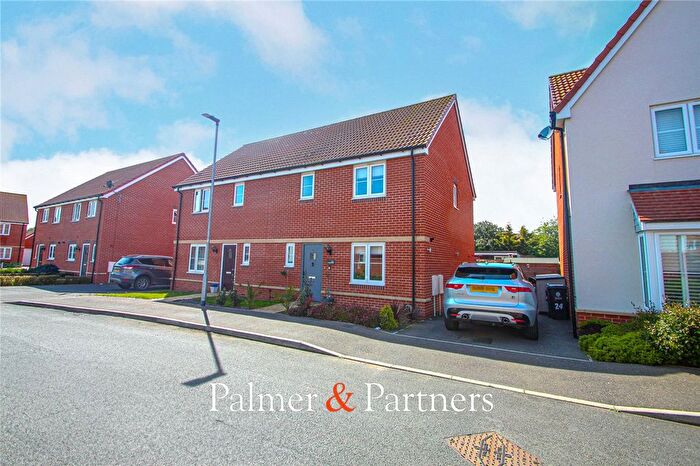
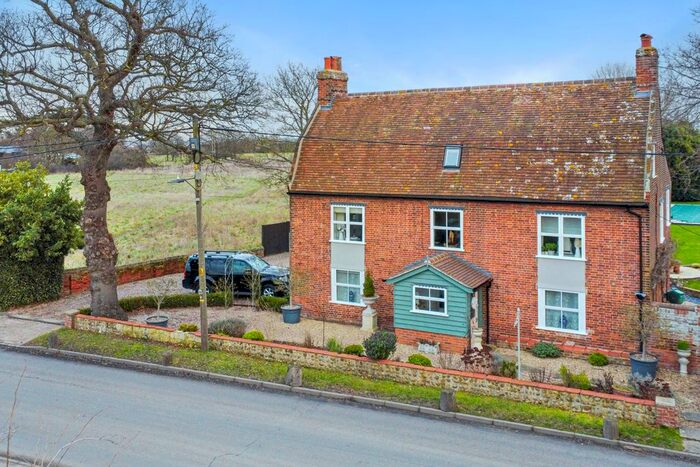
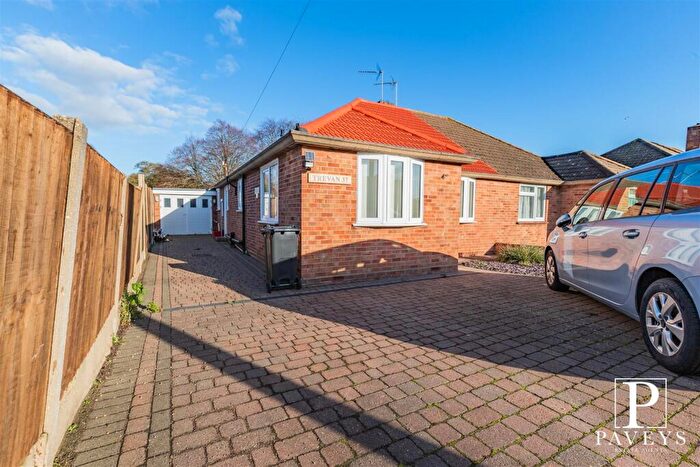
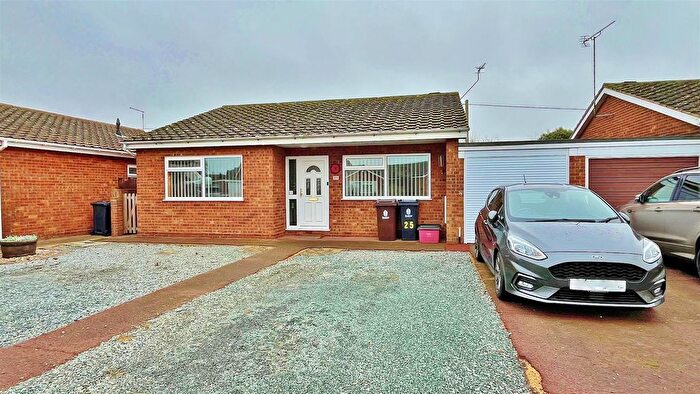
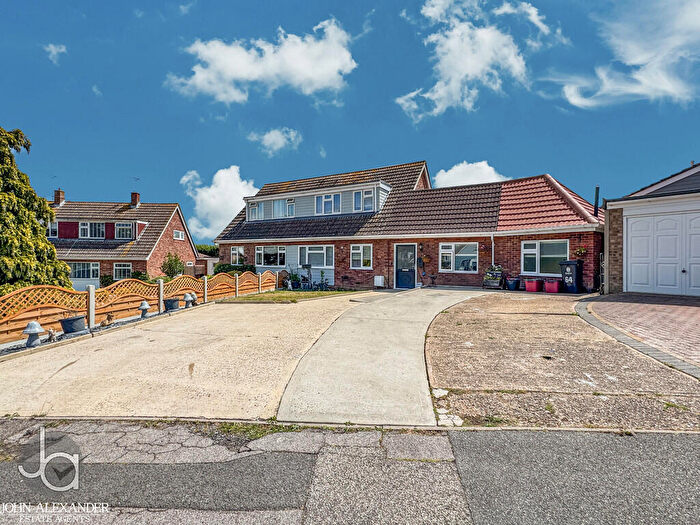
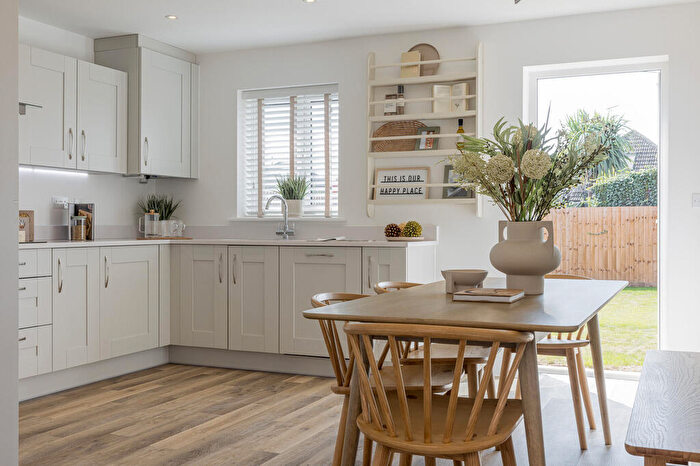
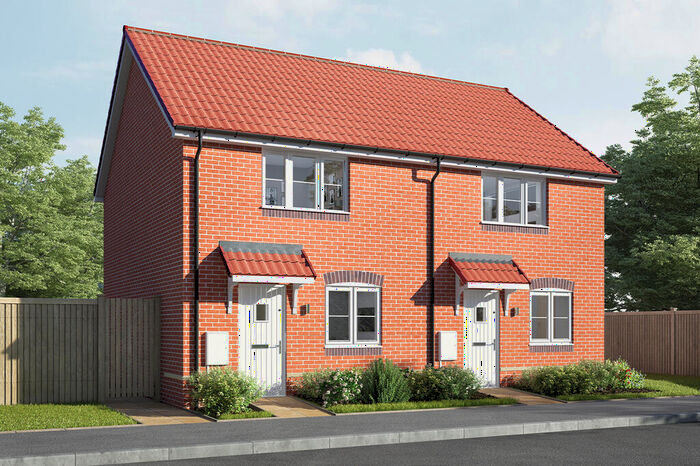
Houses for sale & to rent in Kirby Cross, Frinton-on-sea
House Prices in Kirby Cross
Properties in Kirby Cross have an average house price of £382,025.00 and had 74 Property Transactions within the last 3 years¹.
Kirby Cross is an area in Frinton-on-sea, Essex with 10 households², where the most expensive property was sold for £575,000.00.
Properties for sale in Kirby Cross
Roads and Postcodes in Kirby Cross
Navigate through our locations to find the location of your next house in Kirby Cross, Frinton-on-sea for sale or to rent.
| Streets | Postcodes |
|---|---|
| Aldrich Close | CO13 0FN |
| Barley Road | CO13 0FR |
| Barn Owl Road | CO13 0GH |
| Bemerton Court | CO13 0LH |
| Borrage Way | CO13 0GP |
| Farm Close | CO13 0FW |
| Frinton Road | CO13 0LB |
| Grain Drive | CO13 0GB |
| Halstead Road | CO13 0LP CO13 0LS |
| Kirby Road | CO13 0FB |
| Little Meers Gardens | CO13 0FG |
| Millet Road | CO13 0FZ |
| Oatside | CO13 0FU |
| Orchard Crescent | CO13 0GF |
| Orchard Gardens | CO13 0FL |
| Peake Avenue | CO13 0FF |
| Poppy Way | CO13 0GE |
| Rye Way | CO13 0FT |
| Sanderling Close | CO13 0GN |
| Shop Parade | CO13 0LN |
| Wheatsheaf | CO13 0FS |
| Woodgett Close | CO13 0FH |
| Woodland Close | CO13 0GJ |
| Woodpecker Way | CO13 0GL |
Transport near Kirby Cross
- FAQ
- Price Paid By Year
- Property Type Price
Frequently asked questions about Kirby Cross
What is the average price for a property for sale in Kirby Cross?
The average price for a property for sale in Kirby Cross is £382,025. This amount is 1% higher than the average price in Frinton-on-sea. There are 610 property listings for sale in Kirby Cross.
What streets have the most expensive properties for sale in Kirby Cross?
The streets with the most expensive properties for sale in Kirby Cross are Woodgett Close at an average of £495,000 and Little Meers Gardens at an average of £438,000.
What streets have the most affordable properties for sale in Kirby Cross?
The streets with the most affordable properties for sale in Kirby Cross are Wheatsheaf at an average of £359,729 and Barley Road at an average of £361,619.
Which train stations are available in or near Kirby Cross?
Some of the train stations available in or near Kirby Cross are Kirby Cross, Frinton and Walton-On-Naze.
Property Price Paid in Kirby Cross by Year
The average sold property price by year was:
| Year | Average Sold Price | Price Change |
Sold Properties
|
|---|---|---|---|
| 2025 | £285,333 | -36% |
3 Properties |
| 2024 | £388,461 | -15% |
15 Properties |
| 2023 | £446,518 | 18% |
14 Properties |
| 2022 | £365,136 | 9% |
42 Properties |
| 2021 | £332,351 | -0,5% |
41 Properties |
| 2020 | £333,903 | -5% |
34 Properties |
| 2019 | £351,063 | 11% |
38 Properties |
| 2018 | £312,349 | -16% |
14 Properties |
| 2017 | £361,285 | 12% |
7 Properties |
| 2016 | £318,500 | -5% |
2 Properties |
| 2015 | £335,833 | -27% |
6 Properties |
| 2005 | £425,000 | - |
1 Property |
Property Price per Property Type in Kirby Cross
Here you can find historic sold price data in order to help with your property search.
The average Property Paid Price for specific property types in the last three years are:
| Property Type | Average Sold Price | Sold Properties |
|---|---|---|
| Semi Detached House | £258,327.00 | 15 Semi Detached Houses |
| Terraced House | £264,596.00 | 5 Terraced Houses |
| Detached House | £427,259.00 | 54 Detached Houses |

