
Houses for sale in Yeldham, Halstead
House Prices in Yeldham
Properties in Yeldham have an average house price of £378k and had 66 Property Transactions within the last 3 years¹.
Yeldham is an area in Halstead, Essex with 913 households², where the most expensive property was sold for £1.08M.
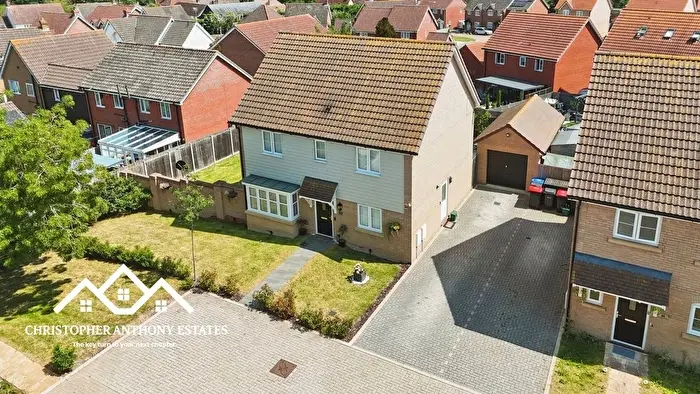
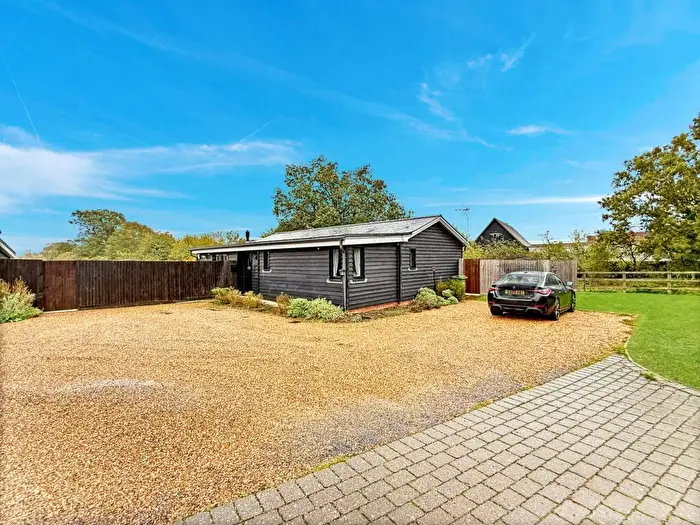
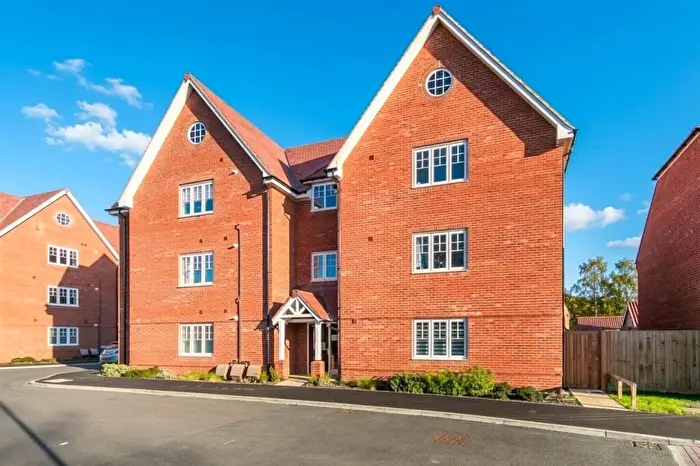
Properties for sale in Yeldham

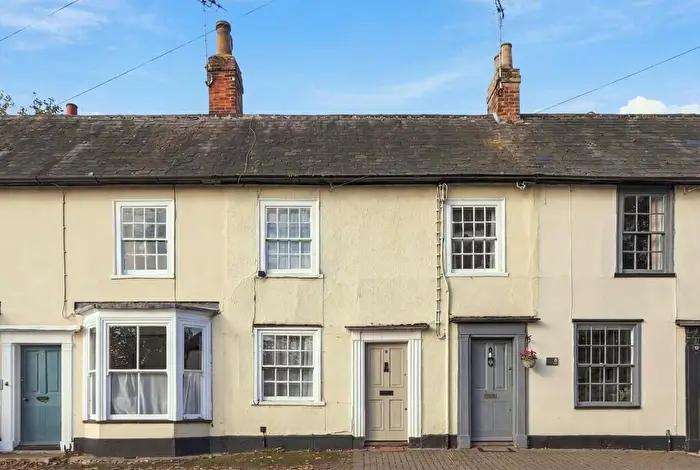

 3 Bedrooms
 1 Bathroom



If you are looking to sell your house, let it out, or receive a property valuation, an expert can help you.
Click the button below to get started.



Roads and Postcodes in Yeldham
Navigate through our locations to find the location of your next house in Yeldham, Halstead for sale or to rent.
| Streets | Postcodes |
|---|---|
| Armstrong Way | CO9 4QP |
| Baron Way | CO9 4ET |
| Bridge Street | CO9 4HU |
| Butlers Way | CO9 4QL CO9 4QN |
| Carleton Close | CO9 4QJ |
| Cherry Lane | CO9 4HH |
| Church Green | CO9 4LB |
| Church Lane | CO9 4DT |
| Church Road | CO9 4PQ CO9 4PR CO9 4PS CO9 4PT |
| Churchfields | CO9 4PX CO9 4PY |
| Cornish Hall End | CM7 4HG |
| Duncan Rise | CO9 4QE |
| Earle Green | CO9 4FE |
| Gainsford End | CO9 4EL CO9 4EJ CO9 4EN |
| Goodchild Way | CO9 4HT CO9 4JW |
| Great Oak Court | CO9 4PZ |
| Hall Green | CO9 4LF |
| Hedingham Road | CO9 4HS |
| High Street | CO9 4ES CO9 4ER CO9 4EU CO9 4EX CO9 4EY CO9 4EZ CO9 4PP |
| Highfields | CO9 4QG CO9 4QH CO9 4QQ |
| Hyde Wood Road | CO9 4QX |
| Leather Lane | CO9 4HX CO9 4HY CO9 4HZ CO9 4JA CO9 4JB |
| Little Hyde Close | CO9 4JE |
| Little Hyde Road | CO9 4JF CO9 4JU |
| Little Yeldham Road | CO9 4LN CO9 4QS CO9 4QT |
| Market Grove | CO9 4EF |
| Mashay Road | CO9 4JZ |
| Mill Lane | CO9 4JH |
| North End | CO9 4LG CO9 4LQ |
| North End Road | CO9 4LE |
| North Road | CO9 4QA CO9 4QD |
| Nuns Walk | CO9 4PU |
| Oak Tree Gardens | CO9 4FD |
| Poole Street | CO9 4HJ CO9 4HN CO9 4HP |
| Poplar Close | CO9 4HA |
| Ridgewell Road | CO9 4RG |
| School Road | CO9 4LH |
| Scotneys Lane | CO9 4HG |
| Stambourne Road | CO9 4RA CO9 4RB |
| Station View | CO9 4DW |
| The Birches | CO9 4LJ |
| The Croft | CO9 4JD |
| Tilbury Road | CO9 4JG |
| Toppesfield Road | CO9 4HB CO9 4HD CO9 4HE |
| Whitlock Drive | CO9 4EE |
Property price trends in Yeldham
According to the latest Land Registry data, the average home in Yeldham sold for £340,450 in 2026. That figure comes from 1,181 sales logged over the past 31 years.
Prices have fallen back over the last three years. Compared with 2023, when the typical sale came in around £404,357, that's a fall of roughly 15.8%.
Looking back five years, average prices are down about 2.8% since 2021, a drop of around £9,864 in cash terms.
Zoom out to the past decade for the fuller picture. Back in 2016, homes here averaged £284,957, so the typical sold price has climbed about 19.5% since then, roughly 1.8% a year. Stretch the view to fifteen years and that annual pace eases back to about 0.9%.
Frequently asked questions about Yeldham
What is the average price for a property for sale in Yeldham?
The average price for a property for sale in Yeldham is £377,886. This amount is 6% higher than the average price in Halstead. There are 1,081 property listings for sale in Yeldham.
What streets have the most expensive properties for sale in Yeldham?
The streets with the most expensive properties for sale in Yeldham are Mill Lane at an average of £1,075,000, Tilbury Road at an average of £730,000 and Church Green at an average of £535,000.
What streets have the most affordable properties for sale in Yeldham?
The streets with the most affordable properties for sale in Yeldham are Little Hyde Road at an average of £244,666, Poplar Close at an average of £253,000 and Carleton Close at an average of £270,000.
Which train stations are available in or near Yeldham?
Some of the train stations available in or near Yeldham are Sudbury, Bures and Braintree.
Property Price Paid in Yeldham by Year
The average sold property price by year was:
| Year | Average Sold Price | Price Change |
Sold Properties

|
|---|---|---|---|
| 2026 | £340,450 | 
-16% |
10 Properties |
| 2025 | £394,565 | 
9% |
23 Properties |
| 2024 | £357,894 |
-13% |
19 Properties |
| 2023 | £404,357 |
10% |
14 Properties |
| 2022 | £363,741 |
4% |
31 Properties |
| 2021 | £350,314 |
1% |
34 Properties |
| 2020 | £348,316 |
10% |
27 Properties |
| 2019 | £314,156 |
-8% |
40 Properties |
| 2018 | £339,999 |
14% |
26 Properties |
| 2017 | £292,160 |
2% |
25 Properties |
Property Price per Property Type in Yeldham
Here you can find historic sold price data in order to help with your property search.
The average Property Paid Price for specific property types in the last three years are:
| Property Type | Average Sold Price | Sold Properties |
|---|---|---|
| Detached House | £500,303.00 | 28 Detached Houses |
| Flat | £178,125.00 | 4 Flats |
| Semi Detached House | £331,184.00 | 19 Semi Detached Houses |
| Terraced House | £261,800.00 | 15 Terraced Houses |
