
Houses for sale & to rent in Harlow, Essex
House Prices in Harlow
Properties in Harlow have an average house price of £348k and had 3,268 Property Transactions within the last 3 years.¹
Harlow is an area in Essex with 36,085 households², where the most expensive property was sold for £2.13M.
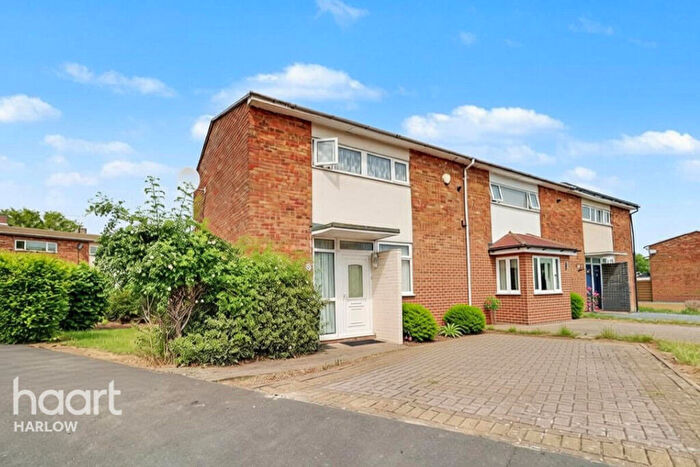
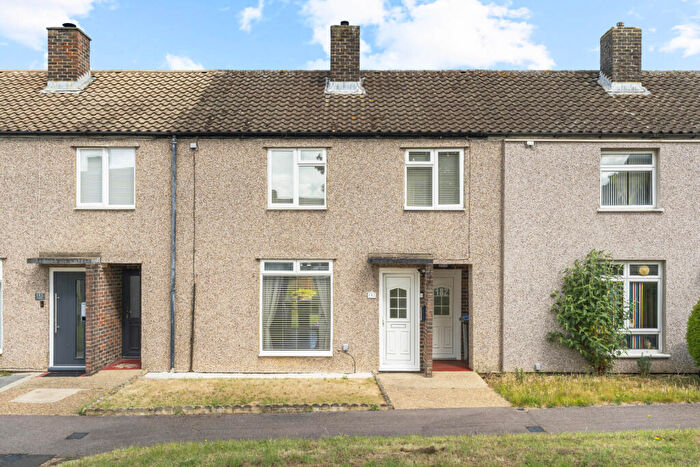
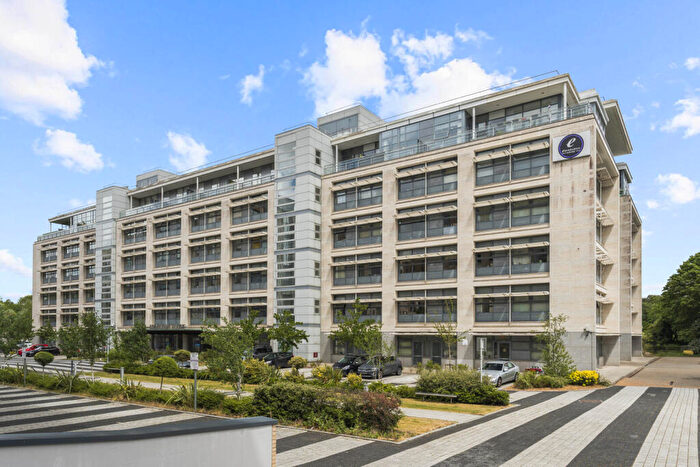
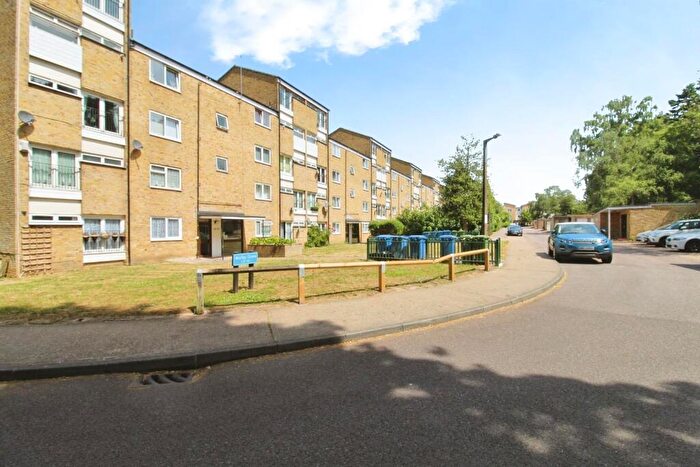
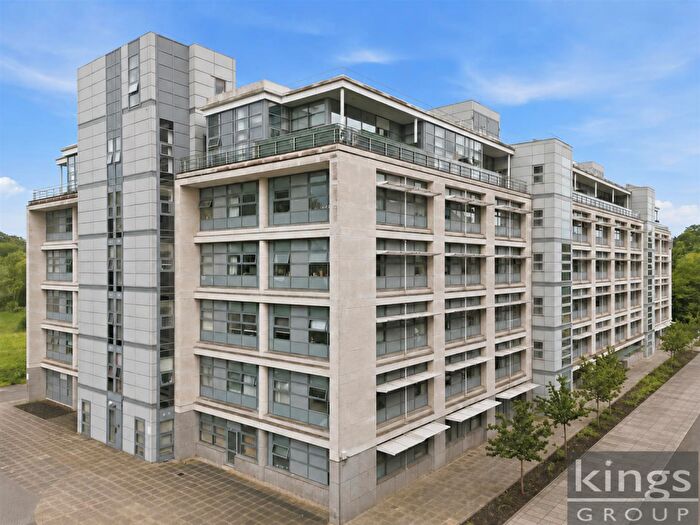
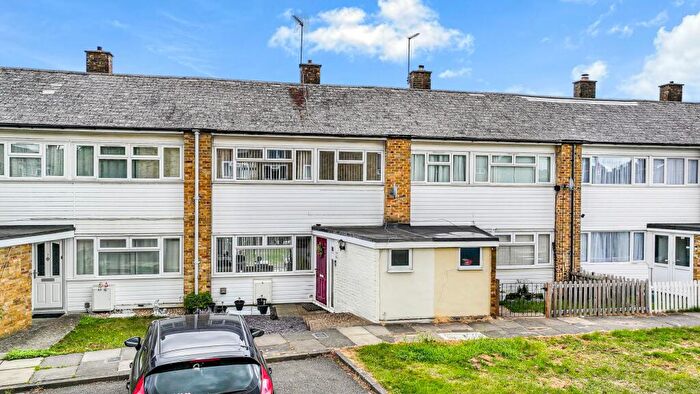
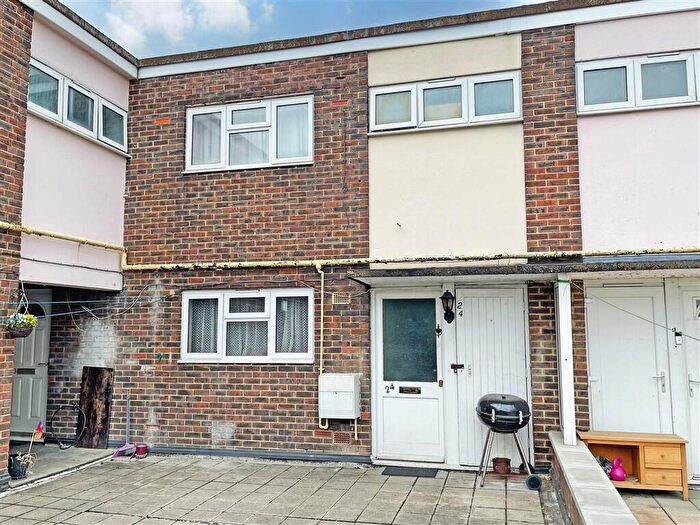
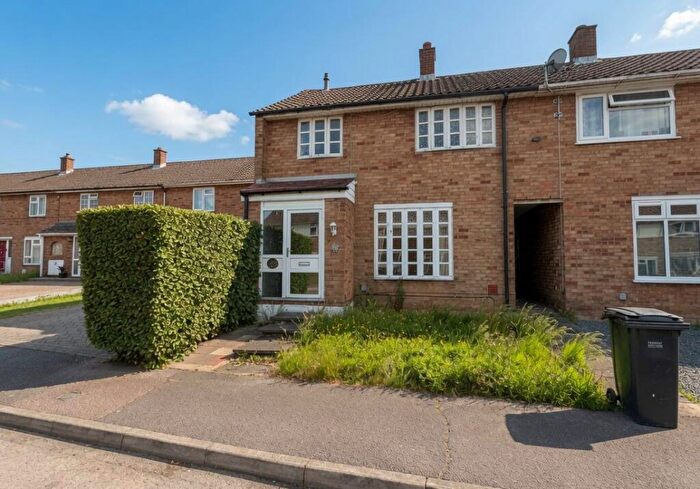
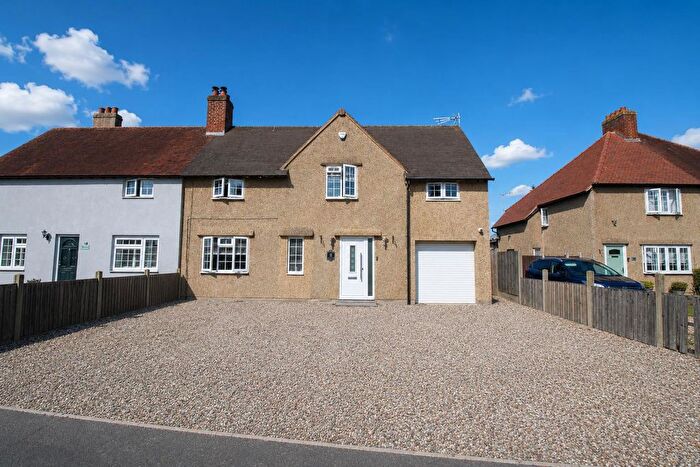
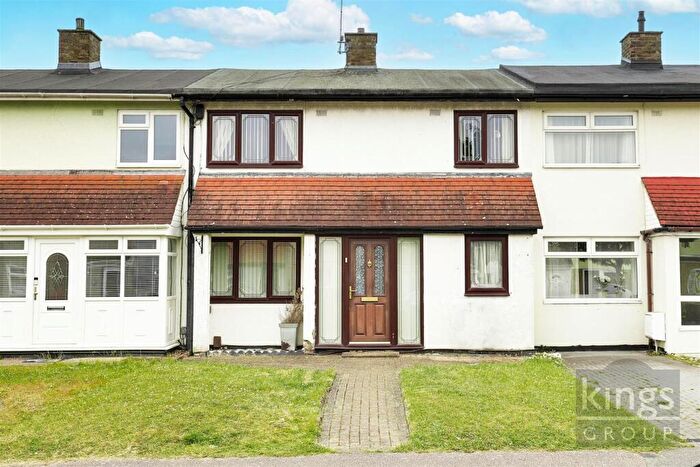
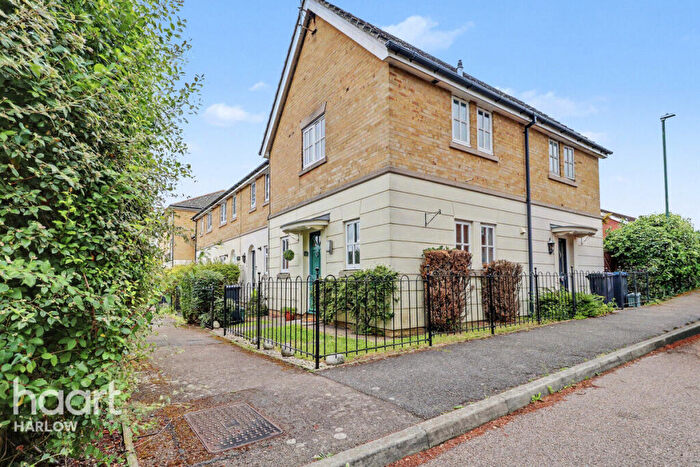
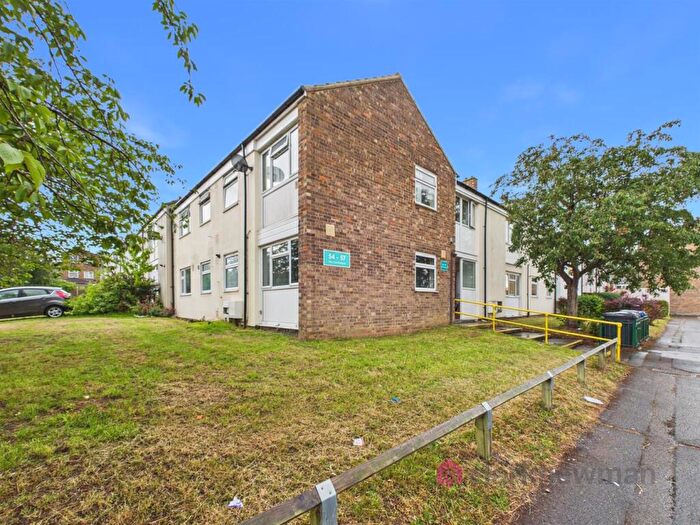
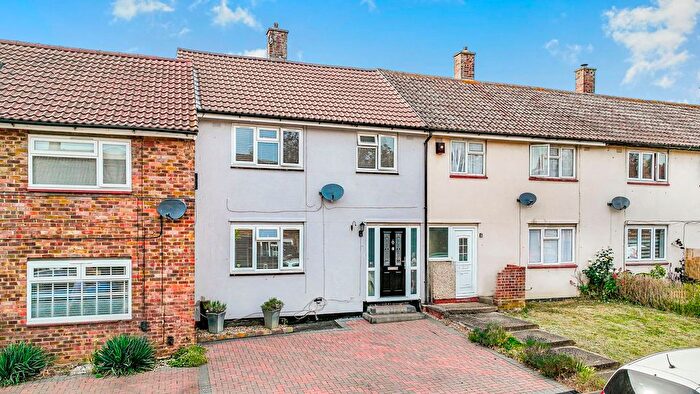
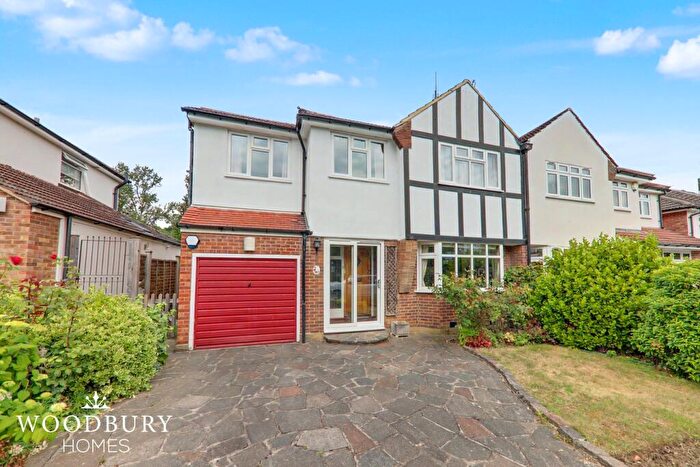
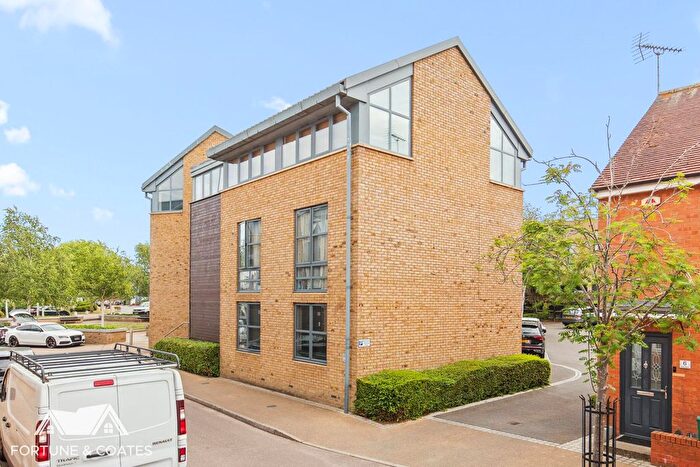
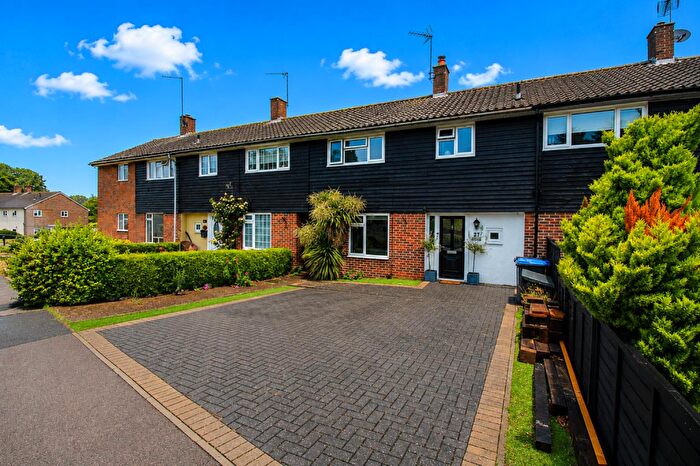
Properties for sale in Harlow
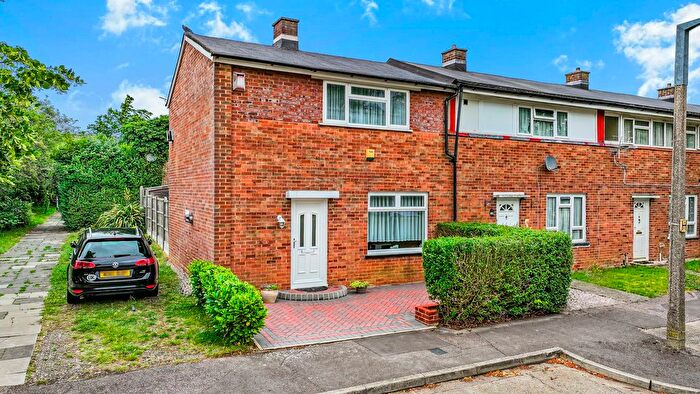
![]()
If you are looking to sell your house, let it out, or receive a property valuation, an expert can help you.
Click the button below to get started.

Neighbourhoods in Harlow
Navigate through our locations to find the location of your next house in Harlow, Essex for sale or to rent.
- Broadley Common, Epping Upland And Nazeing
- Bush Fair
- Church Langley
- Great Parndon
- Harlow Common
- Hastingwood, Matching And Sheering Village
- Hatfield Heath
- Little Parndon And Hare Street
- Lower Nazeing
- Lower Sheering
- Mark Hall
- Moreton And Fyfield
- Netteswell
- Old Harlow
- Roydon
- Staple Tye
- Sumners And Kingsmoor
- Toddbrook
Transport in Harlow
Please see below transportation links in this area:
-
 Harlow Town Station
 -
Harlow Mill Station
-
Roydon Station
-
Sawbridgeworth Station
-
Rye House Station
-
St.Margaret's (Hertfordshire) Station
- FAQ
- Price Paid By Year
- Property Type Price
Frequently asked questions about Harlow
What is the average price for a property for sale in Harlow?
The average price for a property for sale in Harlow is £347,870. This amount is 15% lower than the average price in Essex. There are 9,618 property listings for sale in Harlow.
What locations have the most expensive properties for sale in Harlow?
The locations with the most expensive properties for sale in Harlow are Broadley Common, Epping Upland And Nazeing at an average of £780,971, Hastingwood, Matching And Sheering Village at an average of £695,645 and Moreton And Fyfield at an average of £650,000.
What locations have the most affordable properties for sale in Harlow?
The locations with the most affordable properties for sale in Harlow are Staple Tye at an average of £283,753, Toddbrook at an average of £295,958 and Netteswell at an average of £296,224.
Which train stations are available in or near Harlow?
Some of the train stations available in or near Harlow are Harlow Town, Harlow Mill and Roydon.
Property Price Paid in Harlow by Year
The average sold property price by year was:
| Year | Average Sold Price | Price Change |
Sold Properties
|
|---|---|---|---|
| 2026 | £372,795 | 5% |
73 Properties |
| 2025 | £353,119 | 3% |
1,065 Properties |
| 2024 | £341,413 | -2% |
1,123 Properties |
| 2023 | £347,713 | -2% |
1,007 Properties |
| 2022 | £356,052 | 6% |
1,267 Properties |
| 2021 | £334,710 | 4% |
1,628 Properties |
| 2020 | £320,869 | 1% |
1,228 Properties |
| 2019 | £316,982 | 3% |
1,544 Properties |
| 2018 | £308,169 | -4% |
1,391 Properties |
| 2017 | £319,099 | 11% |
1,383 Properties |
| 2016 | £285,165 | 10% |
1,462 Properties |
| 2015 | £255,700 | 9% |
1,481 Properties |
| 2014 | £231,700 | 11% |
1,495 Properties |
| 2013 | £206,485 | 3% |
1,120 Properties |
| 2012 | £200,833 | -2% |
886 Properties |
| 2011 | £204,320 | 2% |
916 Properties |
| 2010 | £199,956 | 8% |
892 Properties |
| 2009 | £184,906 | -3% |
911 Properties |
| 2008 | £191,335 | -1% |
966 Properties |
| 2007 | £193,068 | 5% |
1,991 Properties |
| 2006 | £182,987 | 2% |
2,006 Properties |
| 2005 | £178,741 | 4% |
1,651 Properties |
| 2004 | £170,860 | 11% |
1,878 Properties |
| 2003 | £152,818 | 10% |
1,913 Properties |
| 2002 | £136,801 | 16% |
2,001 Properties |
| 2001 | £114,460 | 13% |
1,942 Properties |
| 2000 | £100,149 | 16% |
1,781 Properties |
| 1999 | £84,597 | 3% |
2,126 Properties |
| 1998 | £81,872 | 8% |
1,857 Properties |
| 1997 | £75,106 | 4% |
1,875 Properties |
| 1996 | £72,473 | 4% |
1,489 Properties |
| 1995 | £69,416 | - |
1,175 Properties |
Property Price per Property Type in Harlow
Here you can find historic sold price data in order to help with your property search.
The average Property Paid Price for specific property types in the last three years are:
| Property Type | Average Sold Price | Sold Properties |
|---|---|---|
| Semi Detached House | £422,093.00 | 478 Semi Detached Houses |
| Terraced House | £331,336.00 | 1,667 Terraced Houses |
| Detached House | £577,907.00 | 412 Detached Houses |
| Flat | £203,437.00 | 711 Flats |