
Houses for sale in Epping, Essex
House Prices in Epping
Properties in Epping have an average house price of £657k and had 948 Property Transactions within the last 3 years.¹
Epping is an area in Essex with 9,916 households², where the most expensive property was sold for £5.3M.
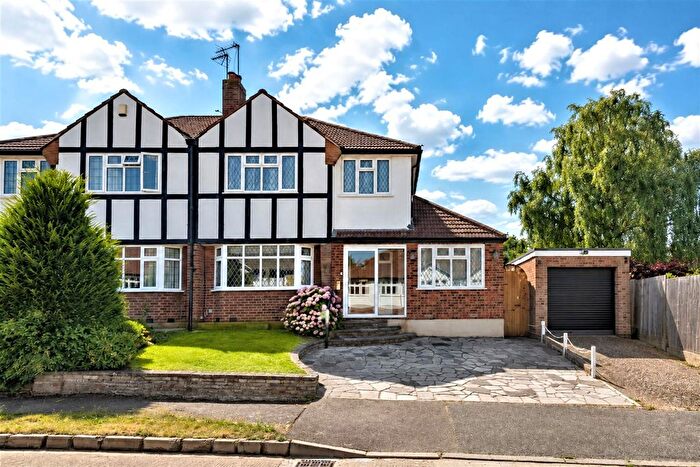
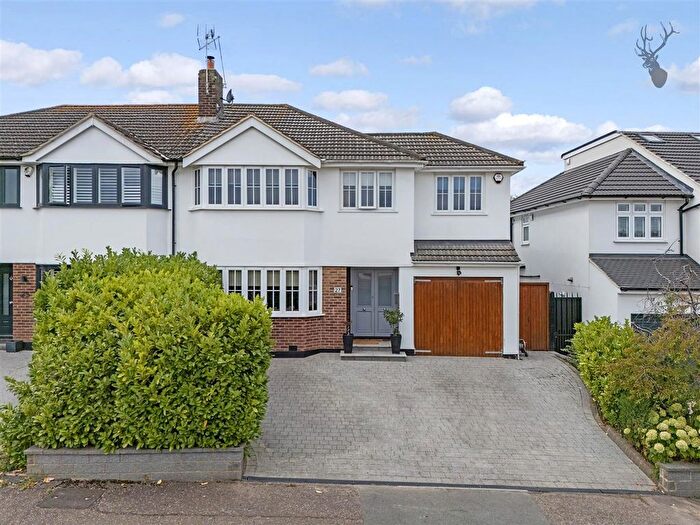
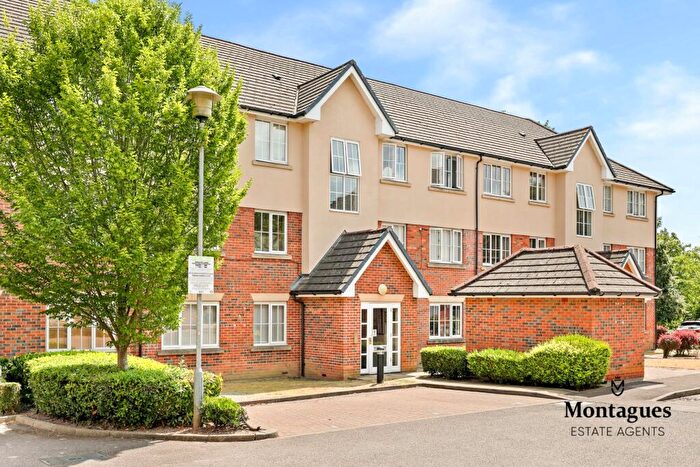
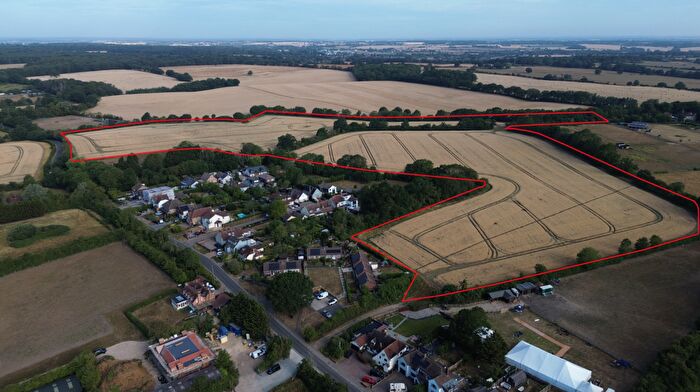
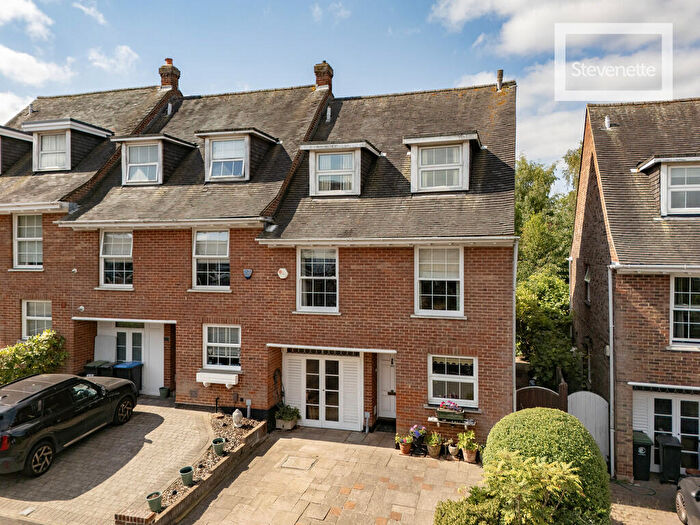
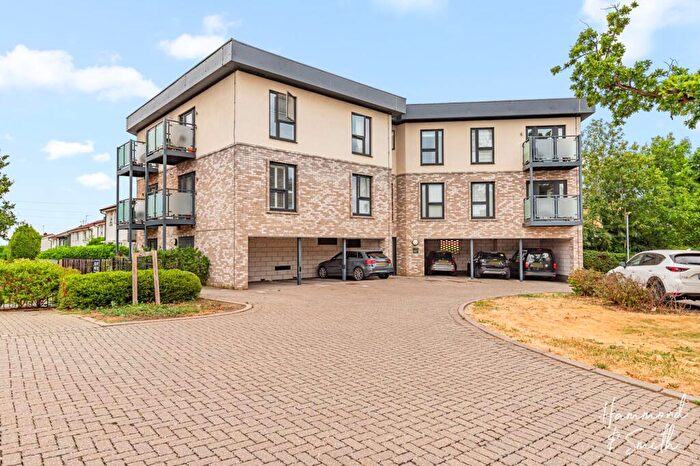
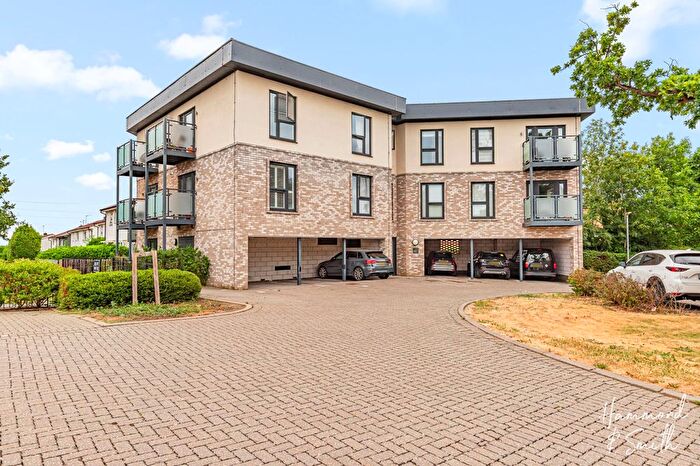
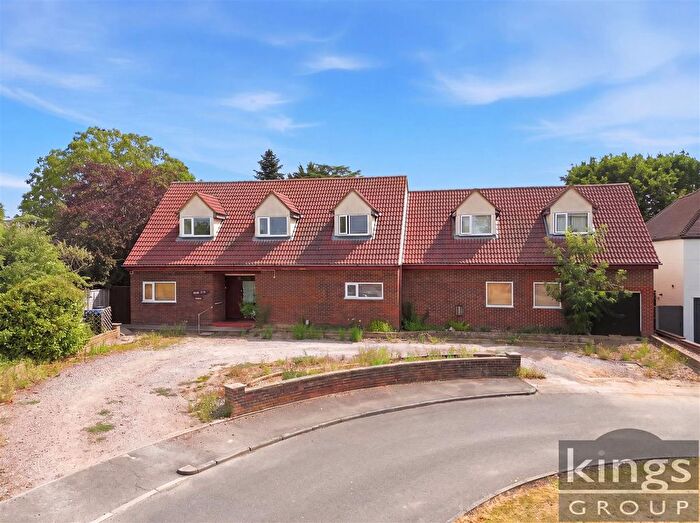
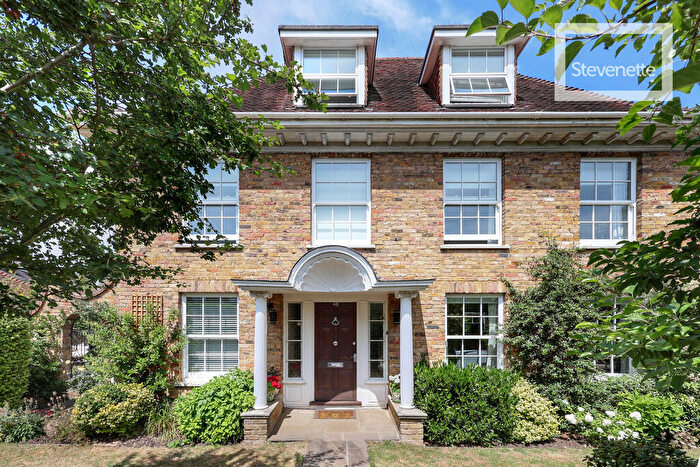
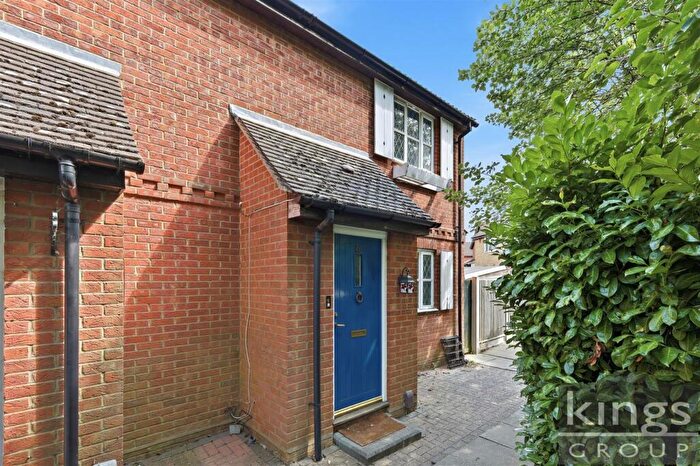
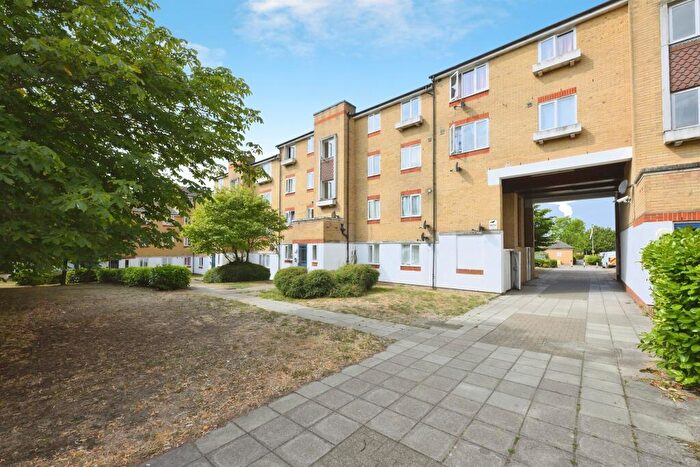
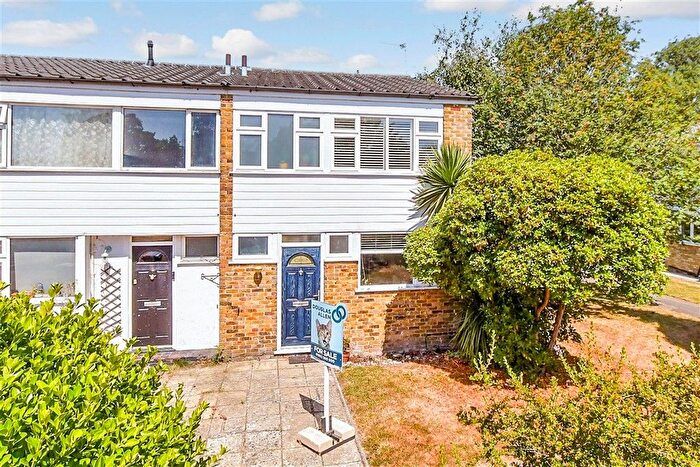
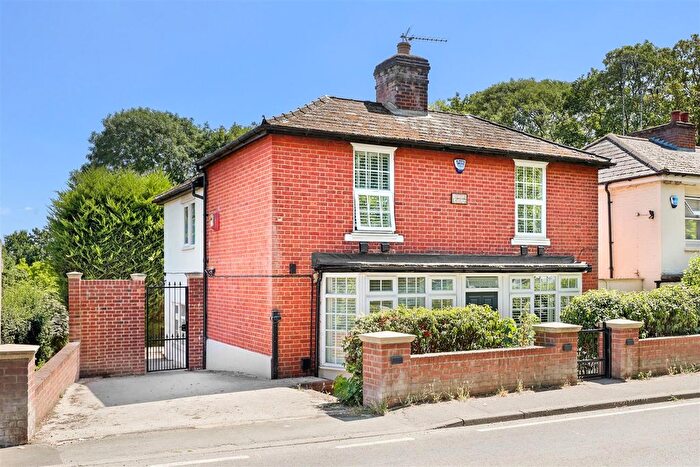
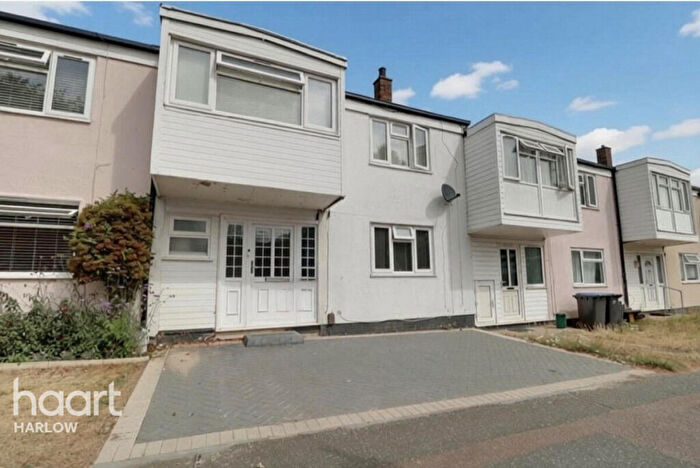
Properties for sale in Epping
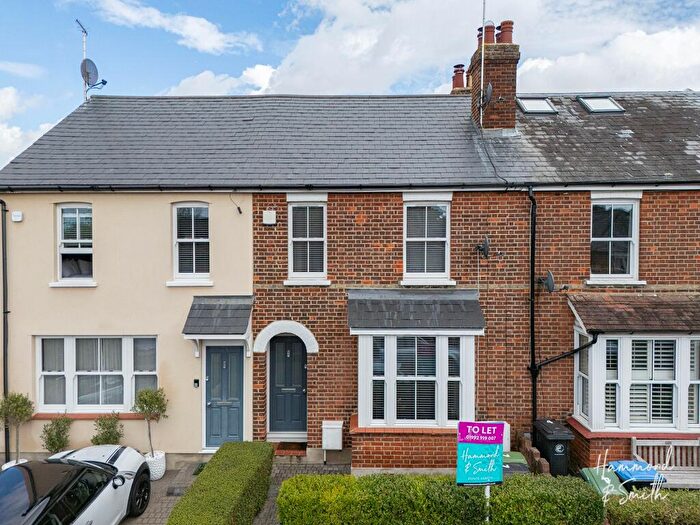


![]()
If you are looking to sell your house, let it out, or receive a property valuation, an expert can help you.
Click the button below to get started.


Neighbourhoods in Epping
Navigate through our locations to find the location of your next house in Epping, Essex for sale or to rent.
Property price trends in Epping
According to the latest Land Registry data, the average home in Epping sold for £661,147 in 2026. That figure comes from a substantial record of 13,040 sales logged over the past 31 years.
Prices have held fairly steady over the last three years. Compared with 2023, when the typical sale came in around £665,505, values are broadly unchanged.
Looking back five years, average prices are up about 6% since 2021, a gain of around £37,553 in cash terms.
Zoom out to the past decade for the fuller picture. Back in 2016, homes here averaged £519,343, so the typical sold price has climbed about 27.3% since then, roughly 2.4% a year. Stretch the view to fifteen years and that annual pace edges up closer to 3.9%.
Frequently asked questions about Epping
What is the average price for a property for sale in Epping?
The average price for a property for sale in Epping is £657,183. This amount is 61% higher than the average price in Essex. There are more than 10,000 property listings for sale in Epping.
What locations have the most expensive properties for sale in Epping?
The locations with the most expensive properties for sale in Epping are Passingford at an average of £1,040,538, Theydon Bois at an average of £977,396 and Waltham Abbey High Beach at an average of £940,000.
What locations have the most affordable properties for sale in Epping?
The locations with the most affordable properties for sale in Epping are North Weald Bassett at an average of £510,934, Epping Hemnall at an average of £565,814 and Epping Lindsey And Thornwood Common at an average of £646,805.
Which tube stations are available in or near Epping?
Some of the tube stations available in or near Epping are Epping, Theydon Bois and Debden.
Property Price Paid in Epping by Year
The average sold property price by year was:
| Year | Average Sold Price | Price Change |
Sold Properties
|
|---|---|---|---|
| 2026 | £661,147 | 4% |
23 Properties |
| 2025 | £634,908 | -6% |
339 Properties |
| 2024 | £673,356 | 1% |
329 Properties |
| 2023 | £665,505 | 1% |
257 Properties |
| 2022 | £660,637 | 6% |
408 Properties |
| 2021 | £623,594 | 3% |
513 Properties |
| 2020 | £604,169 | 5% |
324 Properties |
| 2019 | £573,929 | 1% |
359 Properties |
| 2018 | £570,275 | - |
369 Properties |
| 2017 | £570,331 | 9% |
380 Properties |
Property Price per Property Type in Epping
Here you can find historic sold price data in order to help with your property search.
The average Property Paid Price for specific property types in the last three years are:
| Property Type | Average Sold Price | Sold Properties |
|---|---|---|
| Semi Detached House | £660,424.00 | 305 Semi Detached Houses |
| Detached House | £1,020,631.00 | 221 Detached Houses |
| Terraced House | £531,456.00 | 240 Terraced Houses |
| Flat | £376,213.00 | 182 Flats |
Transport in Epping
Please see below transportation links in this area:
