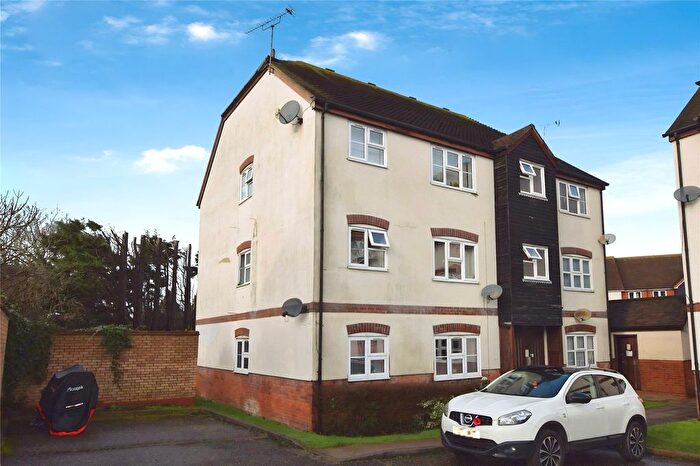
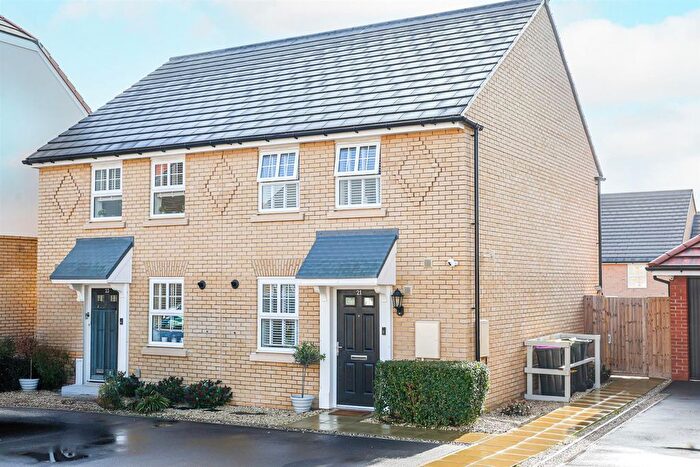
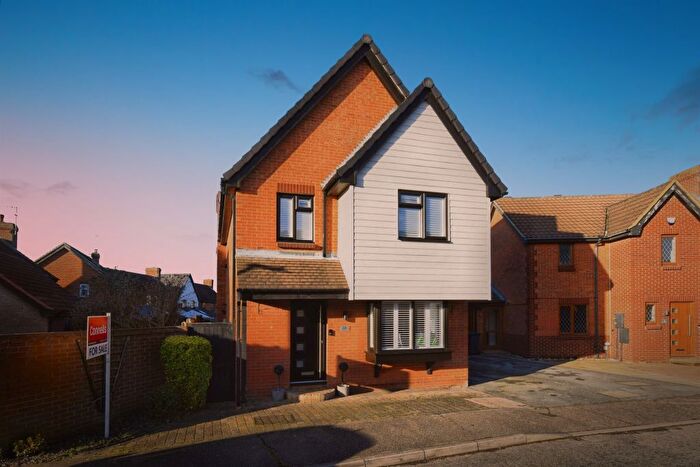
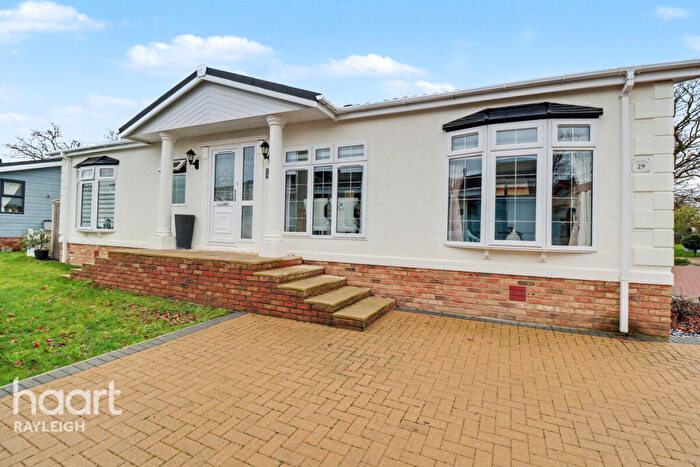
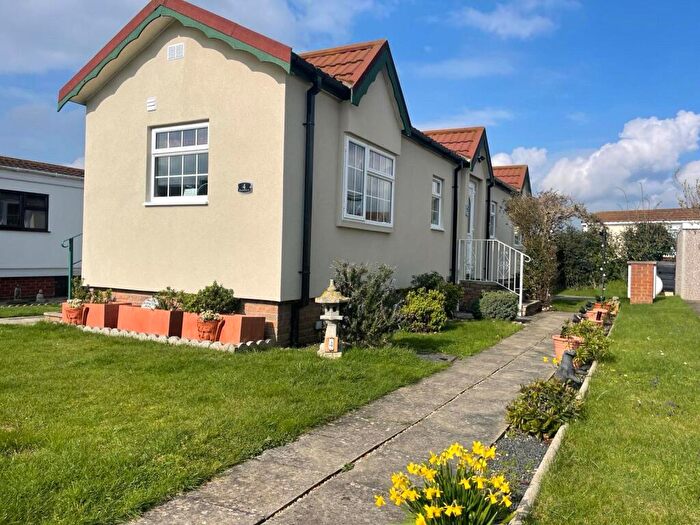
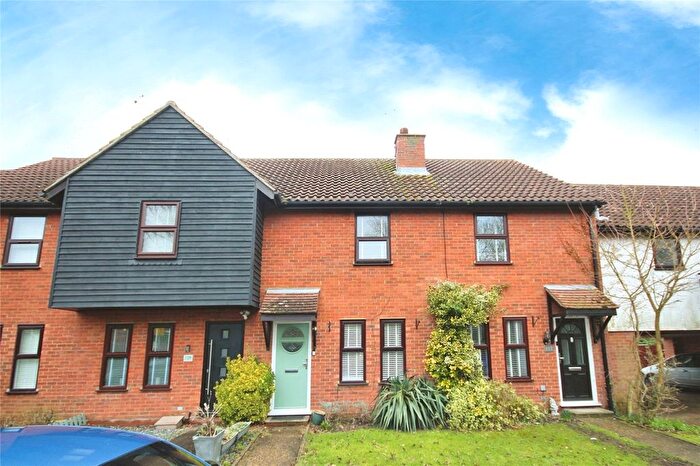
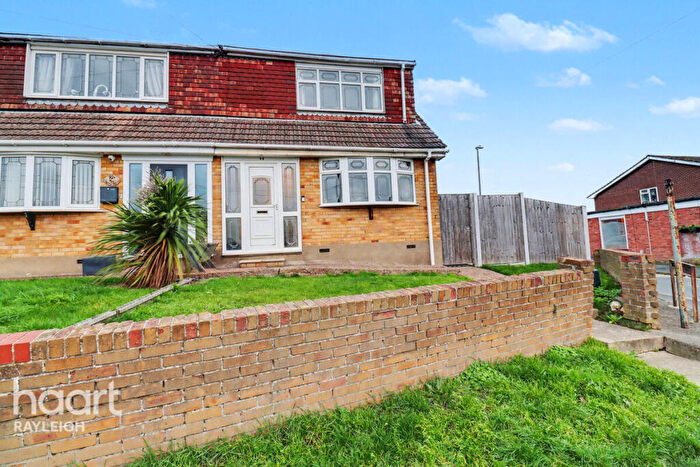
Houses for sale & to rent in Hullbridge, Hockley
House Prices in Hullbridge
Properties in Hullbridge have an average house price of £415,412.00 and had 208 Property Transactions within the last 3 years¹.
Hullbridge is an area in Hockley, Essex with 2,777 households², where the most expensive property was sold for £907,000.00.
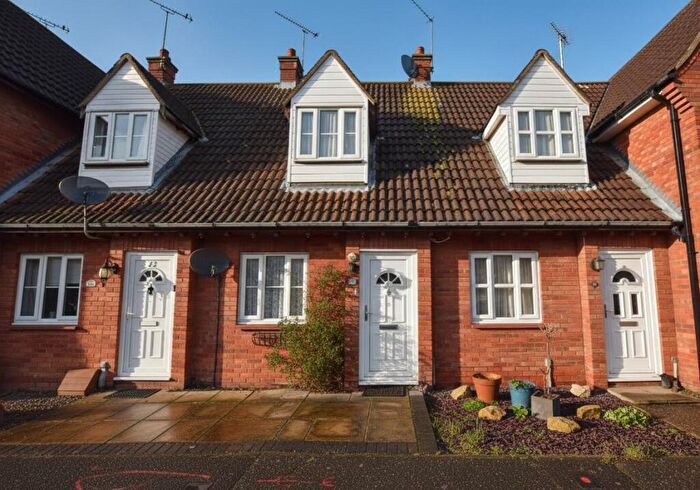
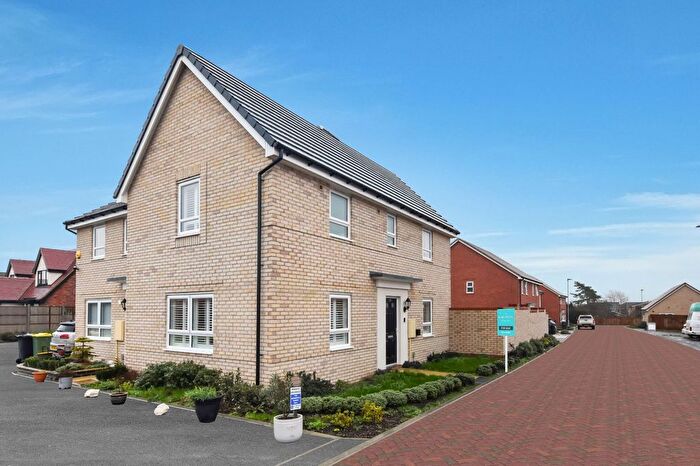
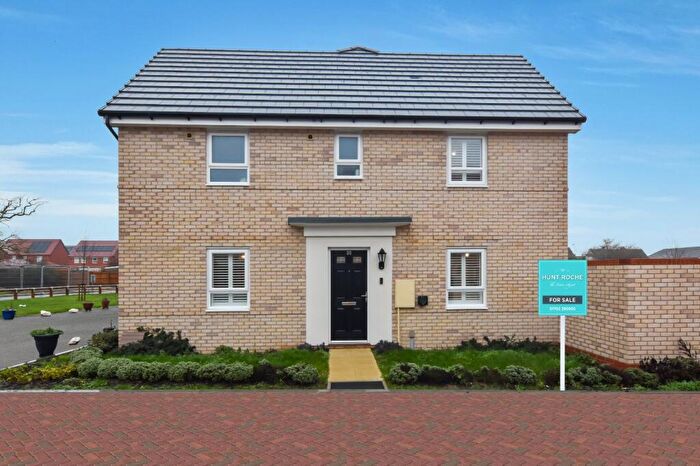
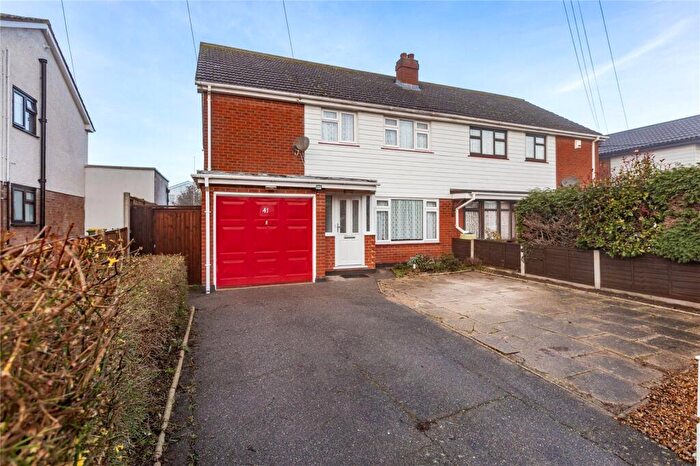
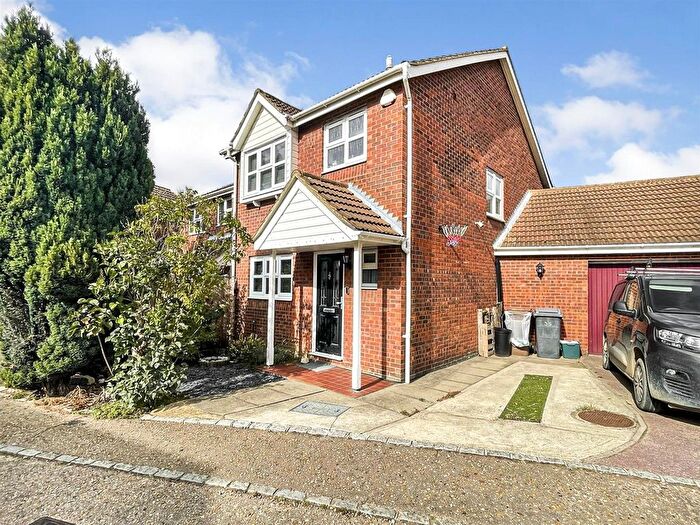
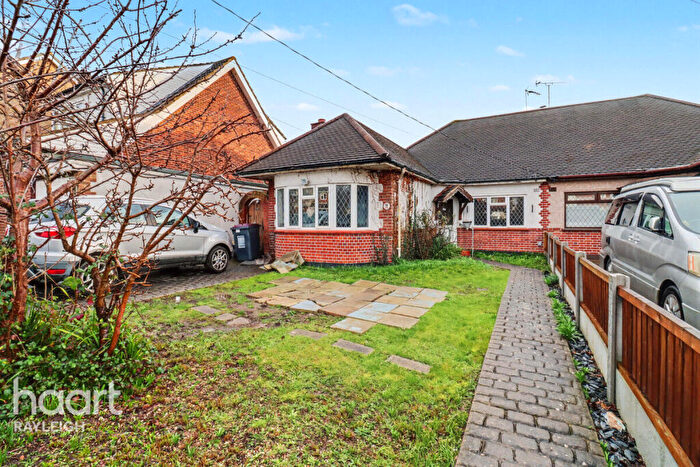
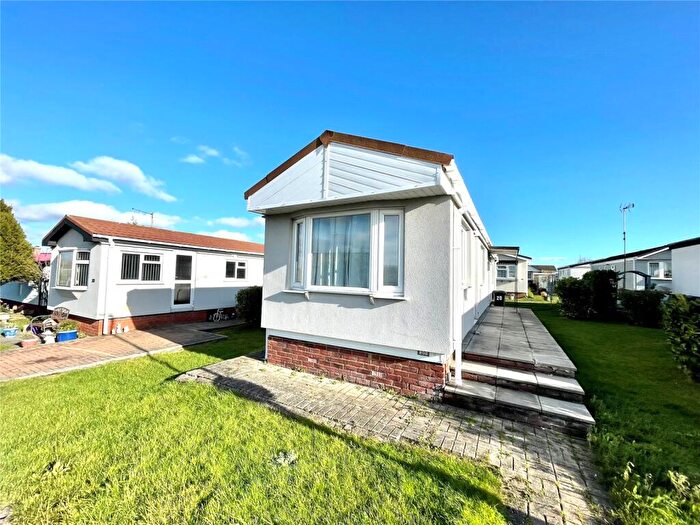
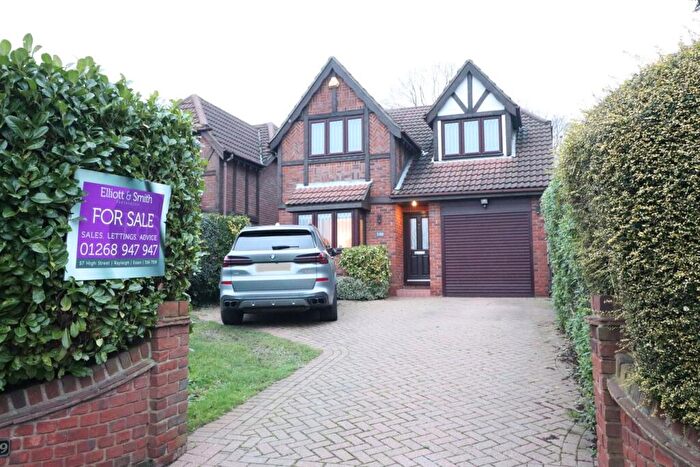
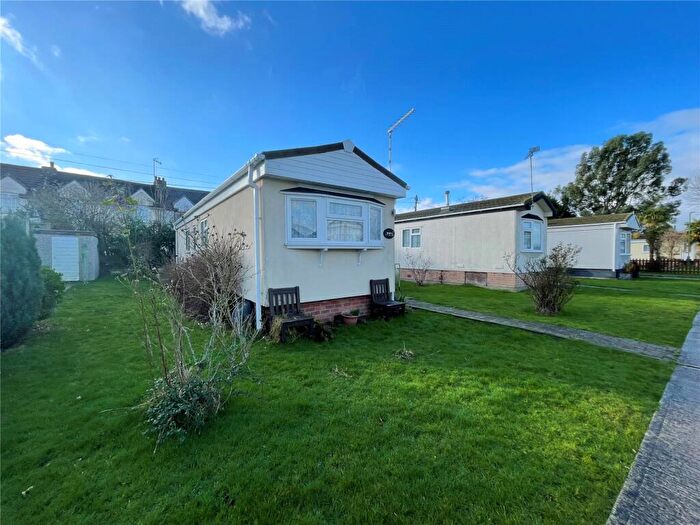
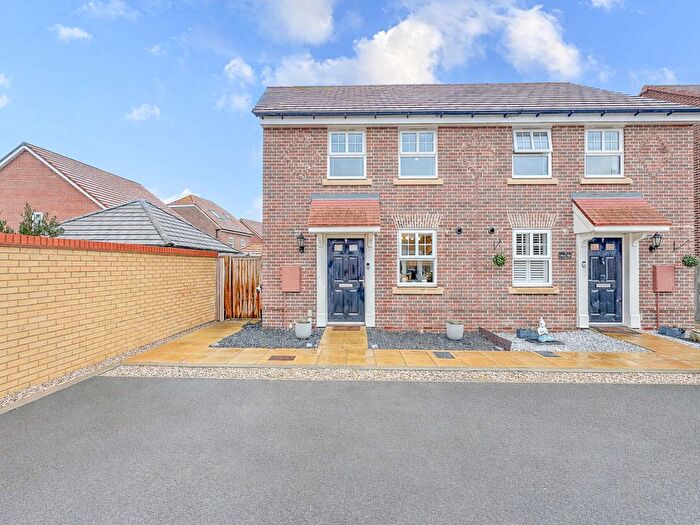
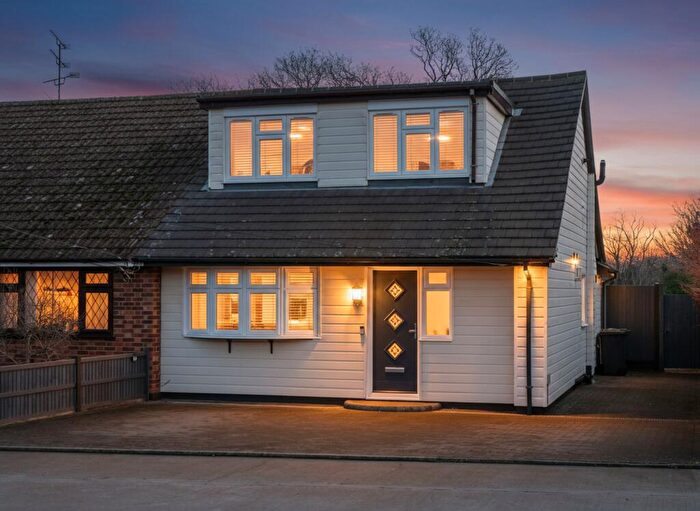
Properties for sale in Hullbridge
Roads and Postcodes in Hullbridge
Navigate through our locations to find the location of your next house in Hullbridge, Hockley for sale or to rent.
| Streets | Postcodes |
|---|---|
| Abbey Close | SS5 6DL |
| Abbey Road | SS5 6DG SS5 6DJ |
| Admiral Crescent | SS5 6FS |
| Alfreda Avenue | SS5 6LT |
| Almond Avenue | SS5 6PP |
| Ambleside Gardens | SS5 6ES |
| Ashdene Close | SS5 6JD |
| Bartons Avenue | SS5 6EH |
| Beech Road | SS5 6JF |
| Birchdale | SS5 6LY |
| Blountswood Road | SS5 6AD |
| Brandy Avenue | SS5 6EQ |
| Broom Road | SS5 6HN |
| Burlington Gardens | SS5 6BE |
| Burnham Road | SS5 6BG SS5 6BQ SS5 6HJ SS5 6HQ |
| Buttermere Gardens | SS5 6BZ |
| Cedar Drive | SS5 6JE |
| Central Avenue | SS5 6AT SS5 6AU SS5 6PR |
| Cherrydene Close | SS5 6HL |
| Coventry Close | SS5 6BB |
| Cranleigh Gardens | SS5 6DY |
| Creek View Avenue | SS5 6LU |
| Crouch Avenue | SS5 6BP SS5 6BS SS5 6HW |
| Crouch Meadow | SS5 6QF |
| Crouch Park | SS5 6PX SS5 6PY |
| Crouch View Grove | SS5 6LE |
| Elm Grove | SS5 6ER |
| Eveleigh Gardens | SS5 6EW |
| Ferry Road | SS5 6BY SS5 6DN SS5 6DP SS5 6EL SS5 6ET SS5 6EU SS5 6EX SS5 6EY SS5 6EZ SS5 6JH SS5 6JJ SS5 6JY SS5 6JZ SS5 6NA SS5 6ND |
| Fourth Avenue | SS5 6AZ |
| Freeman Road | SS5 6FD |
| Grasmere Avenue | SS5 6LB SS5 6LD SS5 6LF |
| Halcyon Park | SS5 6QA |
| Harrison Gardens | SS5 6JX |
| Hawes Close | SS5 6EF |
| High Elms Road | SS5 6HB |
| Highbank | SS5 6PN |
| Highfield | SS5 6PB |
| Highview | SS5 6PH |
| Hillcrest Avenue | SS5 6DB SS5 6HD SS5 6HE |
| Hilltop Avenue | SS5 6BL SS5 6BN |
| Hockley Mobile Homes | SS5 5NQ |
| Hockley Park | SS5 5NG |
| Horseshoe Lawns | SS5 6PL |
| Kendal Close | SS5 6DW |
| Keswick Avenue | SS5 6JL SS5 6JN SS5 6JP SS5 6JW |
| Kingsmans Farm Road | SS5 6QB SS5 6EP |
| Kingsway | SS5 6DR |
| Long Lane | SS5 6BA |
| Lower Road | SS5 6AJ SS5 6AP SS5 6AS SS5 6AW SS5 6BD SS5 6BH SS5 6BJ SS5 6DA SS5 6DD SS5 6DE SS5 6DF SS5 6AN |
| Lowlands Road | SS5 6EB |
| Main Road | SS5 6PW |
| Main Street | SS5 5NB |
| Malyons Lane | SS5 6EN SS5 6FH |
| Mapledene Avenue | SS5 6JB |
| Mayfield Avenue | SS5 6JG SS5 6JQ |
| Meadow Road | SS5 6BW |
| Minke Mews | SS5 6FR |
| Monksford Drive | SS5 6DQ |
| New Square | SS5 5NA |
| Oak Way Park | SS5 5NE |
| Oaklands | SS5 5FA |
| Oakleigh Avenue | SS5 6EJ |
| Padgetts Way | SS5 6LR |
| Pevensey Gardens | SS5 6AR |
| Pinewood Close | SS5 6HH |
| Pond Close | SS5 6PD |
| Poolehurst Walk | SS5 6PT |
| Pooles Lane | SS5 6PA SS5 6PU SS5 6PZ |
| Queen Annes Grove | SS5 6DS SS5 6DU |
| Queens Avenue | SS5 6PS |
| Ridgeway | SS5 6PQ |
| Riverview Gardens | SS5 6LS |
| Riverview Walk | SS5 6NH |
| Rosilian Drive | SS5 5LS |
| Rydal Close | SS5 6LA |
| Shangri La West Caravan Park | SS5 6QE |
| Smugglers Close | SS5 6FE |
| South Avenue | SS5 6HA |
| Sunshine Close | SS5 6PG |
| The Avenue | SS5 6LP SS5 5LY |
| The Close | SS5 5LX |
| The Dome Village | SS5 5LU |
| The Drive | SS5 6LN SS5 6LZ |
| The Embankment | SS5 5ND |
| The Esplanade | SS5 6LX |
| The Glen | SS5 6PJ |
| The Priories | SS5 6DH |
| The Promenade | SS5 6NF |
| The Spur | SS5 5LZ |
| The Walk | SS5 6LW |
| Thorpedene Avenue | SS5 6JA |
| Tower Side | SS5 6PF |
| Tyndale Close | SS5 6NB |
| Ullswater Drive | SS5 6EG |
| Wallace Close | SS5 6NE |
| Waxwell Road | SS5 6HF SS5 6HG |
| Wellington Avenue | SS5 6DT SS5 6DX |
| West Avenue | SS5 6JU |
| William Green | SS5 6PE |
| Windermere Avenue | SS5 6JR SS5 6JT |
Transport near Hullbridge
- FAQ
- Price Paid By Year
- Property Type Price
Frequently asked questions about Hullbridge
What is the average price for a property for sale in Hullbridge?
The average price for a property for sale in Hullbridge is £415,412. This amount is 7% lower than the average price in Hockley. There are 2,795 property listings for sale in Hullbridge.
What streets have the most expensive properties for sale in Hullbridge?
The streets with the most expensive properties for sale in Hullbridge are West Avenue at an average of £875,000, The Esplanade at an average of £726,012 and Alfreda Avenue at an average of £711,250.
What streets have the most affordable properties for sale in Hullbridge?
The streets with the most affordable properties for sale in Hullbridge are The Walk at an average of £196,750, Ferry Road at an average of £288,735 and Kendal Close at an average of £318,000.
Which train stations are available in or near Hullbridge?
Some of the train stations available in or near Hullbridge are South Woodham Ferrers, Hockley and Battlesbridge.
Property Price Paid in Hullbridge by Year
The average sold property price by year was:
| Year | Average Sold Price | Price Change |
Sold Properties
|
|---|---|---|---|
| 2025 | £445,362 | 10% |
54 Properties |
| 2024 | £402,114 | -2% |
94 Properties |
| 2023 | £409,291 | -9% |
60 Properties |
| 2022 | £446,297 | 7% |
99 Properties |
| 2021 | £414,670 | 9% |
121 Properties |
| 2020 | £377,462 | 8% |
66 Properties |
| 2019 | £348,442 | -8% |
95 Properties |
| 2018 | £375,748 | 8% |
104 Properties |
| 2017 | £345,335 | 12% |
94 Properties |
| 2016 | £303,635 | 3% |
92 Properties |
| 2015 | £295,525 | 8% |
98 Properties |
| 2014 | £273,335 | 11% |
81 Properties |
| 2013 | £244,309 | 13% |
79 Properties |
| 2012 | £213,762 | -2% |
53 Properties |
| 2011 | £218,612 | -12% |
58 Properties |
| 2010 | £245,331 | 12% |
56 Properties |
| 2009 | £215,012 | -2% |
80 Properties |
| 2008 | £218,343 | -20% |
64 Properties |
| 2007 | £261,304 | 11% |
116 Properties |
| 2006 | £231,416 | 8% |
96 Properties |
| 2005 | £213,658 | 3% |
74 Properties |
| 2004 | £206,348 | 4% |
90 Properties |
| 2003 | £197,978 | 19% |
105 Properties |
| 2002 | £160,595 | 15% |
121 Properties |
| 2001 | £136,568 | 13% |
93 Properties |
| 2000 | £118,659 | 23% |
105 Properties |
| 1999 | £91,610 | 3% |
117 Properties |
| 1998 | £88,920 | 14% |
75 Properties |
| 1997 | £76,349 | 12% |
104 Properties |
| 1996 | £66,891 | 7% |
85 Properties |
| 1995 | £62,157 | - |
77 Properties |
Property Price per Property Type in Hullbridge
Here you can find historic sold price data in order to help with your property search.
The average Property Paid Price for specific property types in the last three years are:
| Property Type | Average Sold Price | Sold Properties |
|---|---|---|
| Semi Detached House | £383,927.00 | 98 Semi Detached Houses |
| Detached House | £512,732.00 | 76 Detached Houses |
| Terraced House | £334,803.00 | 14 Terraced Houses |
| Flat | £256,300.00 | 20 Flats |

