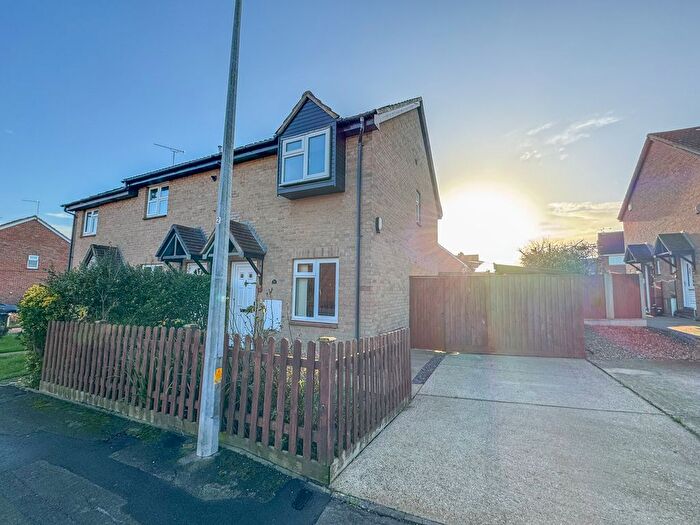
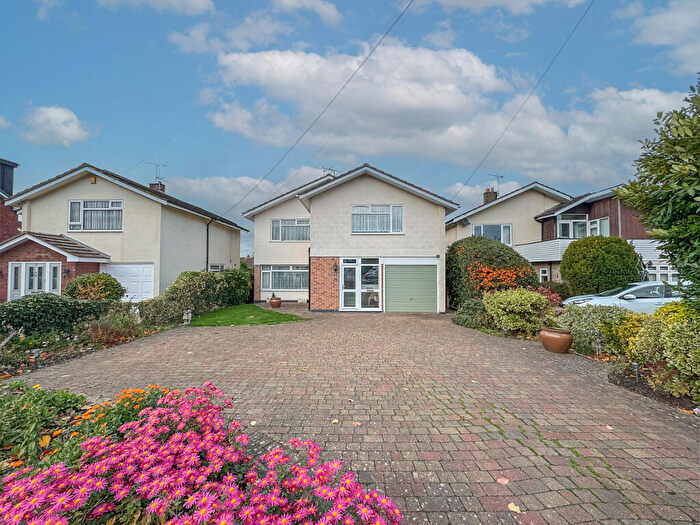
Houses for sale & to rent in Hockley West, Hockley
House Prices in Hockley West
Properties in Hockley West have an average house price of £555,767.00 and had 78 Property Transactions within the last 3 years¹.
Hockley West is an area in Hockley, Essex with 752 households², where the most expensive property was sold for £2,100,000.00.
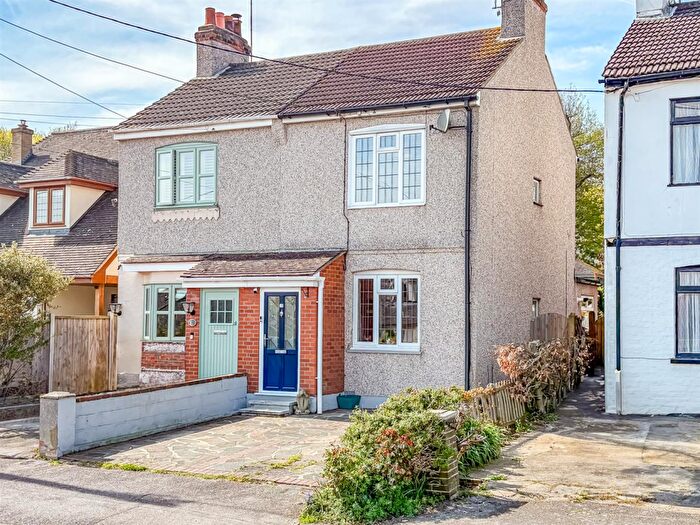
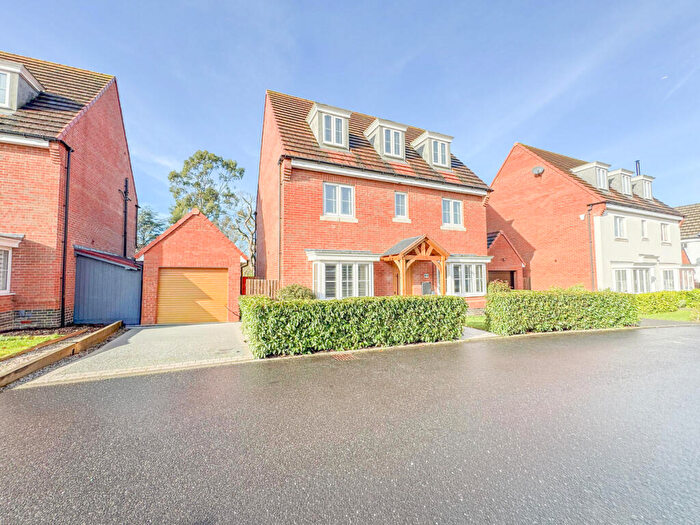
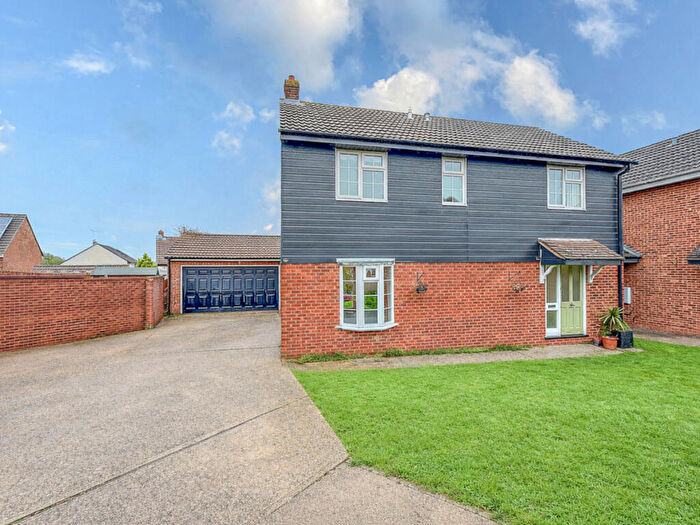
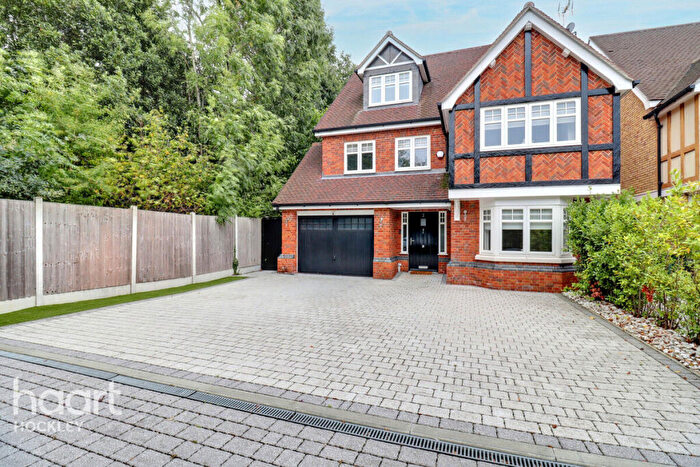
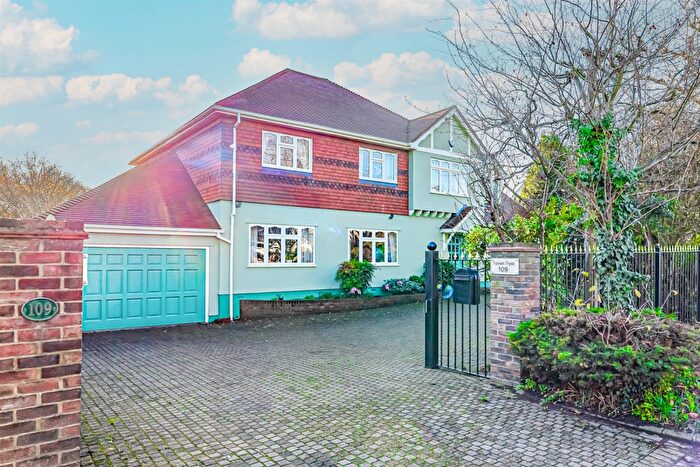
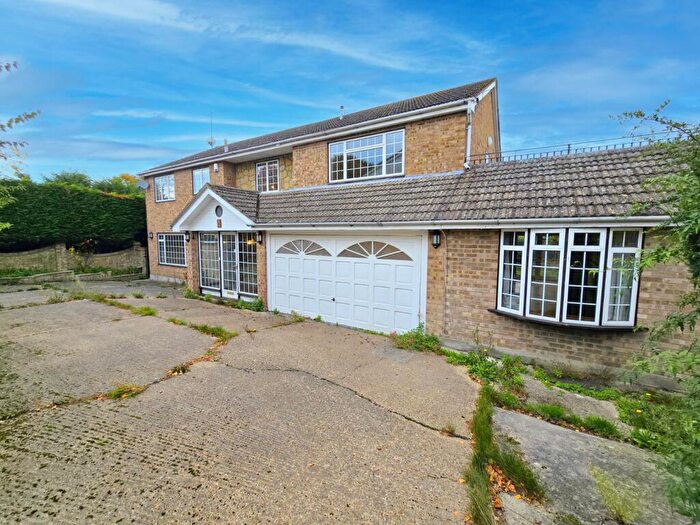
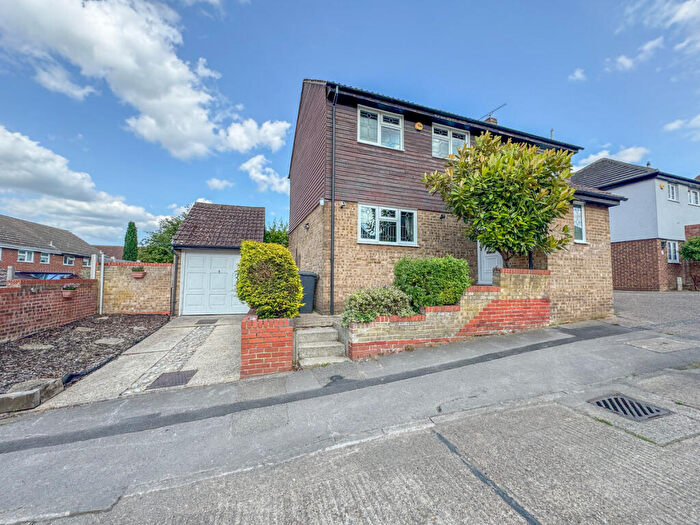
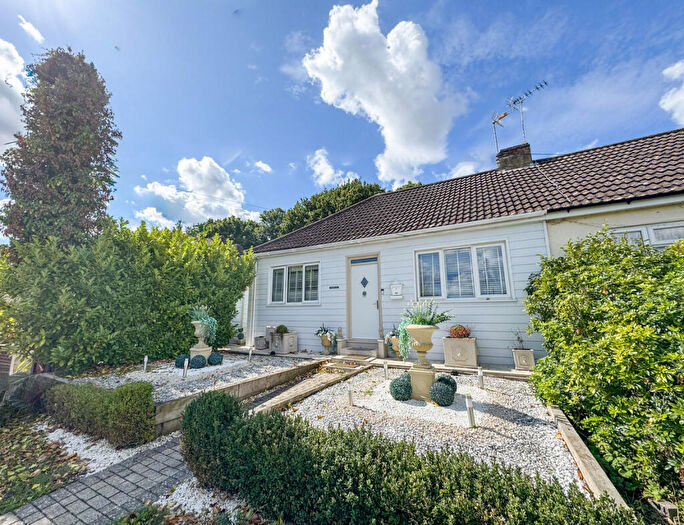
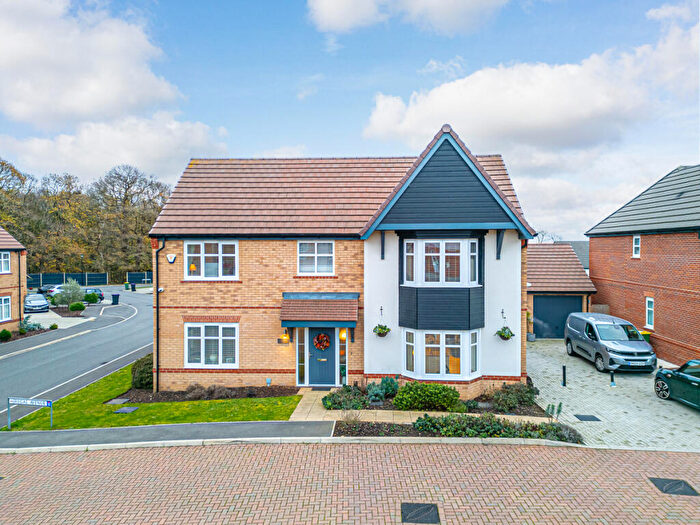
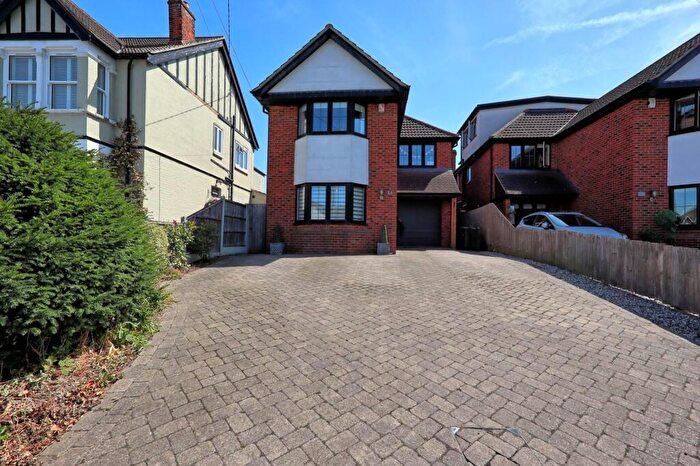
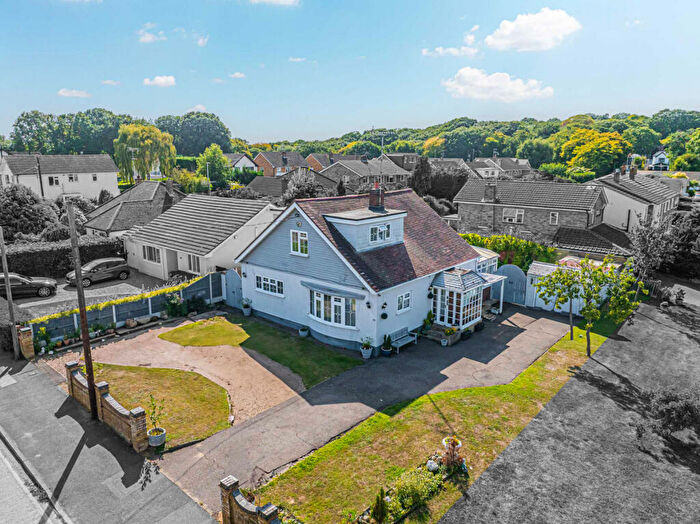
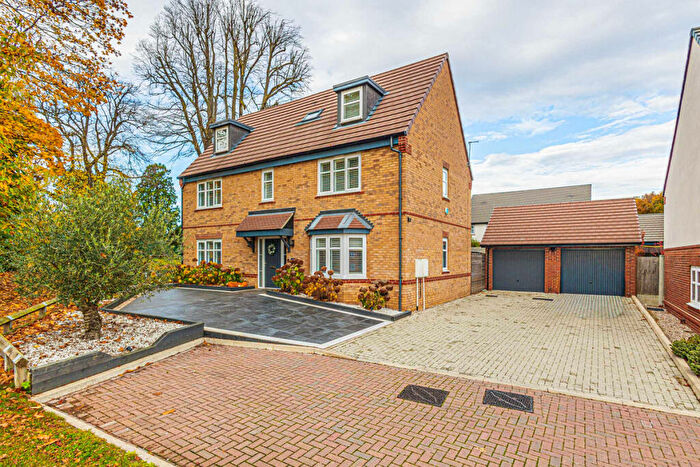
Properties for sale in Hockley West
Previously listed properties in Hockley West
Roads and Postcodes in Hockley West
Navigate through our locations to find the location of your next house in Hockley West, Hockley for sale or to rent.
| Streets | Postcodes |
|---|---|
| Aldermans Hill | SS5 4RP SS5 4RW |
| Badgers Mount | SS5 4SA |
| Balmoral Gardens | SS5 4UN |
| Belvedere Avenue | SS5 4UL |
| Bull Lane | SS5 4RH |
| Bullwood Approach | SS5 4RR |
| Bullwood Hall Lane | SS5 4TB |
| Chevening Gardens | SS5 4UR |
| Church Road | SS5 4SS SS5 6AE SS5 6AG |
| Crown Road | SS5 4RS |
| Folly Chase | SS5 4SF |
| Folly Lane | SS5 4SE SS5 4SJ SS5 4SR |
| Fountain Lane | SS5 4ST SS5 4SU |
| Gay Bowers | SS5 4SN |
| Hawthorne Gardens | SS5 4SW |
| High Road | SS5 4SX SS5 4SY SS5 4SZ SS5 4TA |
| Hillside Road | SS5 4RT |
| Kensington Way | SS5 4UH |
| Laburnum Close | SS5 4SH |
| Laburnum Grove | SS5 4SG SS5 4SQ |
| Lambeth Mews | SS5 4UQ |
| Lower Road | SS5 5LR SS5 5LT |
| Main Road | SS5 4RF SS5 4RG SS5 4RL |
| Manor Road | SS5 4RJ |
| Marlborough Walk | SS5 4UW |
| Merton Road | SS5 6AQ |
| Mey Walk | SS5 4UG |
| Murrels Lane | SS5 6AB |
| Osborne Avenue | SS5 4UJ SS5 4UU |
| Sandringham Avenue | SS5 4UF |
| Silvertree Close | SS5 4SP |
| St James Walk | SS5 4UP |
| St Peters Road | SS5 6AA |
| Sunnyfield Gardens | SS5 4SL |
| The Astors | SS5 4SB |
| The Mews | SS5 4RB |
| Turret Cottages | SS5 4TG |
| Wadham Park Avenue | SS5 6AL |
| Woodside Road | SS5 4RU |
Transport near Hockley West
-
Hockley Station
-
Rayleigh Station
-
Rochford Station
-
South Woodham Ferrers Station
-
Battlesbridge Station
-
North Fambridge Station
-
Southend Airport Station
-
Leigh-On-Sea Station
-
Chalkwell Station
-
Prittlewell Station
- FAQ
- Price Paid By Year
- Property Type Price
Frequently asked questions about Hockley West
What is the average price for a property for sale in Hockley West?
The average price for a property for sale in Hockley West is £555,767. This amount is 24% higher than the average price in Hockley. There are 641 property listings for sale in Hockley West.
What streets have the most expensive properties for sale in Hockley West?
The streets with the most expensive properties for sale in Hockley West are Folly Chase at an average of £1,565,000, High Road at an average of £823,333 and Folly Lane at an average of £755,625.
What streets have the most affordable properties for sale in Hockley West?
The streets with the most affordable properties for sale in Hockley West are Manor Road at an average of £370,281, Mey Walk at an average of £376,500 and Aldermans Hill at an average of £406,928.
Which train stations are available in or near Hockley West?
Some of the train stations available in or near Hockley West are Hockley, Rayleigh and Rochford.
Property Price Paid in Hockley West by Year
The average sold property price by year was:
| Year | Average Sold Price | Price Change |
Sold Properties
|
|---|---|---|---|
| 2025 | £548,926 | -19% |
32 Properties |
| 2024 | £652,575 | 25% |
20 Properties |
| 2023 | £489,719 | -42% |
26 Properties |
| 2022 | £693,173 | 14% |
26 Properties |
| 2021 | £599,402 | 7% |
46 Properties |
| 2020 | £557,229 | 11% |
24 Properties |
| 2019 | £496,439 | -5% |
33 Properties |
| 2018 | £520,378 | 11% |
37 Properties |
| 2017 | £464,481 | -6% |
27 Properties |
| 2016 | £493,012 | 13% |
38 Properties |
| 2015 | £430,968 | 24% |
32 Properties |
| 2014 | £326,514 | -10% |
34 Properties |
| 2013 | £357,647 | 21% |
27 Properties |
| 2012 | £283,937 | -43% |
16 Properties |
| 2011 | £406,269 | 31% |
26 Properties |
| 2010 | £281,374 | 10% |
24 Properties |
| 2009 | £253,617 | -31% |
29 Properties |
| 2008 | £331,557 | 3% |
26 Properties |
| 2007 | £321,103 | -15% |
39 Properties |
| 2006 | £368,001 | 5% |
36 Properties |
| 2005 | £349,632 | 19% |
41 Properties |
| 2004 | £284,629 | -10% |
27 Properties |
| 2003 | £313,123 | 34% |
32 Properties |
| 2002 | £208,223 | -1% |
43 Properties |
| 2001 | £211,076 | 7% |
36 Properties |
| 2000 | £195,926 | 28% |
41 Properties |
| 1999 | £140,386 | 16% |
35 Properties |
| 1998 | £117,896 | 12% |
32 Properties |
| 1997 | £103,912 | 1% |
35 Properties |
| 1996 | £102,568 | -37% |
51 Properties |
| 1995 | £140,128 | - |
26 Properties |
Property Price per Property Type in Hockley West
Here you can find historic sold price data in order to help with your property search.
The average Property Paid Price for specific property types in the last three years are:
| Property Type | Average Sold Price | Sold Properties |
|---|---|---|
| Semi Detached House | £438,673.00 | 37 Semi Detached Houses |
| Detached House | £702,595.00 | 36 Detached Houses |
| Terraced House | £420,000.00 | 3 Terraced Houses |
| Flat | £282,750.00 | 2 Flats |

