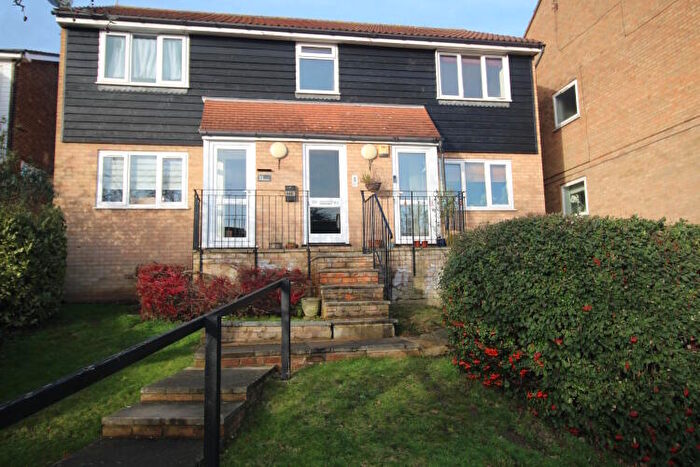
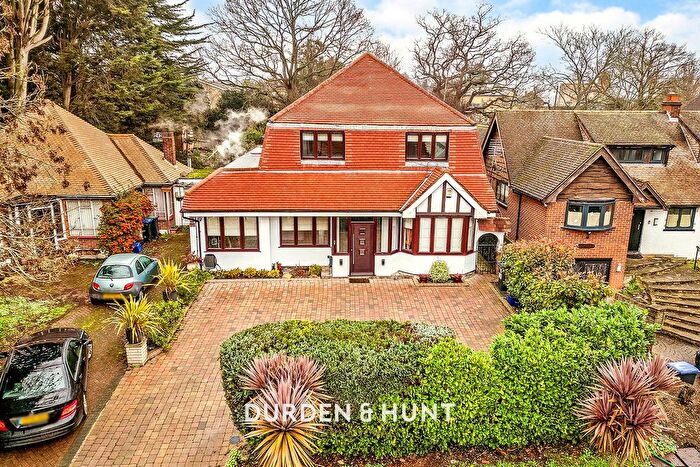
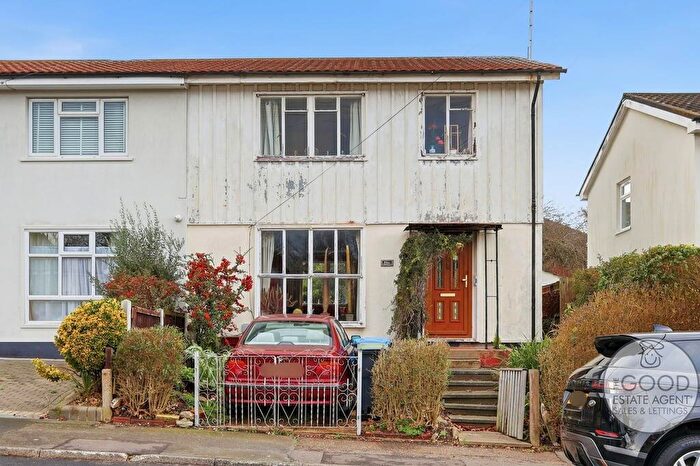
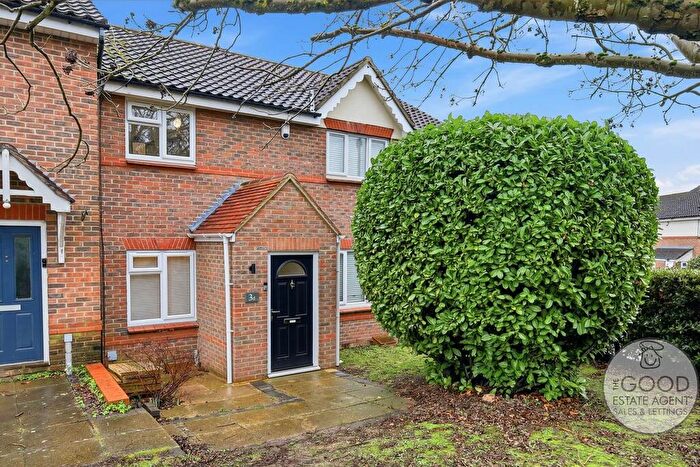
Houses for sale & to rent in Loughton, Essex
House Prices in Loughton
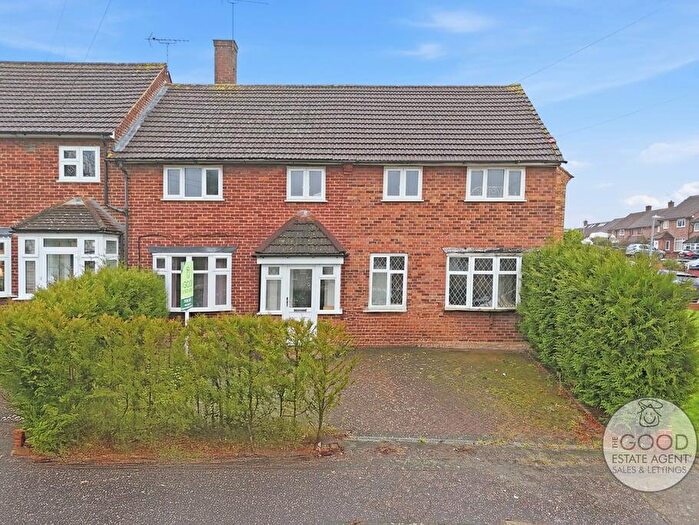
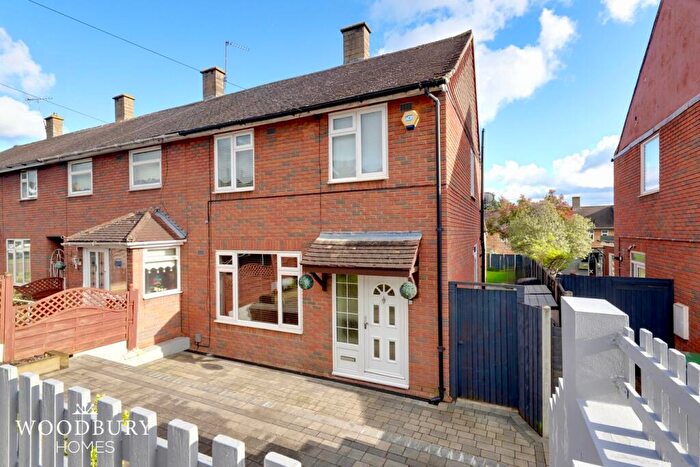
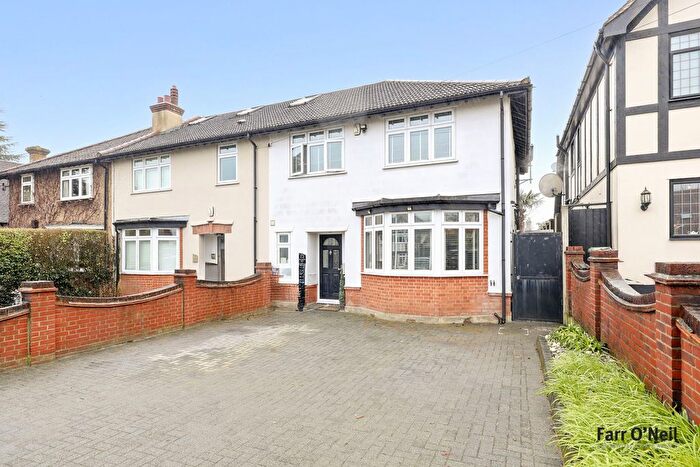
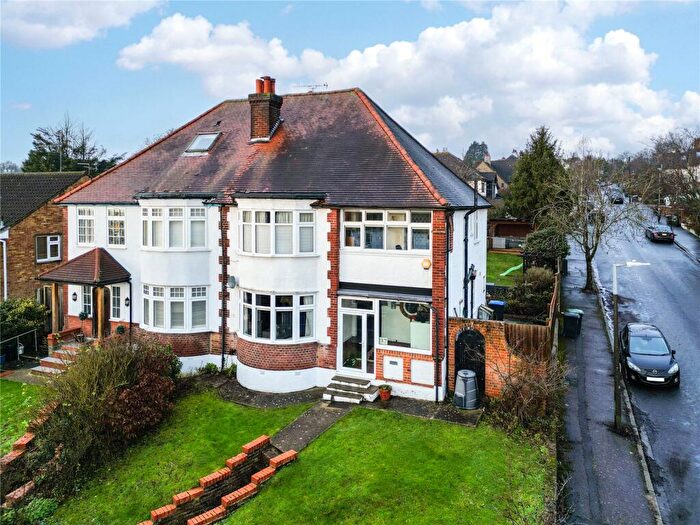
Properties in Loughton have an average house price of £600,418.00 and had 1,168 Property Transactions within the last 3 years.¹
Loughton is an area in Essex with 13,150 households², where the most expensive property was sold for £3,350,000.00.
Properties for sale in Loughton
Neighbourhoods in Loughton
Navigate through our locations to find the location of your next house in Loughton, Essex for sale or to rent.
Transport in Loughton
Please see below transportation links in this area:
-
Loughton Station
-
Debden Station
-
Buckhurst Hill Station
-
Chigwell Station
-
Theydon Bois Station
-
Roding Valley Station
-
Grange Hill Station
-
Chingford Station
- FAQ
- Price Paid By Year
- Property Type Price
Frequently asked questions about Loughton
What is the average price for a property for sale in Loughton?
The average price for a property for sale in Loughton is £600,418. This amount is 48% higher than the average price in Essex. There are 4,435 property listings for sale in Loughton.
What locations have the most expensive properties for sale in Loughton?
The locations with the most expensive properties for sale in Loughton are Waltham Abbey High Beach at an average of £934,178, Loughton Forest at an average of £811,552 and Loughton St Marys at an average of £778,792.
What locations have the most affordable properties for sale in Loughton?
The locations with the most affordable properties for sale in Loughton are Loughton Broadway at an average of £414,800, Loughton Fairmead at an average of £441,561 and Loughton Alderton at an average of £457,749.
Which train stations are available in or near Loughton?
The train station available in or near Loughton is Chingford.
Which tube stations are available in or near Loughton?
Some of the tube stations available in or near Loughton are Loughton, Debden and Buckhurst Hill.
Property Price Paid in Loughton by Year
The average sold property price by year was:
| Year | Average Sold Price | Price Change |
Sold Properties
|
|---|---|---|---|
| 2025 | £617,678 | 0,3% |
405 Properties |
| 2024 | £615,787 | 9% |
406 Properties |
| 2023 | £563,358 | -8% |
357 Properties |
| 2022 | £610,673 | 2% |
490 Properties |
| 2021 | £599,549 | 4% |
657 Properties |
| 2020 | £574,898 | 3% |
445 Properties |
| 2019 | £556,155 | 6% |
466 Properties |
| 2018 | £524,765 | 4% |
527 Properties |
| 2017 | £504,016 | 3% |
584 Properties |
| 2016 | £486,962 | 5% |
544 Properties |
| 2015 | £461,343 | 11% |
545 Properties |
| 2014 | £412,051 | 5% |
607 Properties |
| 2013 | £392,950 | 13% |
528 Properties |
| 2012 | £342,313 | -0,1% |
469 Properties |
| 2011 | £342,570 | 6% |
487 Properties |
| 2010 | £321,280 | -1% |
466 Properties |
| 2009 | £323,012 | 4% |
421 Properties |
| 2008 | £308,728 | -4% |
369 Properties |
| 2007 | £320,336 | 5% |
720 Properties |
| 2006 | £305,822 | 8% |
780 Properties |
| 2005 | £281,442 | 1% |
669 Properties |
| 2004 | £278,471 | 7% |
809 Properties |
| 2003 | £259,329 | 15% |
674 Properties |
| 2002 | £220,434 | 16% |
806 Properties |
| 2001 | £185,389 | 7% |
714 Properties |
| 2000 | £173,313 | 15% |
632 Properties |
| 1999 | £147,202 | 8% |
759 Properties |
| 1998 | £135,902 | 10% |
759 Properties |
| 1997 | £122,597 | 14% |
769 Properties |
| 1996 | £105,937 | 2% |
749 Properties |
| 1995 | £103,527 | - |
521 Properties |
Property Price per Property Type in Loughton
Here you can find historic sold price data in order to help with your property search.
The average Property Paid Price for specific property types in the last three years are:
| Property Type | Average Sold Price | Sold Properties |
|---|---|---|
| Semi Detached House | £647,590.00 | 324 Semi Detached Houses |
| Detached House | £1,127,752.00 | 178 Detached Houses |
| Terraced House | £515,035.00 | 395 Terraced Houses |
| Flat | £322,104.00 | 271 Flats |

