
Houses for sale & to rent in Woodford Green, Redbridge London Borough
House Prices in Woodford Green
Properties in this part of Woodford Green within the Redbridge London Borough have an average house price of £644,671.00 and had 1,378 Property Transactions within the last 3 years.¹ This area has 11,995 households² , where the most expensive property was sold for £3,600,000.00.
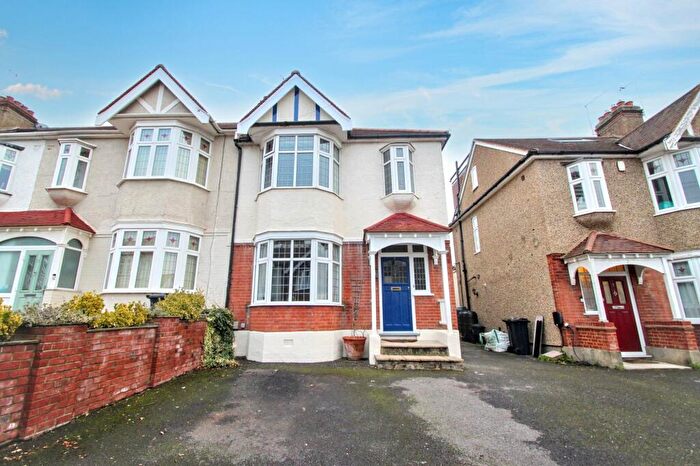
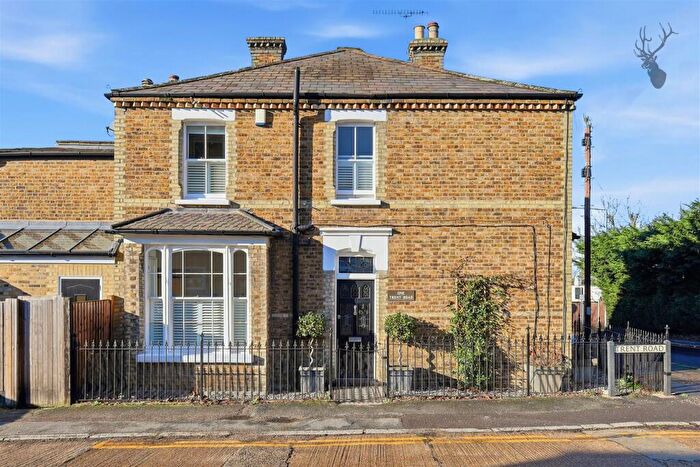
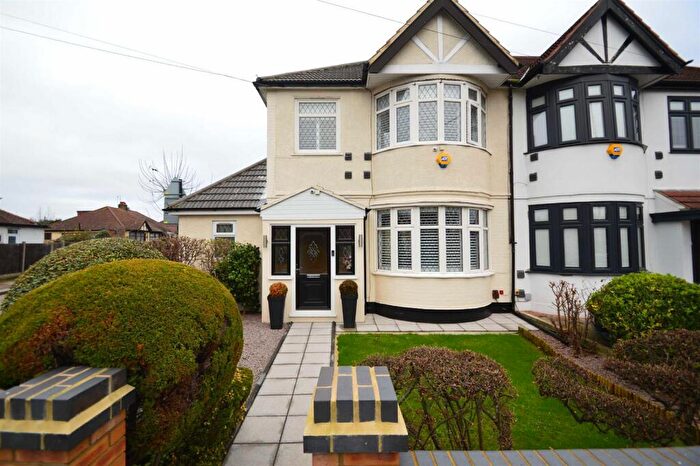
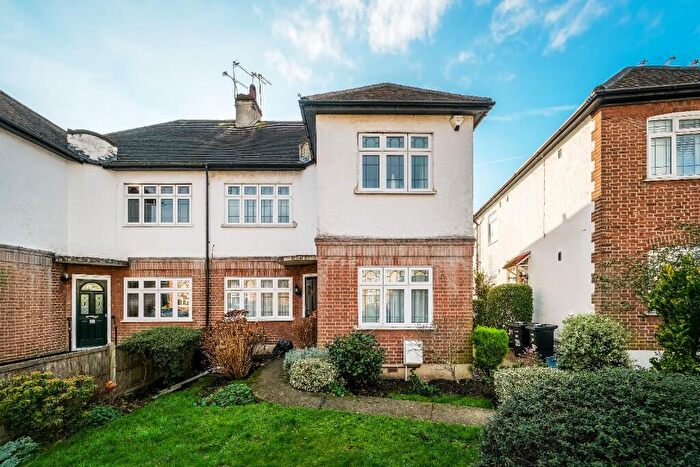
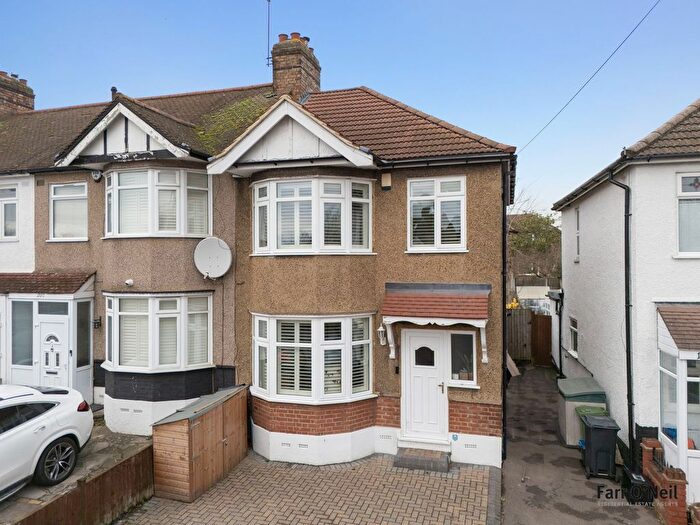
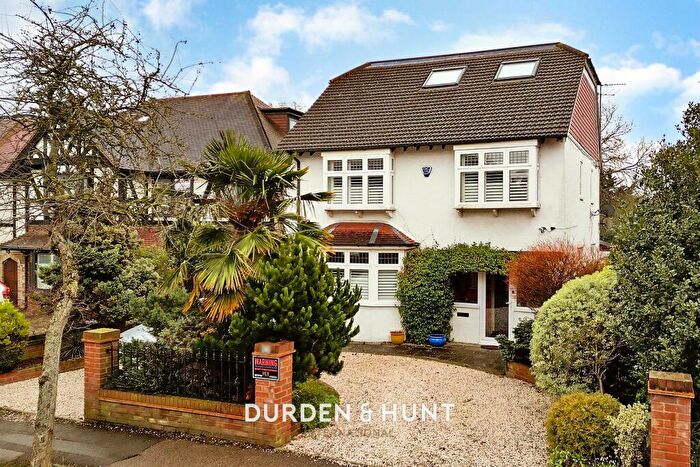
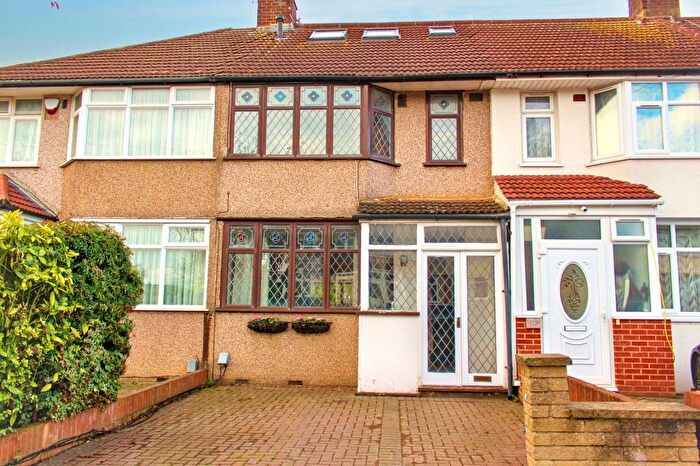
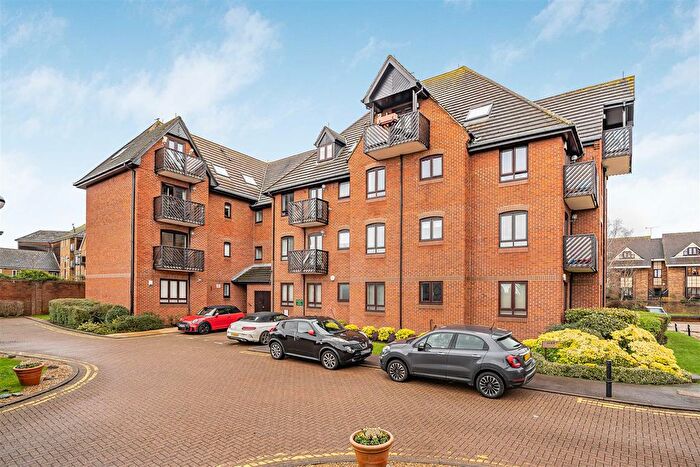
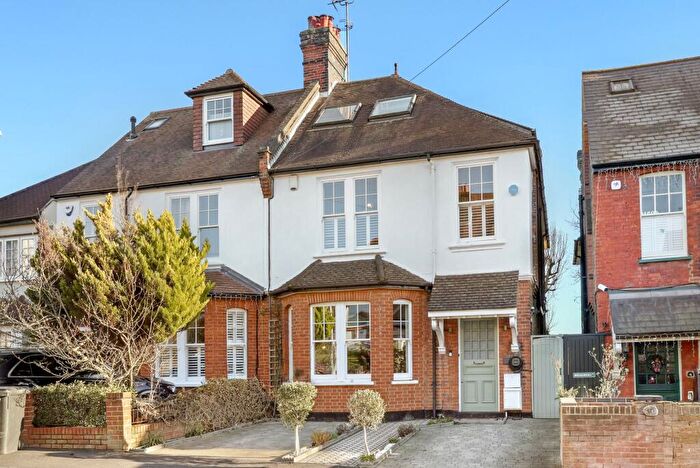
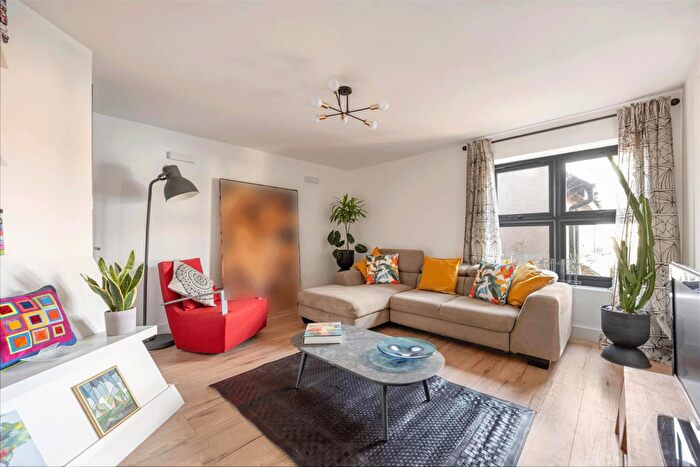
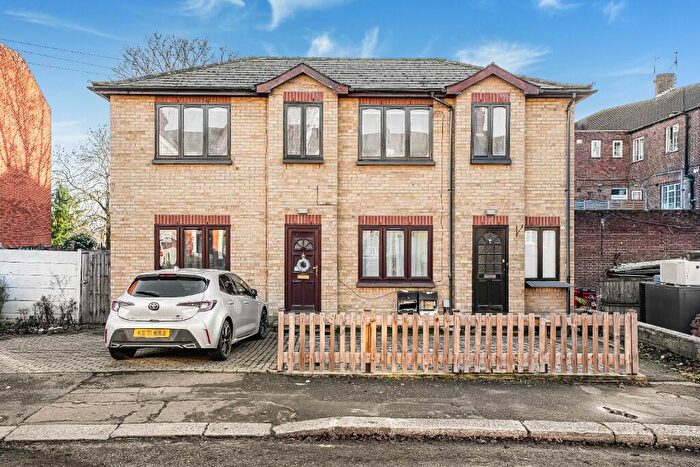
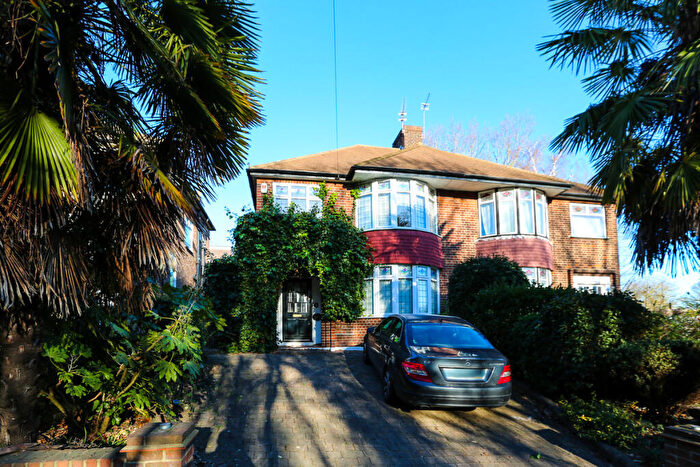
Properties for sale in Woodford Green
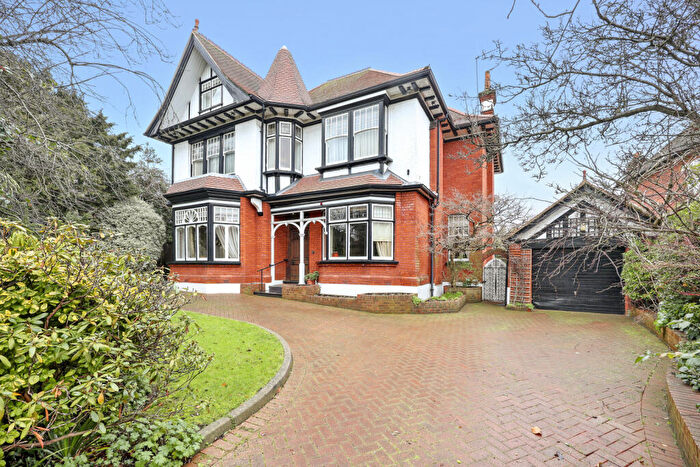
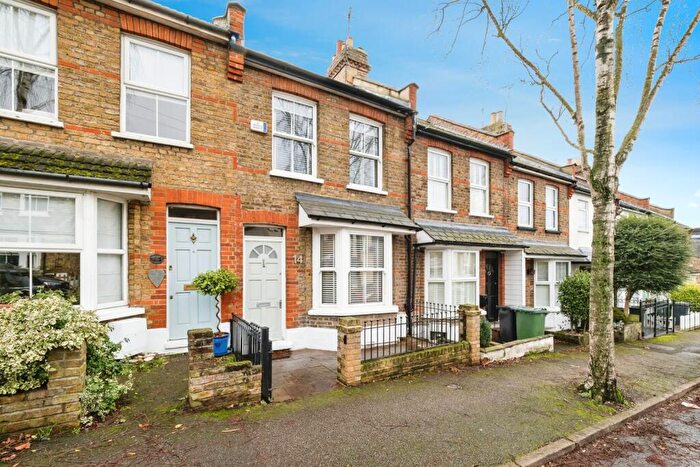
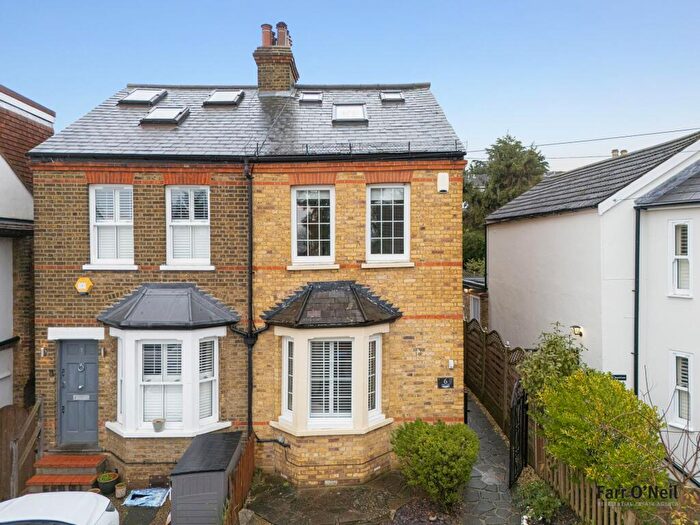
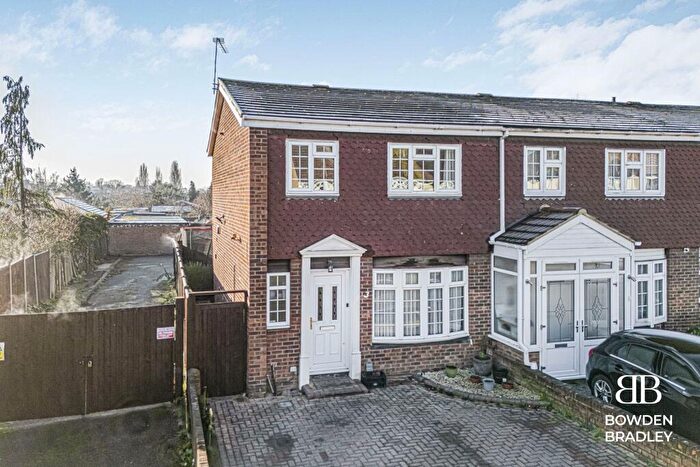
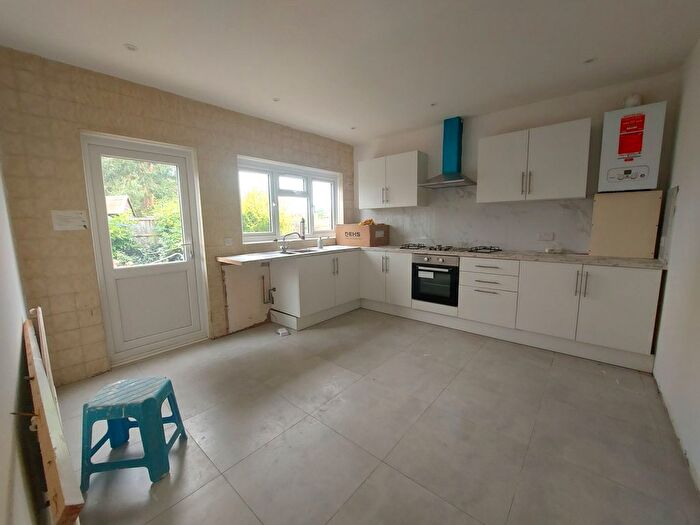
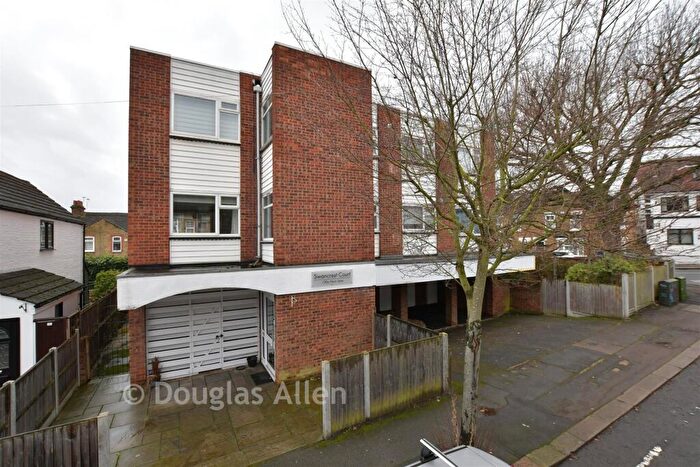
![]()
If you are looking to sell your house, let it out, or receive a property valuation, an expert can help you.
Click the button below to get started.
Neighbourhoods in Woodford Green
Navigate through our locations to find the location of your next house in Woodford Green, Redbridge London Borough for sale or to rent.
Transport in Woodford Green
Please see below transportation links in this area:
-
 Woodford Station
 -
Roding Valley Station
-
South Woodford Station
-
Buckhurst Hill Station
-

 Highams Park Station
 -
Chigwell Station
-
Snaresbrook Station
-
Chingford Station
-
Redbridge Station
-
Wood Street Station
- FAQ
- Price Paid By Year
- Property Type Price
Frequently asked questions about Woodford Green
What is the average price for a property for sale in Woodford Green?
The average price for a property for sale in Woodford Green is £644,671. This amount is 22% higher than the average price in Redbridge London Borough. There are 5,701 property listings for sale in Woodford Green.
What locations have the most expensive properties for sale in Woodford Green?
The locations with the most expensive properties for sale in Woodford Green are Fairlop at an average of £864,064, Monkhams at an average of £769,309 and Church End at an average of £747,044.
What locations have the most affordable properties for sale in Woodford Green?
The locations with the most affordable properties for sale in Woodford Green are Churchfields at an average of £138,333, Roding at an average of £506,954 and Bridge at an average of £516,291.
Which train stations are available in or near Woodford Green?
Some of the train stations available in or near Woodford Green are Highams Park, Chingford and Wood Street.
Which tube stations are available in or near Woodford Green?
Some of the tube stations available in or near Woodford Green are Woodford, Roding Valley and South Woodford.
Property Price Paid in Woodford Green by Year
The average sold property price by year was:
| Year | Average Sold Price | Price Change |
Sold Properties
|
|---|---|---|---|
| 2025 | £661,449 | 3% |
222 Properties |
| 2024 | £638,510 | -2% |
394 Properties |
| 2023 | £653,788 | 3% |
314 Properties |
| 2022 | £635,383 | 3% |
448 Properties |
| 2021 | £613,995 | 4% |
551 Properties |
| 2020 | £587,876 | 5% |
305 Properties |
| 2019 | £561,162 | -5% |
391 Properties |
| 2018 | £587,361 | 4% |
351 Properties |
| 2017 | £561,558 | 10% |
406 Properties |
| 2016 | £507,512 | 4% |
433 Properties |
| 2015 | £487,695 | 10% |
522 Properties |
| 2014 | £439,854 | 7% |
545 Properties |
| 2013 | £408,088 | 8% |
481 Properties |
| 2012 | £376,985 | -3% |
375 Properties |
| 2011 | £389,709 | 1% |
367 Properties |
| 2010 | £387,619 | 11% |
430 Properties |
| 2009 | £343,817 | -3% |
327 Properties |
| 2008 | £352,636 | -2% |
360 Properties |
| 2007 | £358,206 | 10% |
619 Properties |
| 2006 | £320,779 | 6% |
731 Properties |
| 2005 | £300,057 | 3% |
572 Properties |
| 2004 | £291,576 | 6% |
684 Properties |
| 2003 | £274,323 | 4% |
639 Properties |
| 2002 | £262,279 | 16% |
805 Properties |
| 2001 | £221,165 | 9% |
742 Properties |
| 2000 | £202,344 | 29% |
585 Properties |
| 1999 | £143,763 | 10% |
697 Properties |
| 1998 | £129,534 | 10% |
566 Properties |
| 1997 | £116,659 | -4% |
645 Properties |
| 1996 | £121,585 | 12% |
604 Properties |
| 1995 | £106,650 | - |
456 Properties |
Property Price per Property Type in Woodford Green
Here you can find historic sold price data in order to help with your property search.
The average Property Paid Price for specific property types in the last three years are:
| Property Type | Average Sold Price | Sold Properties |
|---|---|---|
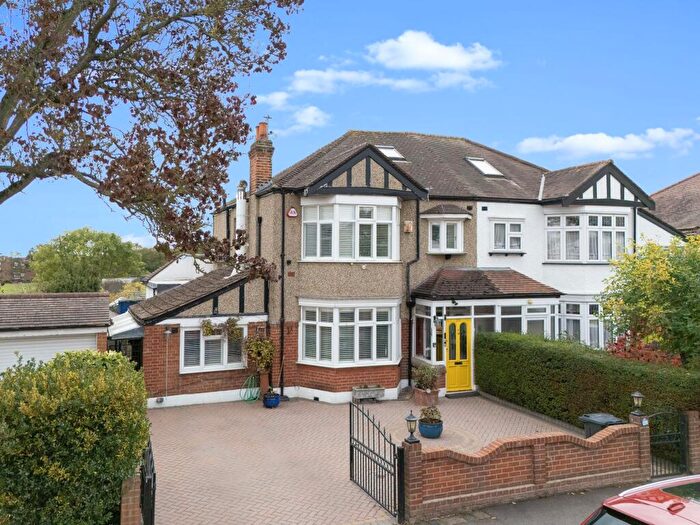
| Semi Detached House | £774,282.00 | 351 Semi Detached Houses |
| Detached House | £1,259,915.00 | 141 Detached Houses |
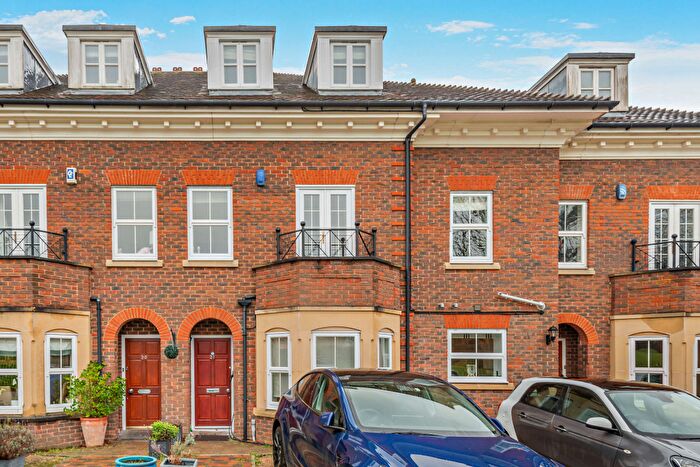
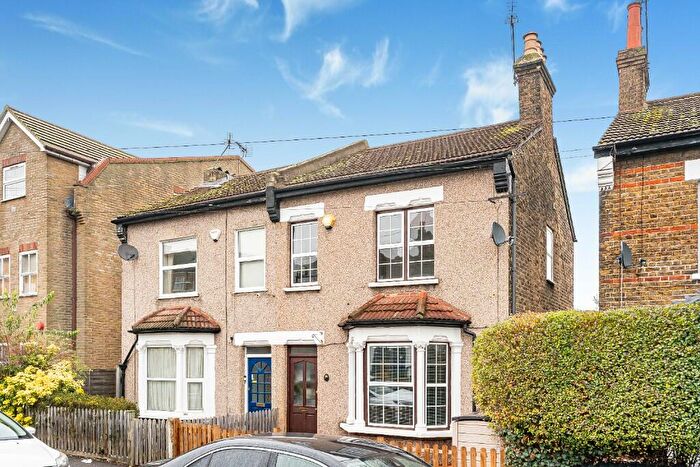
| Terraced House | £596,659.00 | 467 Terraced Houses |
| Flat | £382,566.00 | 419 Flats |