Houses for sale & to rent in Lawford, Manningtree
House Prices in Lawford
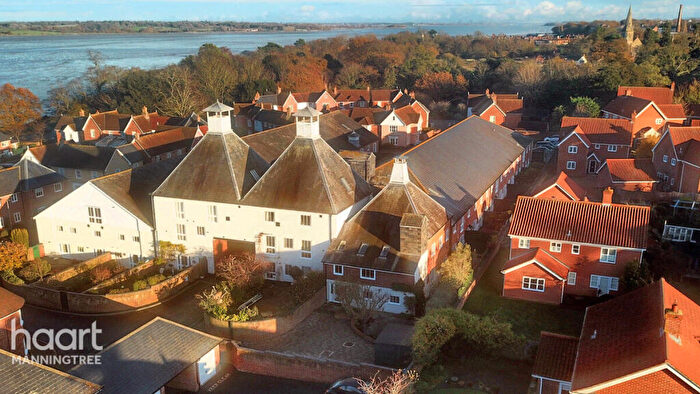
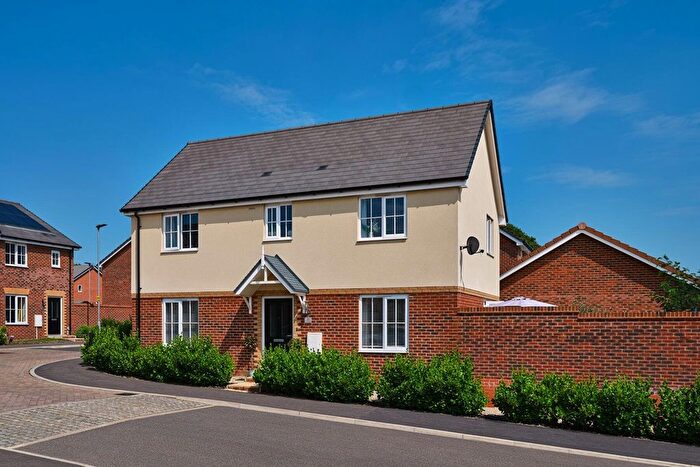
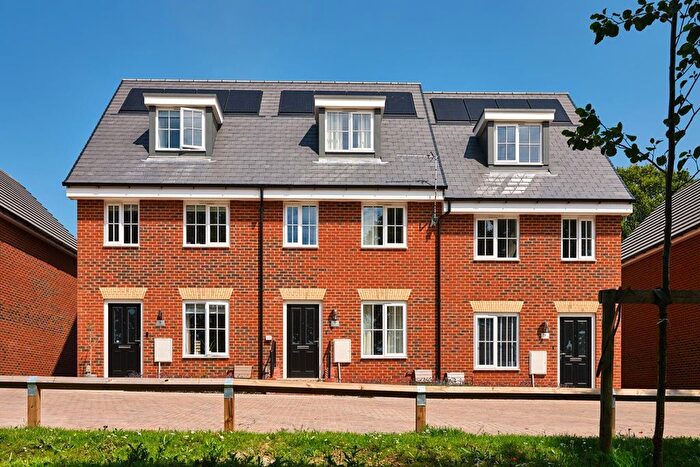
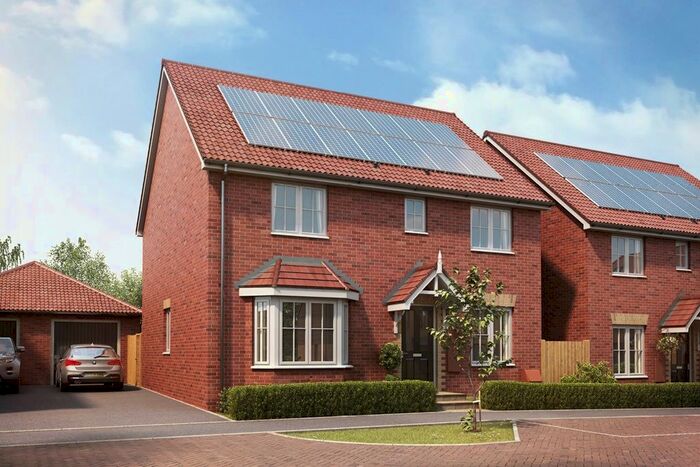
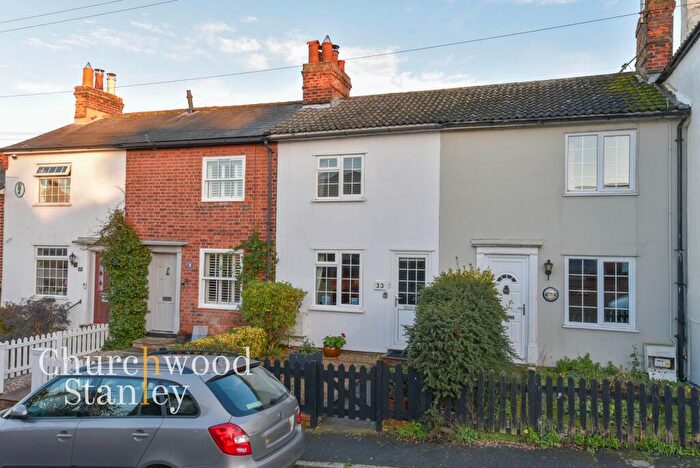
Properties in Lawford have an average house price of £341,276.00 and had 220 Property Transactions within the last 3 years¹.
Lawford is an area in Manningtree, Essex with 1,760 households², where the most expensive property was sold for £1,265,000.00.
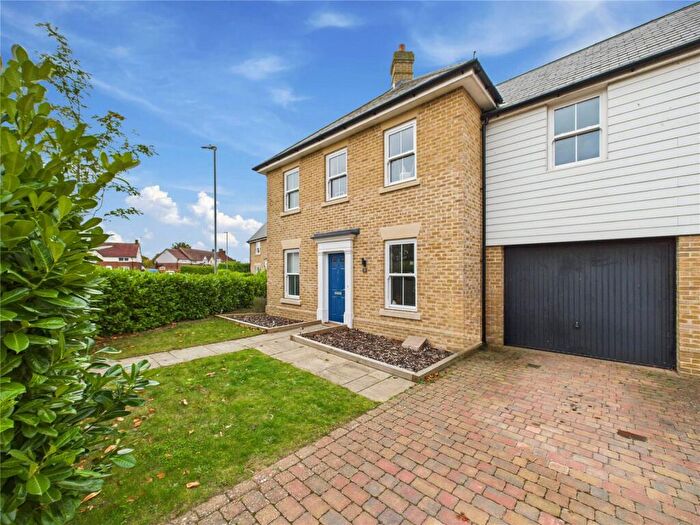
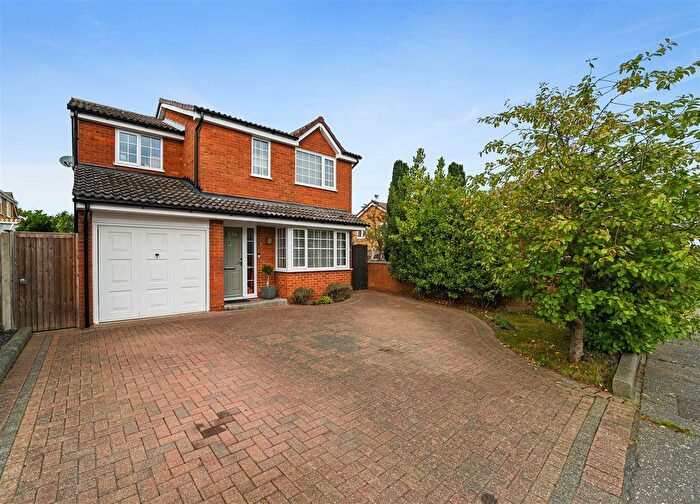
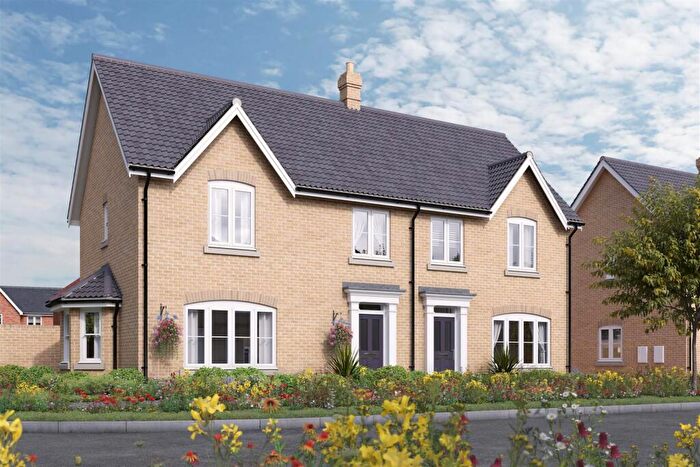
Properties for sale in Lawford
Roads and Postcodes in Lawford
Navigate through our locations to find the location of your next house in Lawford, Manningtree for sale or to rent.
| Streets | Postcodes |
|---|---|
| Aldhams Cottages | CO11 2NE |
| Barker Close | CO11 2JW |
| Blake Close | CO11 2JR |
| Bromley Road | CO11 2JE |
| Burrows Close | CO11 2HE |
| Cavendish Drive | CO11 2EX CO11 2EY |
| Cedar Crescent | CO11 2BS |
| Church Hill | CO11 2JX |
| Claude Oliver Close | CO11 2AS |
| Colchester Road | CO11 2BA CO11 2BH CO11 2BJ CO11 2BN CO11 2BP CO11 2BT CO11 2BU |
| Constable Close | CO11 2LD |
| Cornford Way | CO11 2SY |
| Cornwall Close | CO11 2ES |
| Cotman Avenue | CO11 2HB CO11 2LB |
| Dixon Close | CO11 2HA |
| Edgefield Avenue | CO11 2HD |
| Fitzgerald Close | CO11 2JT |
| Gainsborough Drive | CO11 2JU CO11 2LF |
| Grange Road | CO11 2JB CO11 2ND |
| Harvey Close | CO11 2HW |
| Harwich Road | CO11 2JS CO11 2LP CO11 2LS |
| Hughes Stanton Way | CO11 2HQ |
| Hungerdown Lane | CO11 2JN CO11 2LX CO11 2LY |
| Hunter Drive | CO11 2EJ |
| Keating Close | CO11 2HF |
| Kings Close | CO11 1EP |
| Knights Close | CO11 1EN |
| Lawford Place | CO11 2PT |
| Linden Close | CO11 2ET |
| Long Road | CO11 2EE CO11 2EF CO11 2HR CO11 2HS |
| Lydgate Close | CO11 2SU |
| Meadway | CO11 2EP CO11 2ER |
| Merivale Close | CO11 2ED |
| Merivale Road | CO11 2EA CO11 2EB |
| Milton Road | CO11 2EG |
| Munnings Way | CO11 2LQ |
| Nash Close | CO11 2LE |
| Parrington Way | CO11 2LZ |
| Queensway | CO11 1EW |
| Riverview Villas | CO11 2BE |
| School Lane | CO11 2HZ CO11 2JA |
| Seaton Close | CO11 2EU |
| Sitwell Close | CO11 2SX |
| Skelton Close | CO11 2HT |
| Springbank Avenue | CO11 2EL CO11 2EW |
| Station Road | CO11 1ED CO11 2LH |
| Stourdale Close | CO11 2HY |
| Stubbs Close | CO11 2HG |
| Taylor Drive | CO11 2HU |
| The Rookery | CO11 1EL |
| Tile Barn Lane | CO11 2LT |
| Turner Avenue | CO11 2LG |
| Waldegrave Close | CO11 2DU |
| Waldegrave Way | CO11 2DS CO11 2DT CO11 2DX |
| Wignall Street | CO11 2GZ CO11 2HX CO11 2JG CO11 2JJ CO11 2JL CO11 2JQ CO11 2NB |
Transport near Lawford
-
Manningtree Station
-
Mistley Station
-
Wrabness Station
-
Great Bentley Station
-
Alresford Station
-
Hythe Station
-
Weeley Station
-
Wivenhoe Station
-
Colchester Town Station
-
Colchester Station
- FAQ
- Price Paid By Year
- Property Type Price
Frequently asked questions about Lawford
What is the average price for a property for sale in Lawford?
The average price for a property for sale in Lawford is £341,276. This amount is 6% lower than the average price in Manningtree. There are 895 property listings for sale in Lawford.
What streets have the most expensive properties for sale in Lawford?
The streets with the most expensive properties for sale in Lawford are Hungerdown Lane at an average of £613,166, Lawford Place at an average of £533,136 and Stourdale Close at an average of £471,416.
What streets have the most affordable properties for sale in Lawford?
The streets with the most affordable properties for sale in Lawford are Nash Close at an average of £202,709, Keating Close at an average of £205,357 and Blake Close at an average of £234,250.
Which train stations are available in or near Lawford?
Some of the train stations available in or near Lawford are Manningtree, Mistley and Wrabness.
Property Price Paid in Lawford by Year
The average sold property price by year was:
| Year | Average Sold Price | Price Change |
Sold Properties
|
|---|---|---|---|
| 2025 | £359,686 | 9% |
38 Properties |
| 2024 | £327,214 | -12% |
63 Properties |
| 2023 | £366,894 | 13% |
57 Properties |
| 2022 | £320,729 | 9% |
62 Properties |
| 2021 | £290,309 | 5% |
80 Properties |
| 2020 | £274,705 | -5% |
56 Properties |
| 2019 | £288,311 | -1% |
51 Properties |
| 2018 | £291,500 | 6% |
77 Properties |
| 2017 | £273,300 | 5% |
69 Properties |
| 2016 | £259,689 | 3% |
77 Properties |
| 2015 | £251,182 | 12% |
67 Properties |
| 2014 | £222,269 | 4% |
86 Properties |
| 2013 | £213,596 | 17% |
83 Properties |
| 2012 | £176,236 | -27% |
60 Properties |
| 2011 | £223,801 | 11% |
58 Properties |
| 2010 | £198,822 | 8% |
81 Properties |
| 2009 | £183,052 | -31% |
74 Properties |
| 2008 | £240,644 | 18% |
55 Properties |
| 2007 | £197,894 | 8% |
93 Properties |
| 2006 | £182,272 | 9% |
102 Properties |
| 2005 | £166,035 | 2% |
91 Properties |
| 2004 | £162,190 | 5% |
83 Properties |
| 2003 | £154,364 | 24% |
89 Properties |
| 2002 | £117,339 | 18% |
128 Properties |
| 2001 | £96,755 | 17% |
110 Properties |
| 2000 | £80,219 | 9% |
106 Properties |
| 1999 | £72,717 | 9% |
131 Properties |
| 1998 | £66,134 | 15% |
114 Properties |
| 1997 | £55,966 | 7% |
95 Properties |
| 1996 | £52,244 | 6% |
78 Properties |
| 1995 | £49,337 | - |
74 Properties |
Property Price per Property Type in Lawford
Here you can find historic sold price data in order to help with your property search.
The average Property Paid Price for specific property types in the last three years are:
| Property Type | Average Sold Price | Sold Properties |
|---|---|---|
| Semi Detached House | £315,335.00 | 109 Semi Detached Houses |
| Detached House | £429,147.00 | 70 Detached Houses |
| Terraced House | £268,548.00 | 29 Terraced Houses |
| Flat | £240,083.00 | 12 Flats |

