
Houses for sale in Manningtree, Essex
House Prices in Manningtree
Properties in Manningtree have an average house price of £366k and had 573 Property Transactions within the last 3 years.¹
Manningtree is an area in Essex with 4,982 households², where the most expensive property was sold for £1.72M.
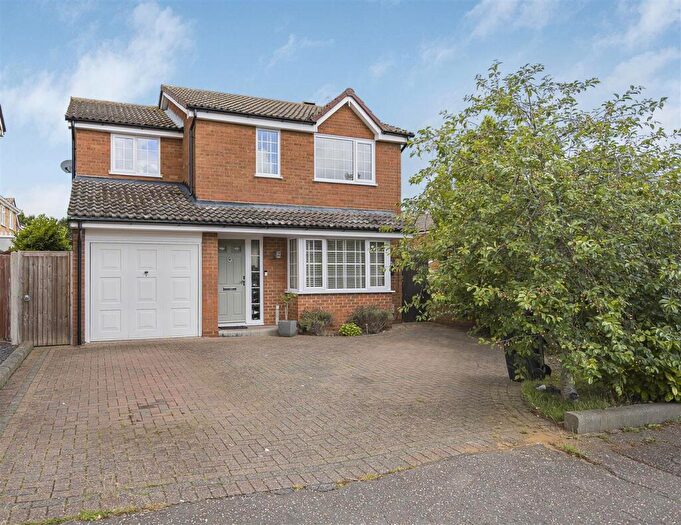
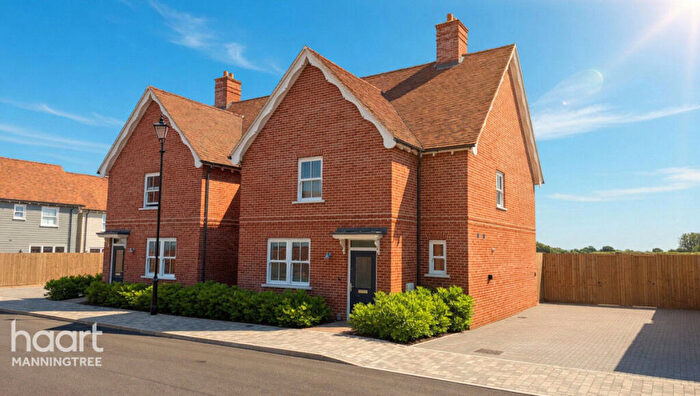
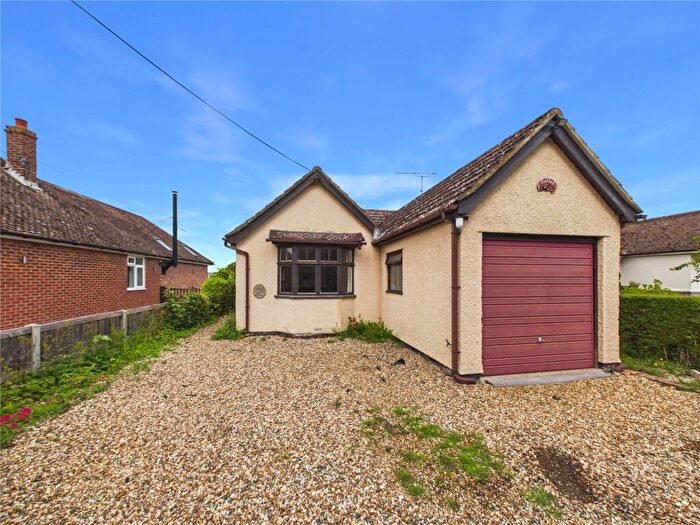
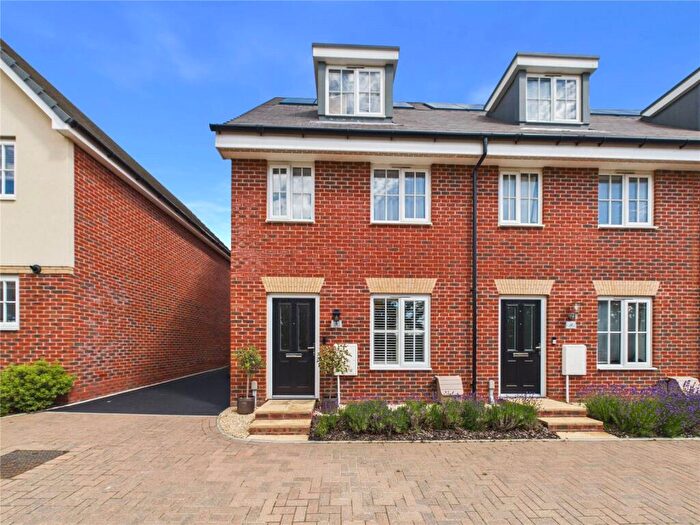
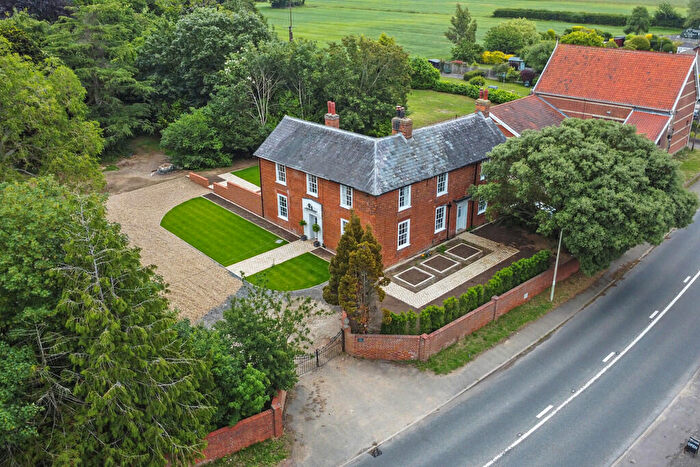
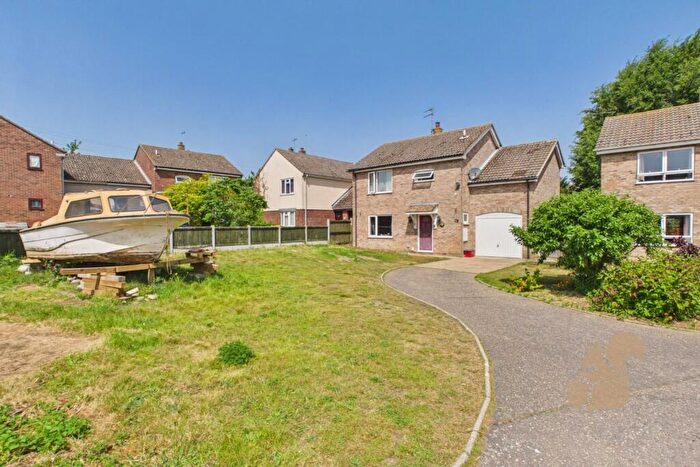
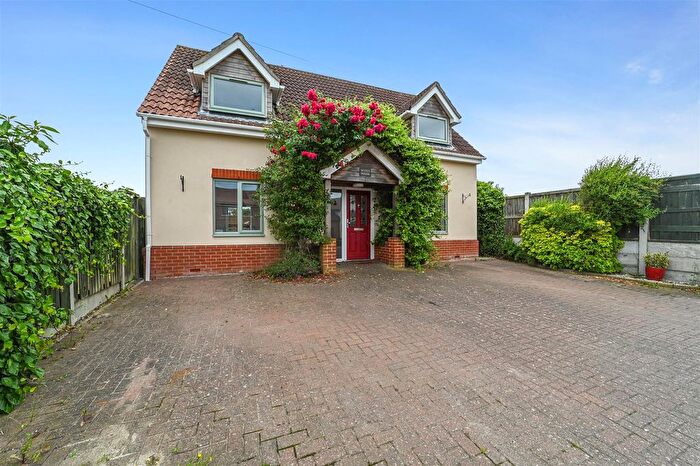
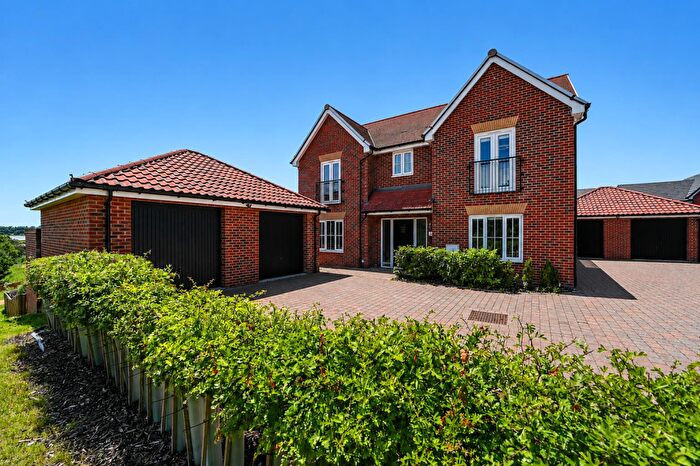
Properties for sale in Manningtree
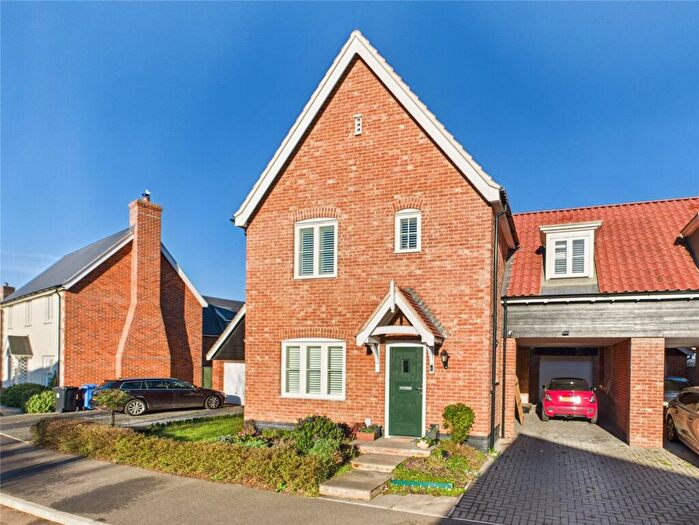
![]()
If you are looking to sell your house, let it out, or receive a property valuation, an expert can help you.
Click the button below to get started.
Neighbourhoods in Manningtree
Navigate through our locations to find the location of your next house in Manningtree, Essex for sale or to rent.
Property price trends in Manningtree
According to the latest Land Registry data, the average home in Manningtree sold for £352,954 in 2026. That figure comes from a substantial record of 6,967 sales logged over the past 31 years.
Prices have fallen back over the last three years. Compared with 2023, when the typical sale came in around £381,145, that's a fall of roughly 7.4%.
Looking back five years, average prices are up about 7.3% since 2021, a gain of around £23,896 in cash terms.
Zoom out to the past decade for the fuller picture. Back in 2016, homes here averaged £280,788, so the typical sold price has climbed about 25.7% since then, roughly 2.3% a year. Stretch the view to fifteen years and that annual pace edges up closer to 3.3%.
Frequently asked questions about Manningtree
What is the average price for a property for sale in Manningtree?
The average price for a property for sale in Manningtree is £365,720. This amount is 10% lower than the average price in Essex. There are 2,304 property listings for sale in Manningtree.
What locations have the most expensive properties for sale in Manningtree?
The locations with the most expensive properties for sale in Manningtree are Ardleigh And Little Bromley at an average of £539,285, Lawford, Manningtree & Mistley at an average of £438,256 and Bradfield, Wrabness And Wix at an average of £426,987.
What locations have the most affordable properties for sale in Manningtree?
The locations with the most affordable properties for sale in Manningtree are Manningtree, Mistley, Little Bentley And Tendring at an average of £311,375 and Lawford at an average of £353,329.
Which train stations are available in or near Manningtree?
Some of the train stations available in or near Manningtree are Mistley, Manningtree and Wrabness.
Property Price Paid in Manningtree by Year
The average sold property price by year was:
| Year | Average Sold Price | Price Change |
Sold Properties
|
|---|---|---|---|
| 2026 | £352,954 | -5% |
11 Properties |
| 2025 | £369,847 | 5% |
190 Properties |
| 2024 | £349,860 | -9% |
204 Properties |
| 2023 | £381,145 | 5% |
168 Properties |
| 2022 | £363,590 | 9% |
230 Properties |
| 2021 | £329,058 | 1% |
335 Properties |
| 2020 | £324,621 | -1% |
276 Properties |
| 2019 | £327,479 | 4% |
213 Properties |
| 2018 | £315,827 | 1% |
228 Properties |
| 2017 | £312,052 | 10% |
244 Properties |
Property Price per Property Type in Manningtree
Here you can find historic sold price data in order to help with your property search.
The average Property Paid Price for specific property types in the last three years are:
| Property Type | Average Sold Price | Sold Properties |
|---|---|---|
| Semi Detached House | £323,452.00 | 201 Semi Detached Houses |
| Detached House | £508,977.00 | 198 Detached Houses |
| Terraced House | £293,879.00 | 103 Terraced Houses |
| Flat | £190,090.00 | 71 Flats |
Transport in Manningtree
Please see below transportation links in this area:
