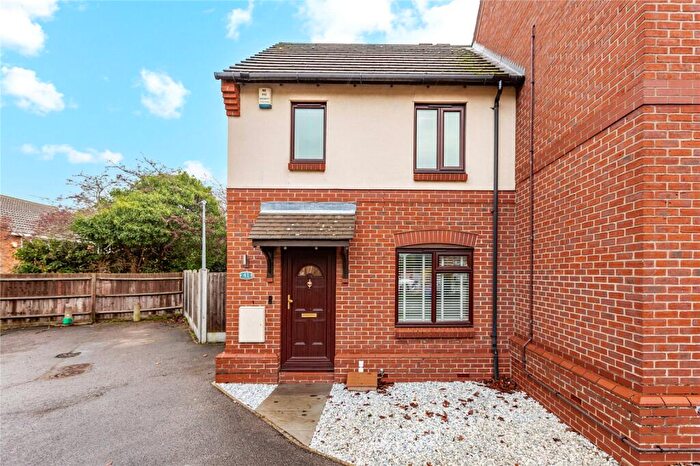
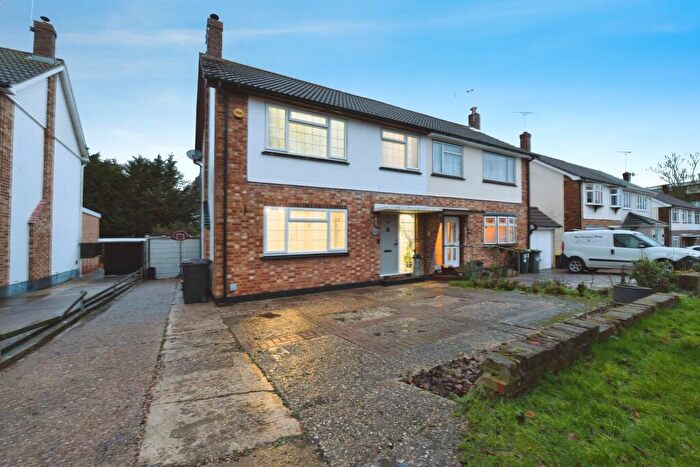
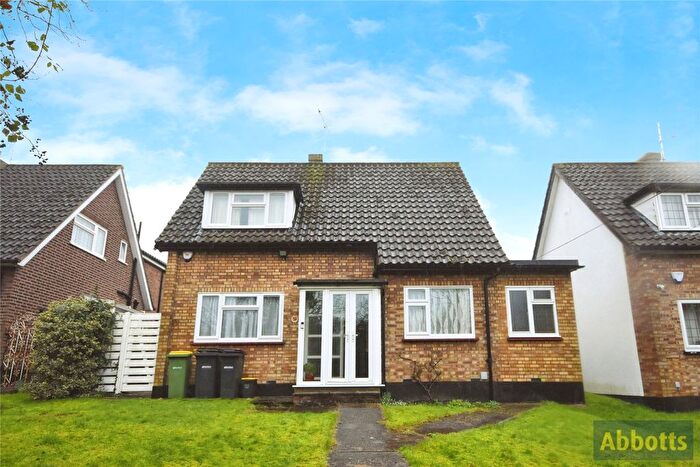
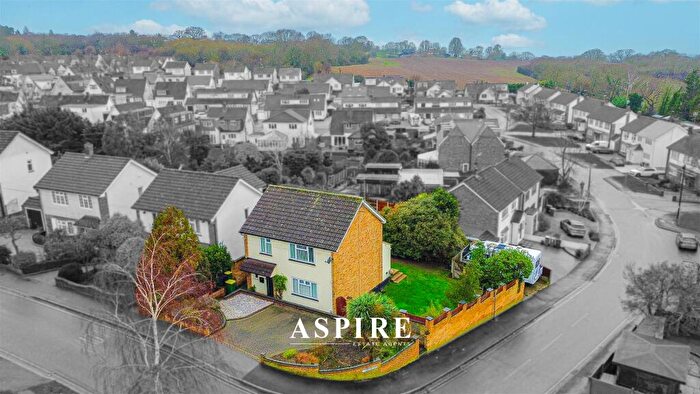
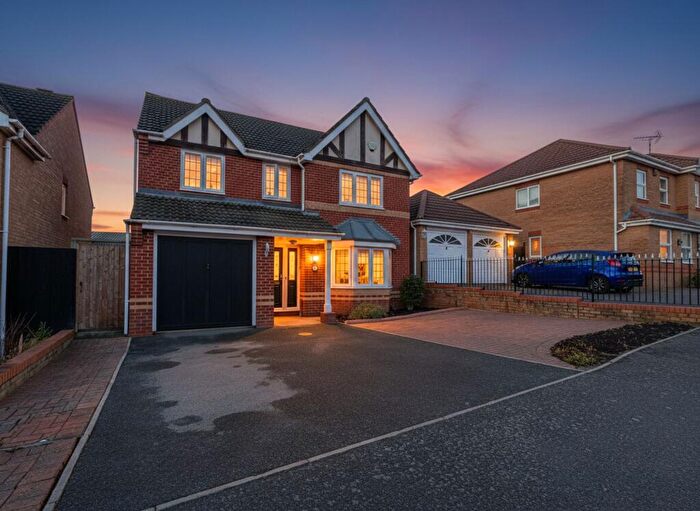
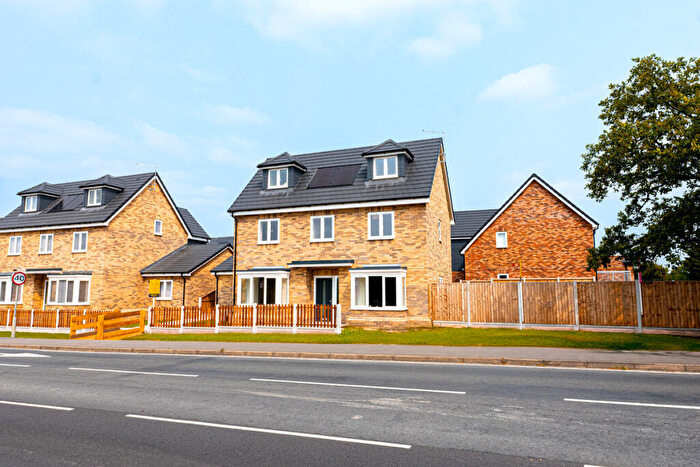
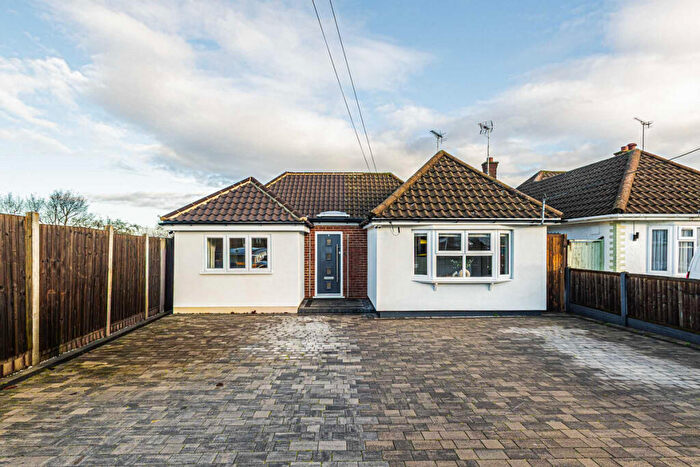
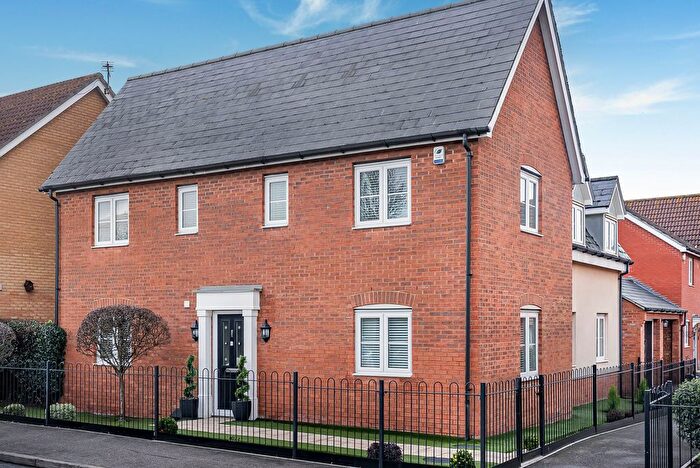
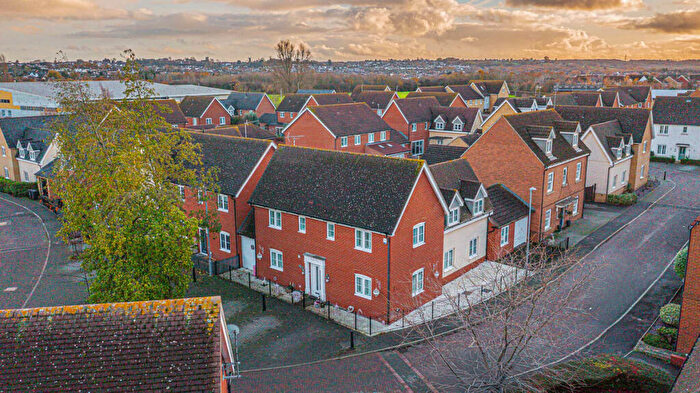
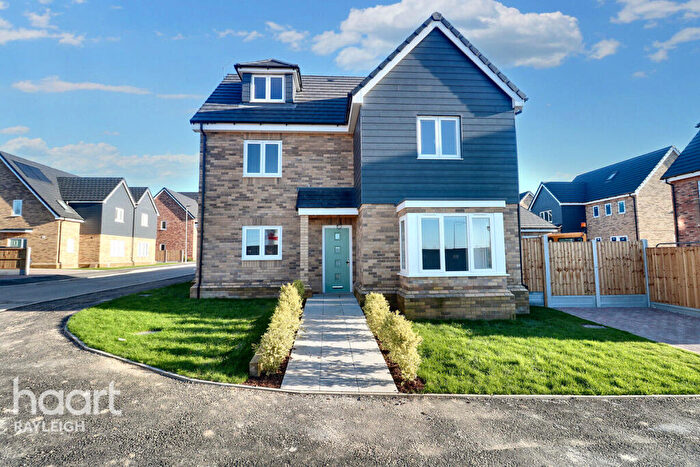
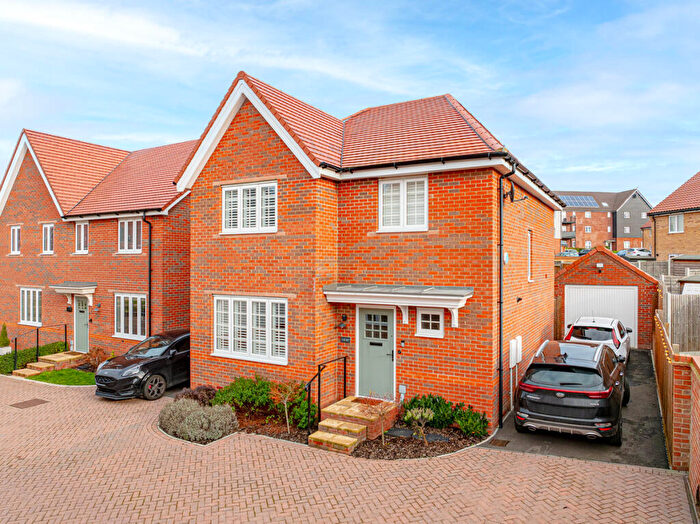
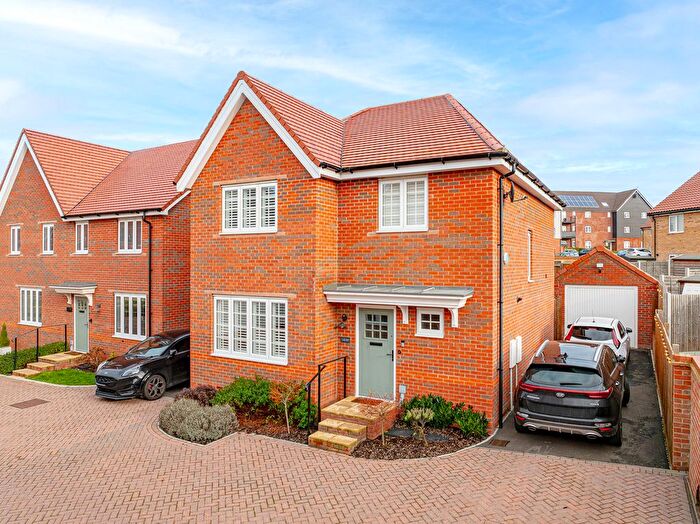
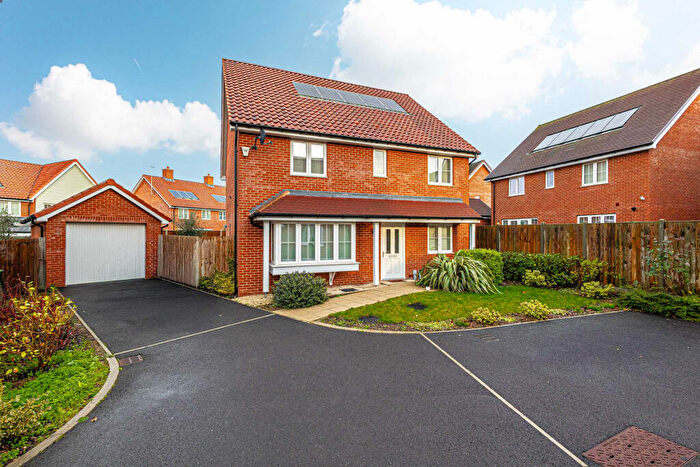
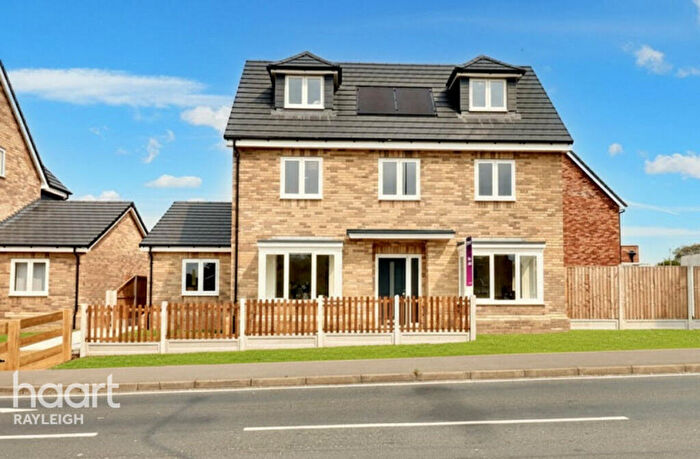
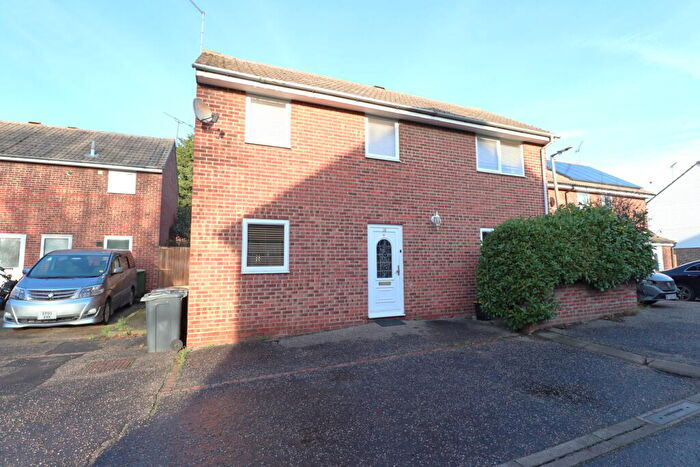
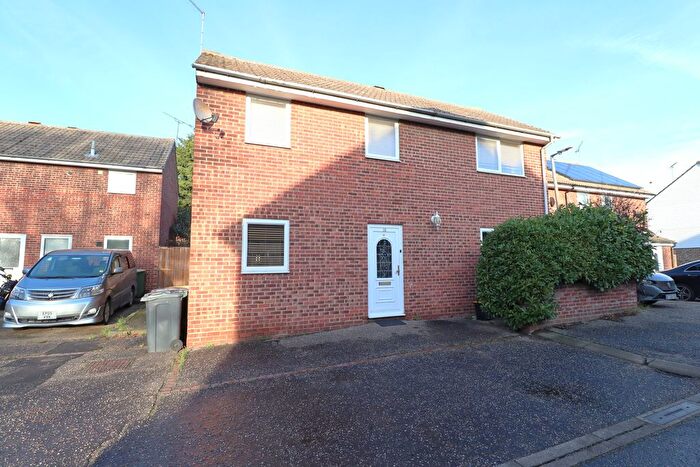
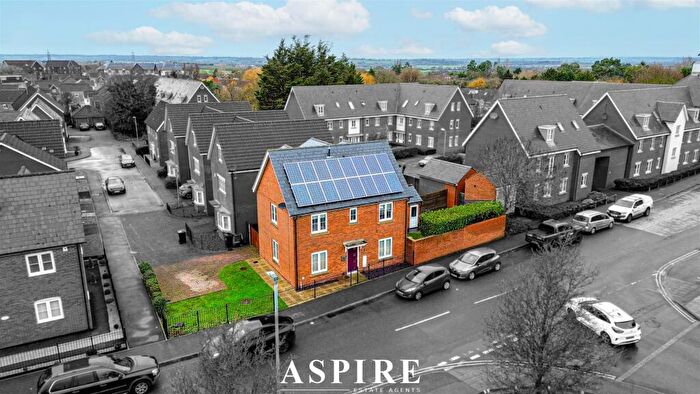
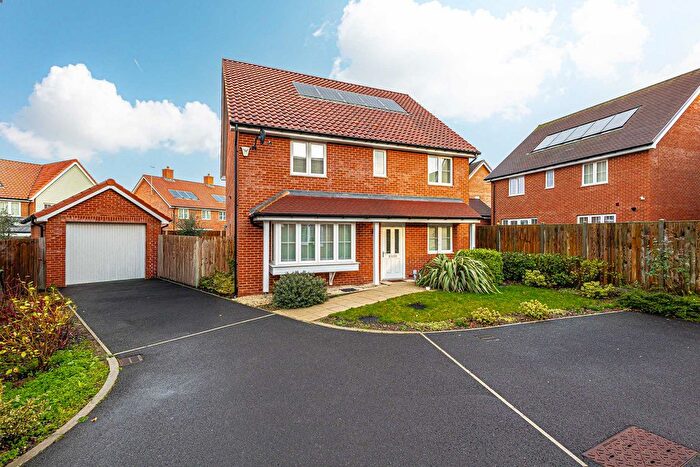
Houses for sale & to rent in Sweyne Park, Rayleigh
House Prices in Sweyne Park
Properties in Sweyne Park have an average house price of £394,919.00 and had 175 Property Transactions within the last 3 years¹.
Sweyne Park is an area in Rayleigh, Essex with 1,747 households², where the most expensive property was sold for £810,000.00.
Properties for sale in Sweyne Park
Roads and Postcodes in Sweyne Park
Navigate through our locations to find the location of your next house in Sweyne Park, Rayleigh for sale or to rent.
| Streets | Postcodes |
|---|---|
| Aldham Gardens | SS6 9TB |
| Alexandria Drive | SS6 9ED |
| Arundel Gardens | SS6 9GS |
| Ashfield | SS6 9TF |
| Bardfield Way | SS6 9EP SS6 9HE SS6 9SJ |
| Belgrave Close | SS6 9GD |
| Boston Avenue | SS6 9DD SS6 9ST SS6 9SU |
| Boxford Close | SS6 9TD |
| Bromley Mews | SS6 9TJ |
| Broomfield Avenue | SS6 9EJ |
| Brunswick Place | SS6 9GB |
| Cheapside West | SS6 9BX SS6 9BY SS6 9DE SS6 9JN |
| Claremont Crescent | SS6 9GZ |
| Clavering Court | SS6 9SF |
| Denham Vale | SS6 9TQ |
| Edinburgh Close | SS6 9GU |
| Elsenham Court | SS6 9SH |
| Fairmead | SS6 9DF |
| Fyfield Path | SS6 9SG |
| Goldhanger Close | SS6 9RX |
| Gosfield Close | SS6 9HB |
| Grosvenor Road | SS6 9GA |
| Gunn Close | SS6 9FW |
| Haddon Close | SS6 9EF |
| Hanningfield Close | SS6 9EL |
| Hartford Close | SS6 9DQ |
| Kelvedon Close | SS6 9SQ |
| Langham Drive | SS6 9TA SS6 9TL |
| Latchingdon Close | SS6 9HA |
| Leonard Drive | SS6 9EA |
| Lindsey Court | SS6 9TG |
| Little Wheatley Chase | SS6 9EH |
| London Road | SS6 9BN SS6 9DL SS6 9DN SS6 9DT SS6 9DW SS6 9JA SS6 9JD |
| Louis Close | SS6 9GG |
| Louis Drive | SS6 9DX SS6 9DY |
| Louis Drive East | SS6 9DU |
| Louis Drive West | SS6 9DZ |
| Maine Crescent | SS6 9DG |
| Navestock Close | SS6 9SA |
| Newsum Gardens | SS6 9QH |
| Oakley Avenue | SS6 9TE |
| Pearsons Avenue | SS6 9BP |
| Polstead Close | SS6 9TW |
| Regent Close | SS6 9BU |
| Rettendon Close | SS6 9SL |
| Ronald Drive | SS6 9EB |
| Salem Walk | SS6 9SS |
| Sheering Court | SS6 9SD |
| Shelley Place | SS6 9TH |
| Sir Walter Raleigh Drive | SS6 9JB |
| Stirling Close | SS6 9GT |
| Sweyne Close | SS6 9DJ |
| Tendring Avenue | SS6 9SB |
| Tillingham Way | SS6 9HF |
| Vernon Avenue | SS6 9BS |
| Victoria Avenue | SS6 9BT SS6 9DB SS6 9DH |
| Wethersfield Close | SS6 9ER |
| Willingale Avenue | SS6 9HD |
| Wimarc Crescent | SS6 9DA |
Transport near Sweyne Park
-
Rayleigh Station
-
Battlesbridge Station
-
Hockley Station
-
Wickford Station
-
Benfleet Station
-
South Woodham Ferrers Station
-
Pitsea Station
-
Leigh-On-Sea Station
-
Rochford Station
- FAQ
- Price Paid By Year
- Property Type Price
Frequently asked questions about Sweyne Park
What is the average price for a property for sale in Sweyne Park?
The average price for a property for sale in Sweyne Park is £394,919. This amount is 8% lower than the average price in Rayleigh. There are 1,079 property listings for sale in Sweyne Park.
What streets have the most expensive properties for sale in Sweyne Park?
The streets with the most expensive properties for sale in Sweyne Park are Victoria Avenue at an average of £630,937, Claremont Crescent at an average of £575,000 and Little Wheatley Chase at an average of £512,500.
What streets have the most affordable properties for sale in Sweyne Park?
The streets with the most affordable properties for sale in Sweyne Park are Boston Avenue at an average of £193,750, Elsenham Court at an average of £307,500 and Hartford Close at an average of £309,100.
Which train stations are available in or near Sweyne Park?
Some of the train stations available in or near Sweyne Park are Rayleigh, Battlesbridge and Hockley.
Property Price Paid in Sweyne Park by Year
The average sold property price by year was:
| Year | Average Sold Price | Price Change |
Sold Properties
|
|---|---|---|---|
| 2025 | £419,864 | 7% |
48 Properties |
| 2024 | £390,478 | 3% |
69 Properties |
| 2023 | £379,559 | -3% |
58 Properties |
| 2022 | £389,605 | 4% |
67 Properties |
| 2021 | £374,345 | 7% |
106 Properties |
| 2020 | £347,020 | 1% |
74 Properties |
| 2019 | £343,753 | 3% |
65 Properties |
| 2018 | £333,125 | 3% |
68 Properties |
| 2017 | £322,184 | 2% |
76 Properties |
| 2016 | £315,730 | 10% |
104 Properties |
| 2015 | £284,791 | 8% |
104 Properties |
| 2014 | £261,563 | 7% |
126 Properties |
| 2013 | £242,757 | 17% |
90 Properties |
| 2012 | £202,206 | -9% |
53 Properties |
| 2011 | £219,606 | -8% |
74 Properties |
| 2010 | £237,663 | 15% |
82 Properties |
| 2009 | £201,648 | -3% |
51 Properties |
| 2008 | £207,380 | -9% |
47 Properties |
| 2007 | £225,280 | 7% |
134 Properties |
| 2006 | £209,679 | 7% |
126 Properties |
| 2005 | £195,052 | -1% |
103 Properties |
| 2004 | £196,055 | 16% |
133 Properties |
| 2003 | £163,751 | 8% |
127 Properties |
| 2002 | £149,848 | 15% |
142 Properties |
| 2001 | £127,309 | 20% |
137 Properties |
| 2000 | £101,275 | 3% |
143 Properties |
| 1999 | £98,303 | -2% |
233 Properties |
| 1998 | £100,751 | 17% |
178 Properties |
| 1997 | £83,434 | 16% |
92 Properties |
| 1996 | £70,188 | 7% |
99 Properties |
| 1995 | £64,992 | - |
86 Properties |
Property Price per Property Type in Sweyne Park
Here you can find historic sold price data in order to help with your property search.
The average Property Paid Price for specific property types in the last three years are:
| Property Type | Average Sold Price | Sold Properties |
|---|---|---|
| Semi Detached House | £379,439.00 | 84 Semi Detached Houses |
| Detached House | £506,397.00 | 44 Detached Houses |
| Terraced House | £332,585.00 | 41 Terraced Houses |
| Flat | £220,083.00 | 6 Flats |

