
Houses for sale in Rayleigh, Essex
House Prices in Rayleigh
Properties in Rayleigh have an average house price of £428k and had 1,417 Property Transactions within the last 3 years.¹
Rayleigh is an area in Essex with 13,366 households², where the most expensive property was sold for £2.75M.
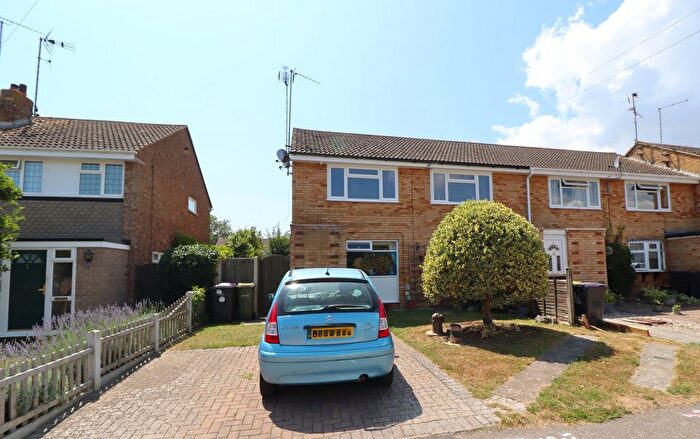
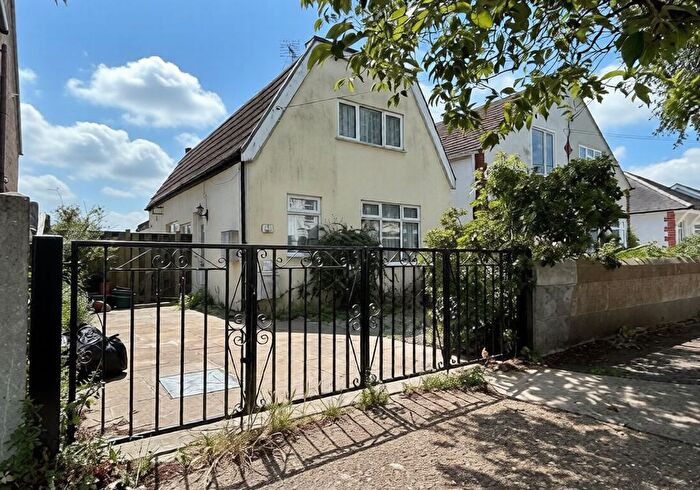
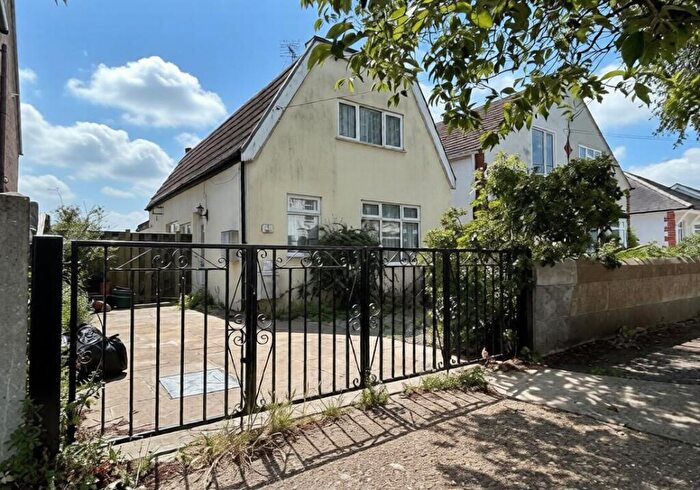
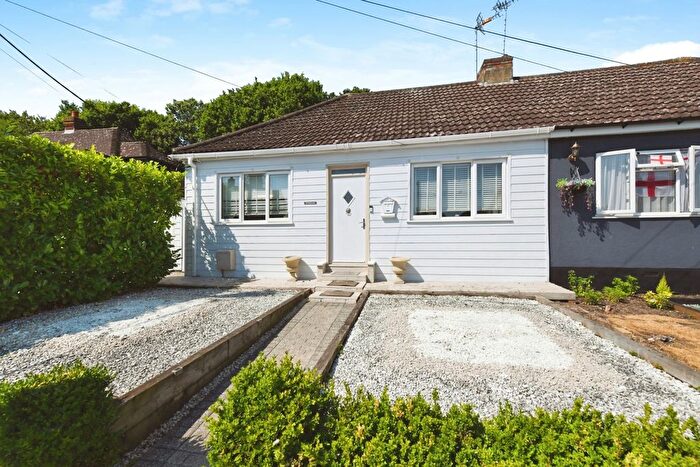
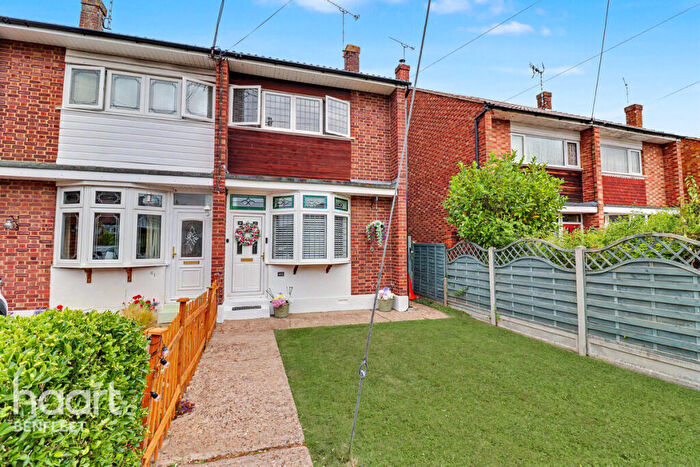
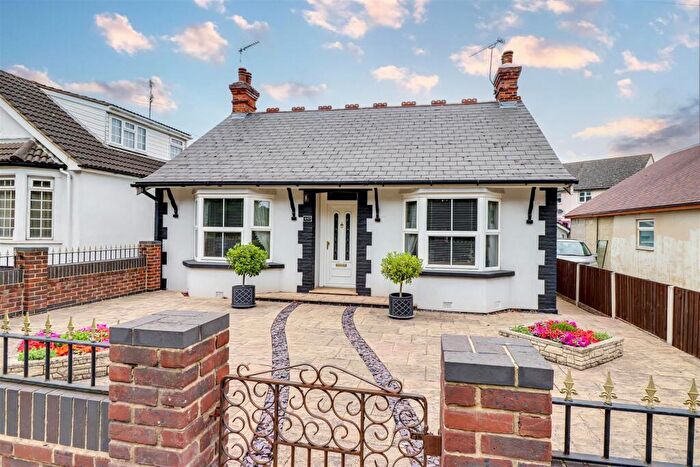
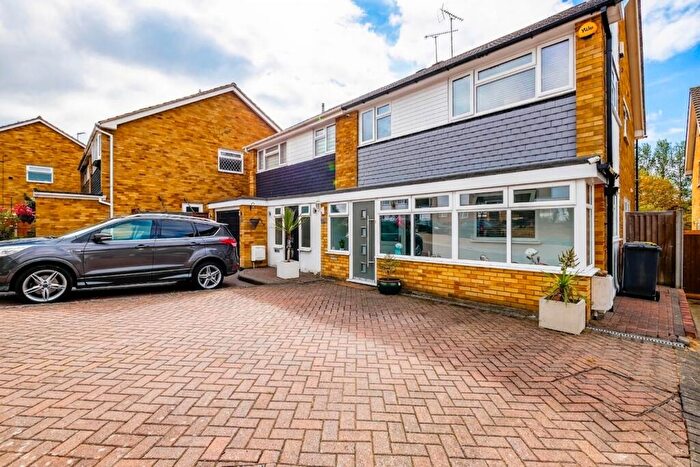
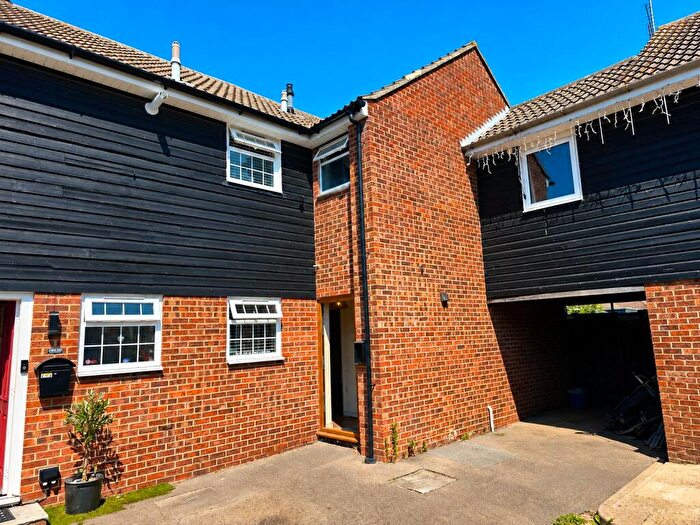
Properties for sale in Rayleigh
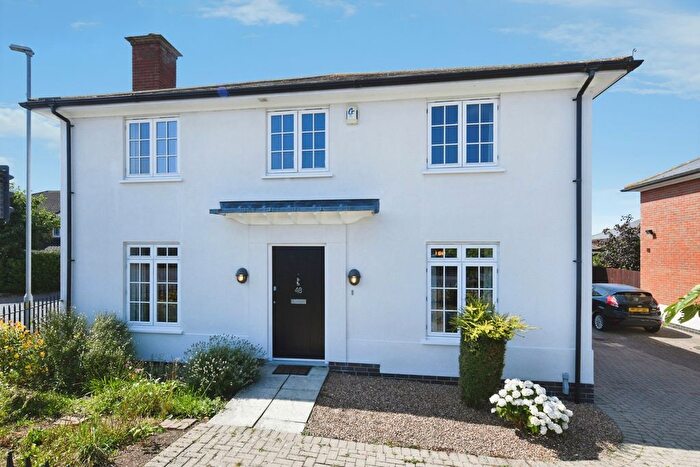
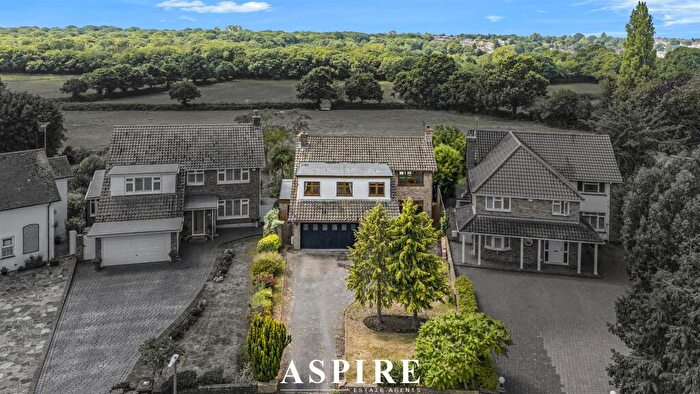
![]()
If you are looking to sell your house, let it out, or receive a property valuation, an expert can help you.
Click the button below to get started.


Neighbourhoods in Rayleigh
Navigate through our locations to find the location of your next house in Rayleigh, Essex for sale or to rent.
Property price trends in Rayleigh
According to the latest Land Registry data, the average home in Rayleigh sold for £463,325 in 2026. That figure comes from a substantial record of 18,727 sales logged over the past 31 years.
Prices have continued to climb over the last three years. Compared with 2023, when the typical sale came in around £426,901, that's a rise of roughly 8.5%.
Looking back five years, average prices are up about 13% since 2021, a gain of around £53,194 in cash terms.
Zoom out to the past decade for the fuller picture. Back in 2016, homes here averaged £331,768, so the typical sold price has climbed about 39.7% since then, roughly 3.4% a year. Stretch the view to fifteen years and that annual pace edges up closer to 4.5%.
Frequently asked questions about Rayleigh
What is the average price for a property for sale in Rayleigh?
The average price for a property for sale in Rayleigh is £428,251. This amount is 5% higher than the average price in Essex. There are 8,705 property listings for sale in Rayleigh.
What locations have the most expensive properties for sale in Rayleigh?
The locations with the most expensive properties for sale in Rayleigh are Trinity at an average of £473,885, Downhall And Rawreth at an average of £473,723 and Wheatley at an average of £464,560.
What locations have the most affordable properties for sale in Rayleigh?
The locations with the most affordable properties for sale in Rayleigh are Victoria at an average of £175,000, Cedar Hall at an average of £346,071 and Grange at an average of £372,898.
Which train stations are available in or near Rayleigh?
Some of the train stations available in or near Rayleigh are Rayleigh, Hockley and Battlesbridge.
Property Price Paid in Rayleigh by Year
The average sold property price by year was:
| Year | Average Sold Price | Price Change |
Sold Properties
|
|---|---|---|---|
| 2026 | £463,325 | 7% |
33 Properties |
| 2025 | £428,870 | 1% |
463 Properties |
| 2024 | £426,480 | -0,1% |
477 Properties |
| 2023 | £426,901 | - |
444 Properties |
| 2022 | £426,768 | 4% |
515 Properties |
| 2021 | £410,131 | 7% |
743 Properties |
| 2020 | £380,838 | 3% |
468 Properties |
| 2019 | £370,797 | -1% |
497 Properties |
| 2018 | £374,266 | 5% |
501 Properties |
| 2017 | £356,516 | 7% |
529 Properties |
Property Price per Property Type in Rayleigh
Here you can find historic sold price data in order to help with your property search.
The average Property Paid Price for specific property types in the last three years are:
| Property Type | Average Sold Price | Sold Properties |
|---|---|---|
| Semi Detached House | £405,250.00 | 699 Semi Detached Houses |
| Detached House | £572,289.00 | 422 Detached Houses |
| Terraced House | £361,642.00 | 126 Terraced Houses |
| Flat | £214,642.00 | 170 Flats |
Transport in Rayleigh
Please see below transportation links in this area:
