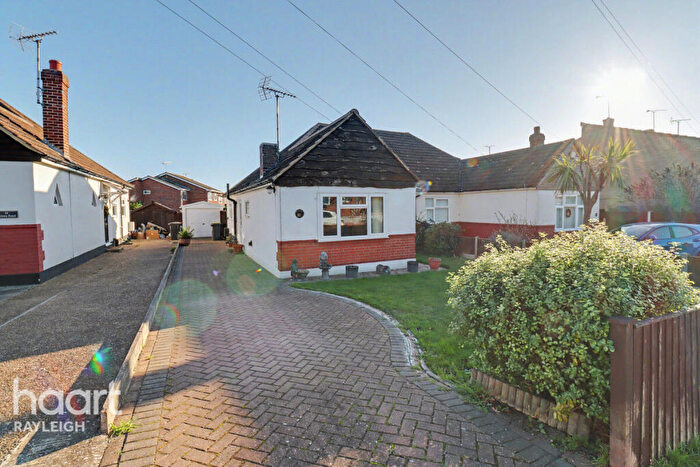
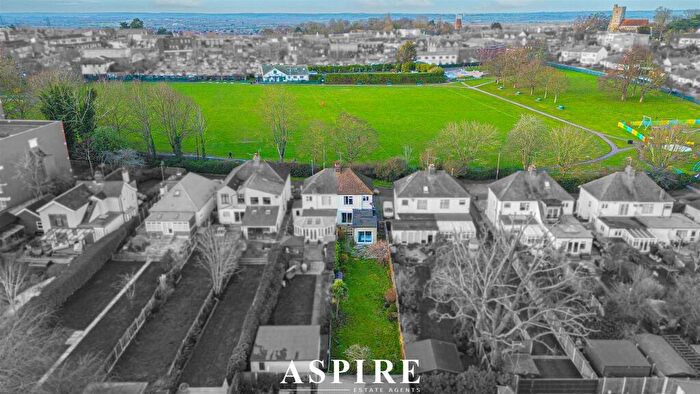
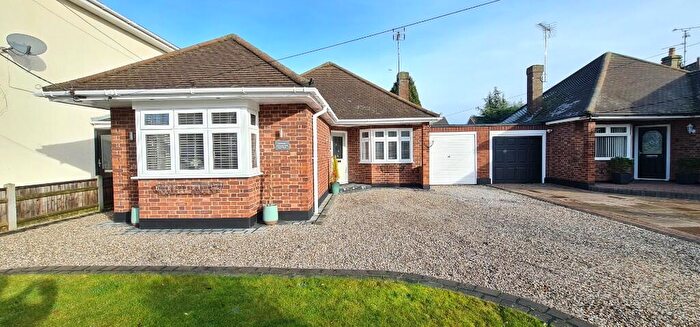
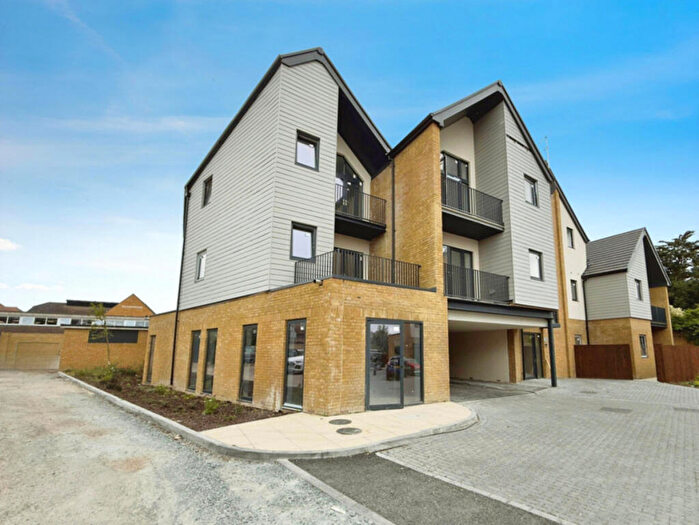
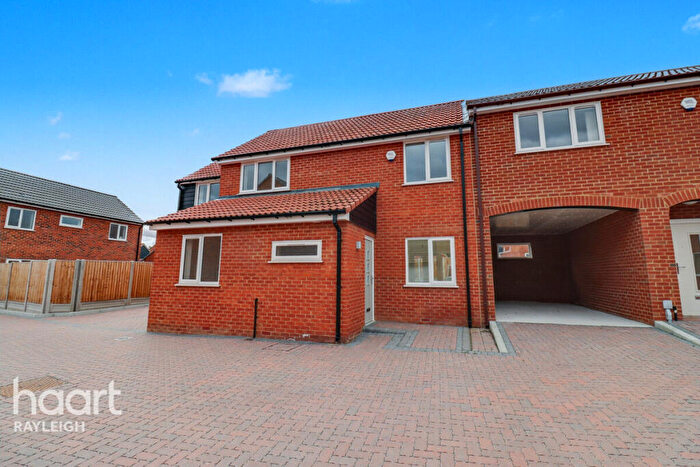
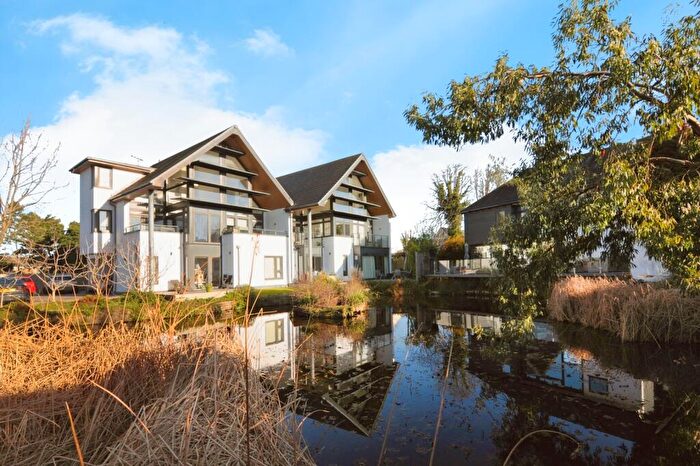
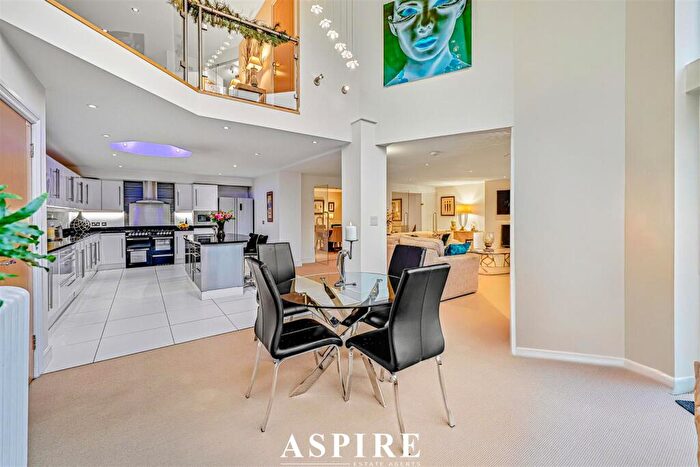
Houses for sale & to rent in Trinity, Rayleigh
House Prices in Trinity
Properties in Trinity have an average house price of £475,256.00 and had 144 Property Transactions within the last 3 years¹.
Trinity is an area in Rayleigh, Essex with 1,437 households², where the most expensive property was sold for £1,025,000.00.
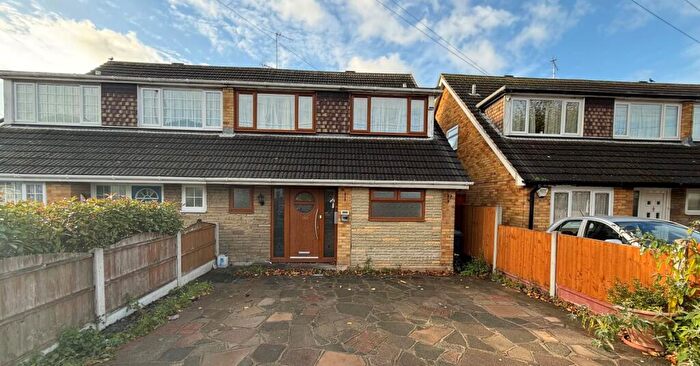
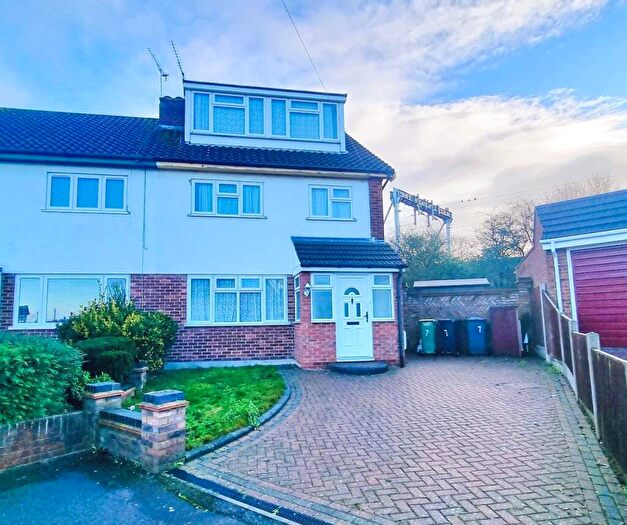
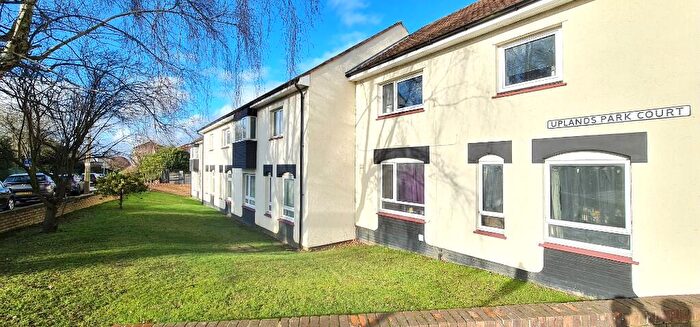
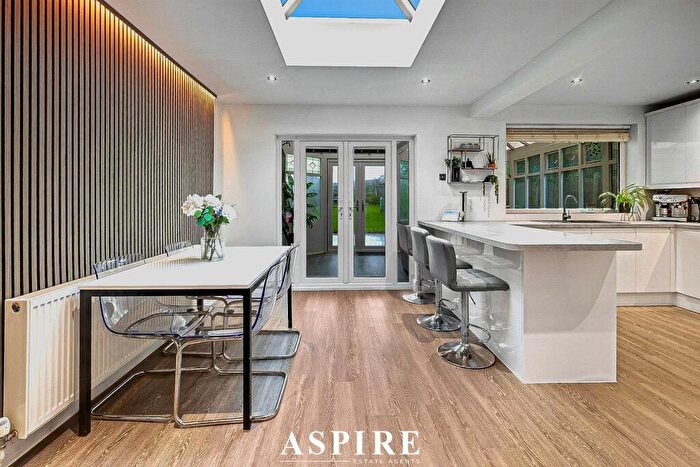
Properties for sale in Trinity
Roads and Postcodes in Trinity
Navigate through our locations to find the location of your next house in Trinity, Rayleigh for sale or to rent.
| Streets | Postcodes |
|---|---|
| Albert Close | SS6 8HP |
| Albert Road | SS6 8HN |
| Alexandra Road | SS6 8HS SS6 8HT |
| Ardley Way | SS6 8BY |
| Betjemen Close | SS6 8ER |
| Blower Close | SS6 8HW |
| Bracken Dell | SS6 8LP |
| Broadlands Avenue | SS6 8AQ |
| Bull Lane | SS6 8NH SS6 8NN SS6 8NQ SS6 8NS SS6 8NT SS6 8NU SS6 8NW |
| Byford Close | SS6 8EN |
| Causton Way | SS6 8DD |
| Chiltern Close | SS6 8AS |
| Church Road | SS6 8PZ |
| Cotswold Avenue | SS6 8AN SS6 8AW |
| Curtis Way | SS6 8BU |
| Drakes Way | SS6 8BS |
| Fairview Crescent | SS6 8FH |
| Hambro Close | SS6 8BZ |
| Hambro Hill | SS6 8BN SS6 8BW SS6 8DJ |
| Hamilton Mews | SS6 8HF |
| Helena Road | SS6 8LL SS6 8LN |
| Hockley Road | SS6 8BG SS6 8BH SS6 8BQ SS6 8EP SS6 8ET SS6 8EU |
| Homestead Close | SS6 8FE |
| John Childs Way | SS6 8QG |
| Kembles | SS6 8DE |
| Louise Road | SS6 8LW |
| Lower Lambricks | SS6 8BX SS6 8DA SS6 8DB |
| Malvern Close | SS6 8AP |
| Mendip Close | SS6 8AL |
| Napier Road | SS6 8HH |
| Nelson Close | SS6 8HE |
| Nelson Gardens | SS6 8HD |
| Nelson Road | SS6 8HB SS6 8HQ |
| Plowmans | SS6 8BT |
| Princess Road | SS6 8HR |
| Ruffles Close | SS6 8EW |
| Station Crescent | SS6 8AR |
| The Chestnuts | SS6 8ES |
| The Courts | SS6 8EF |
| The Gattens | SS6 8BJ |
| The Lavers | SS6 8ED |
| Tyms Way | SS6 8DG |
| Uplands Park Road | SS6 8AH SS6 8AJ SS6 8AY |
| Upper Lambricks | SS6 8BP |
| Upway | SS6 8AA SS6 8AG |
| Victoria Road | SS6 8EG SS6 8EJ SS6 8EL SS6 8EQ |
| Wellington Road | SS6 8EX SS6 8EZ |
| Wellsfield | SS6 8DW |
Transport near Trinity
-
Rayleigh Station
-
Hockley Station
-
Battlesbridge Station
-
Leigh-On-Sea Station
-
Rochford Station
-
South Woodham Ferrers Station
-
Benfleet Station
-
Southend Airport Station
-
Chalkwell Station
-
Wickford Station
- FAQ
- Price Paid By Year
- Property Type Price
Frequently asked questions about Trinity
What is the average price for a property for sale in Trinity?
The average price for a property for sale in Trinity is £475,256. This amount is 11% higher than the average price in Rayleigh. There are 1,649 property listings for sale in Trinity.
What streets have the most expensive properties for sale in Trinity?
The streets with the most expensive properties for sale in Trinity are Napier Road at an average of £910,000, Tyms Way at an average of £900,000 and Nelson Close at an average of £691,000.
What streets have the most affordable properties for sale in Trinity?
The streets with the most affordable properties for sale in Trinity are Mendip Close at an average of £340,000, Uplands Park Road at an average of £349,944 and Hambro Hill at an average of £363,571.
Which train stations are available in or near Trinity?
Some of the train stations available in or near Trinity are Rayleigh, Hockley and Battlesbridge.
Property Price Paid in Trinity by Year
The average sold property price by year was:
| Year | Average Sold Price | Price Change |
Sold Properties
|
|---|---|---|---|
| 2025 | £451,682 | -6% |
41 Properties |
| 2024 | £479,341 | -3% |
60 Properties |
| 2023 | £492,035 | -1% |
43 Properties |
| 2022 | £496,180 | 8% |
50 Properties |
| 2021 | £454,720 | 6% |
98 Properties |
| 2020 | £428,266 | -3% |
44 Properties |
| 2019 | £440,053 | 2% |
66 Properties |
| 2018 | £429,286 | 7% |
54 Properties |
| 2017 | £397,121 | 4% |
49 Properties |
| 2016 | £380,061 | 8% |
53 Properties |
| 2015 | £351,553 | 13% |
61 Properties |
| 2014 | £305,957 | 7% |
62 Properties |
| 2013 | £284,267 | -0,1% |
42 Properties |
| 2012 | £284,635 | -1% |
48 Properties |
| 2011 | £286,799 | 7% |
45 Properties |
| 2010 | £265,382 | 8% |
45 Properties |
| 2009 | £244,664 | -9% |
40 Properties |
| 2008 | £266,002 | -11% |
34 Properties |
| 2007 | £295,502 | 15% |
69 Properties |
| 2006 | £251,837 | -1% |
62 Properties |
| 2005 | £254,544 | 4% |
66 Properties |
| 2004 | £245,575 | 10% |
64 Properties |
| 2003 | £220,461 | 13% |
55 Properties |
| 2002 | £191,064 | 24% |
53 Properties |
| 2001 | £145,450 | 7% |
64 Properties |
| 2000 | £134,673 | 20% |
57 Properties |
| 1999 | £107,676 | 8% |
68 Properties |
| 1998 | £98,700 | 16% |
59 Properties |
| 1997 | £82,515 | 6% |
61 Properties |
| 1996 | £77,168 | -8% |
49 Properties |
| 1995 | £83,471 | - |
45 Properties |
Property Price per Property Type in Trinity
Here you can find historic sold price data in order to help with your property search.
The average Property Paid Price for specific property types in the last three years are:
| Property Type | Average Sold Price | Sold Properties |
|---|---|---|
| Semi Detached House | £427,118.00 | 79 Semi Detached Houses |
| Detached House | £568,105.00 | 53 Detached Houses |
| Terraced House | £412,750.00 | 10 Terraced Houses |
| Flat | £228,750.00 | 2 Flats |

