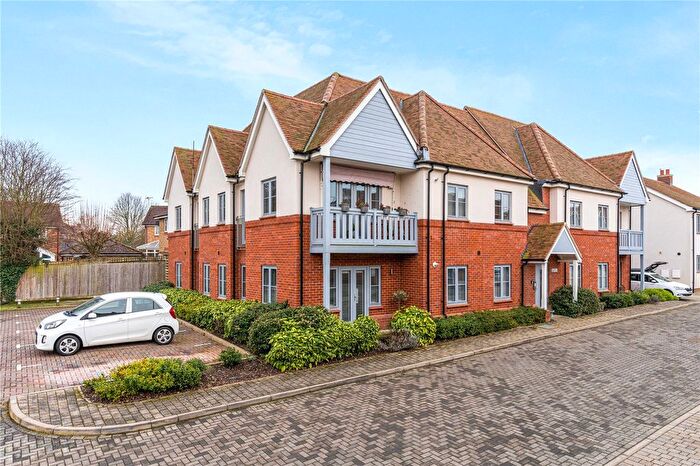
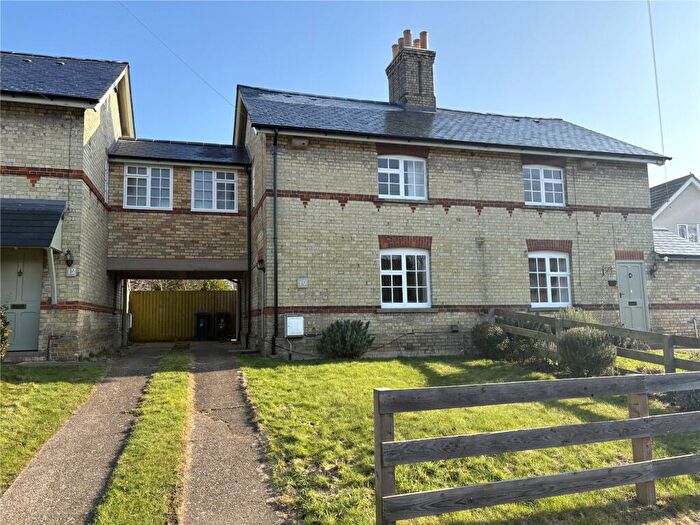
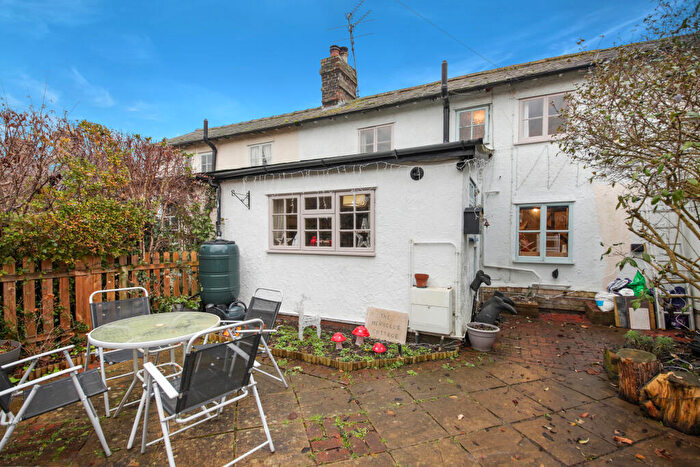
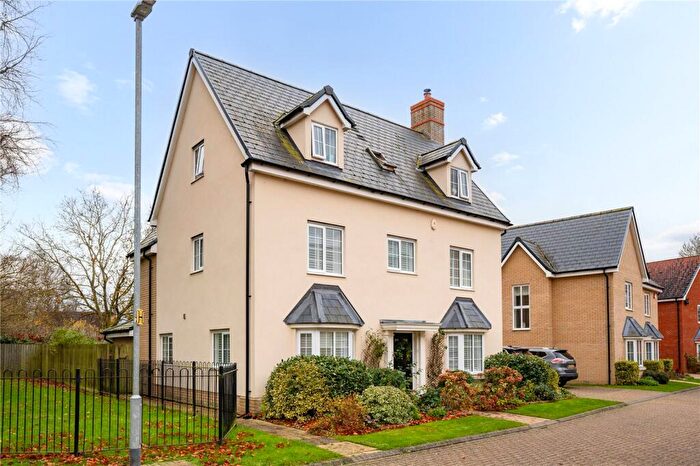
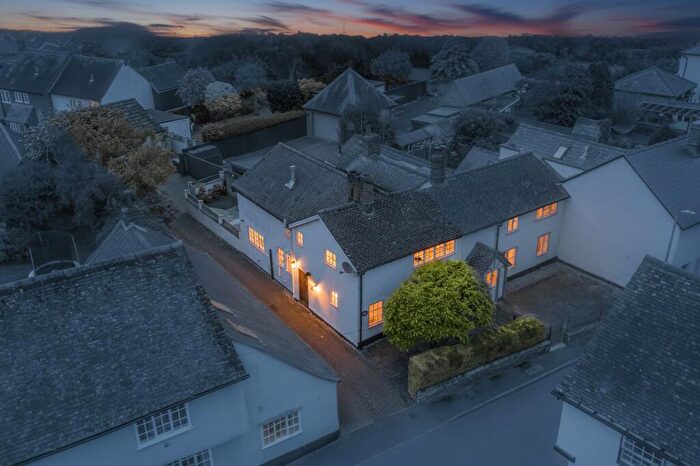
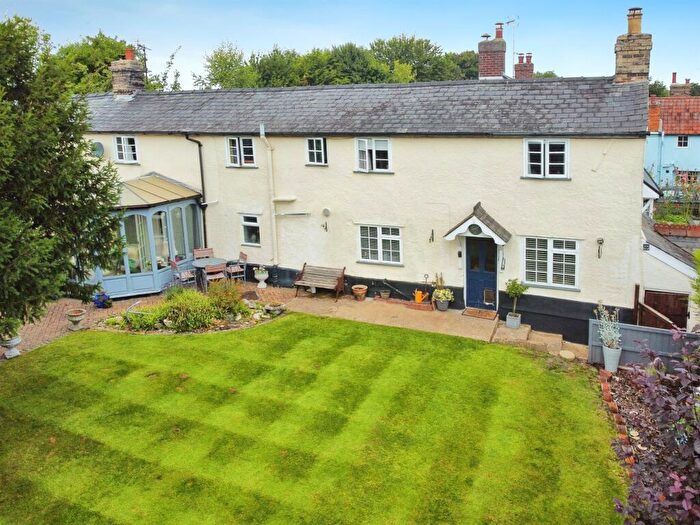
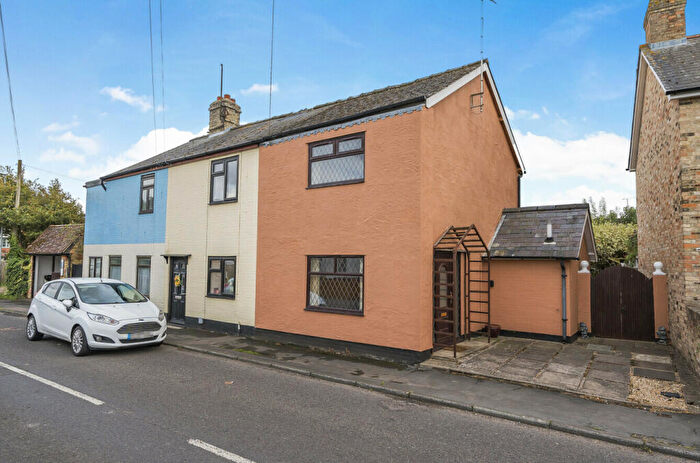
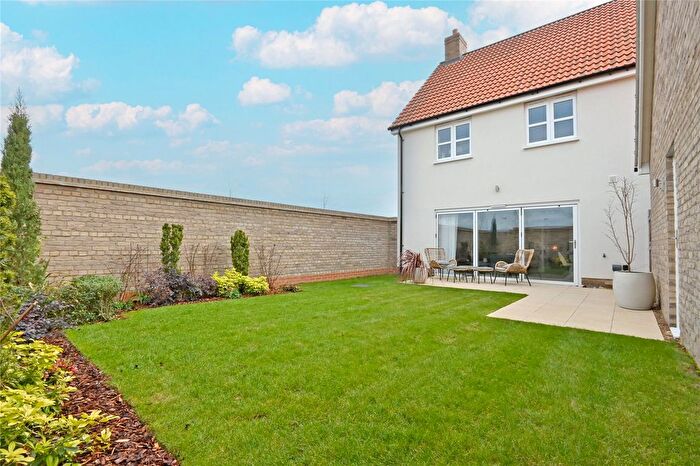
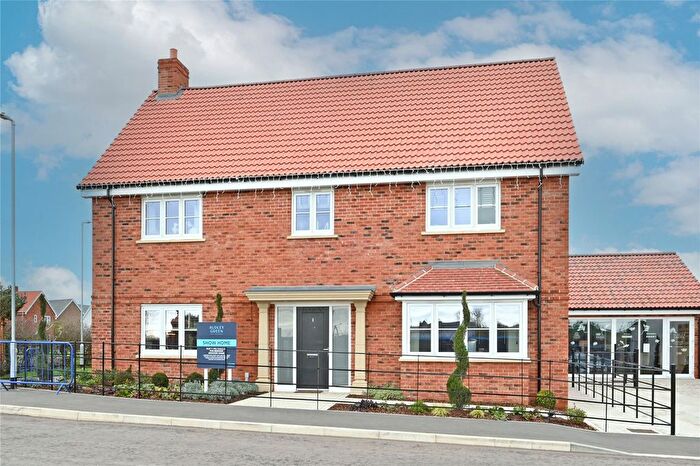
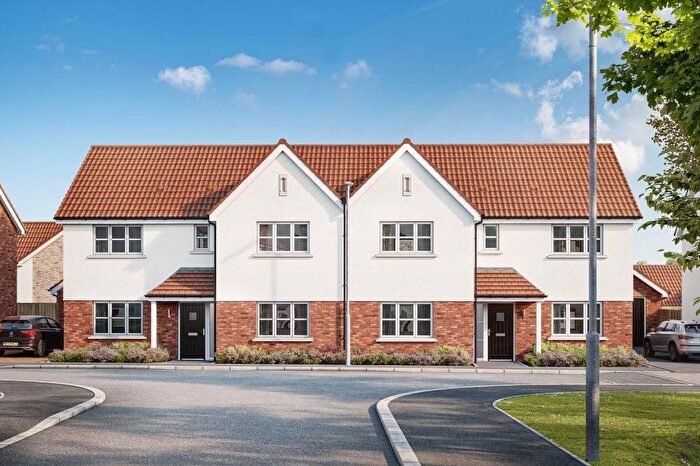
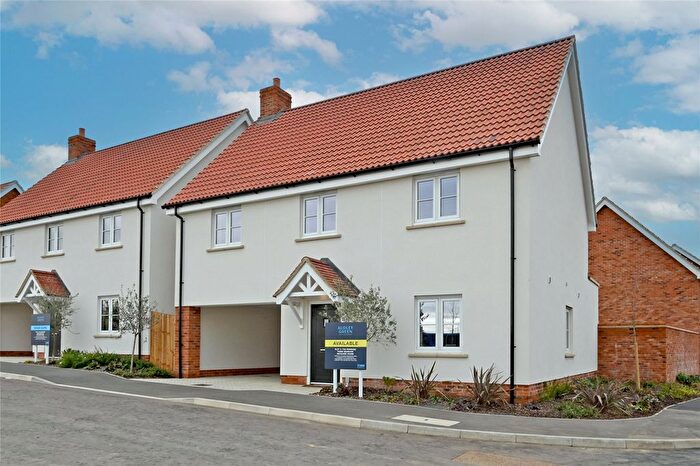
Houses for sale & to rent in The Chesterfords, Saffron Walden
House Prices in The Chesterfords
Properties in The Chesterfords have an average house price of £533,436.00 and had 54 Property Transactions within the last 3 years¹.
The Chesterfords is an area in Saffron Walden, Essex with 658 households², where the most expensive property was sold for £1,925,000.00.
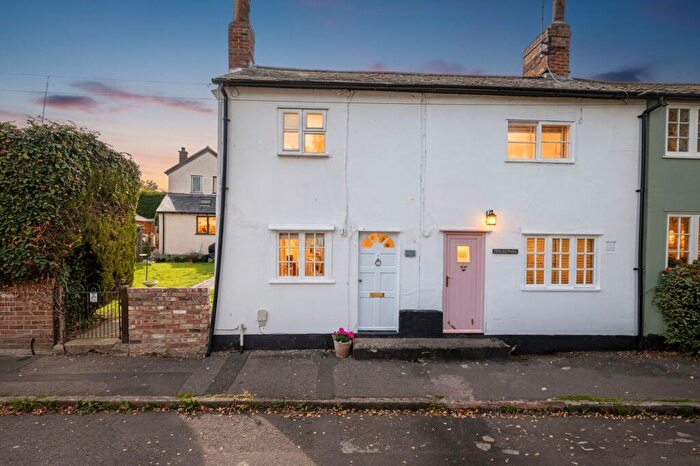
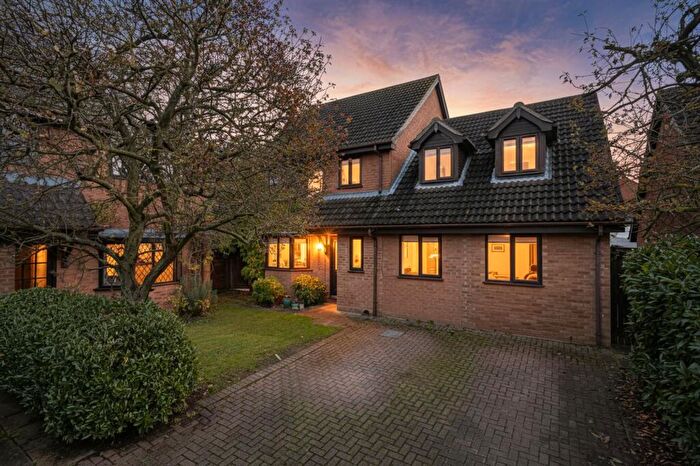
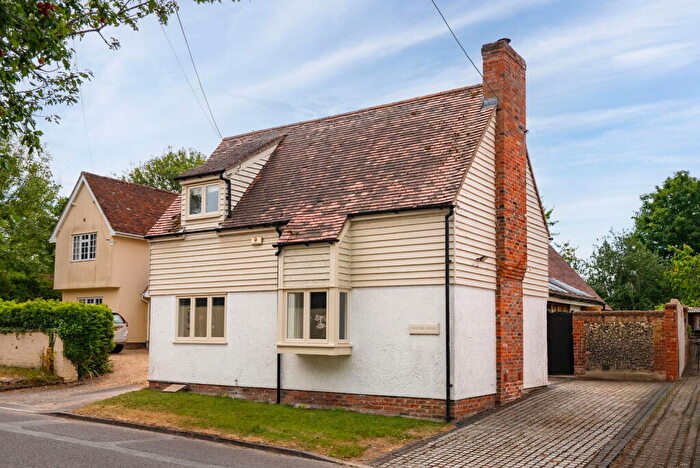
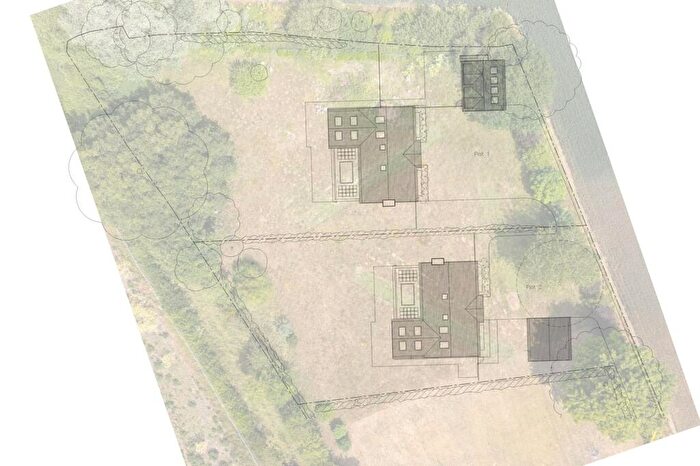
Properties for sale in The Chesterfords
Previously listed properties in The Chesterfords
Roads and Postcodes in The Chesterfords
Navigate through our locations to find the location of your next house in The Chesterfords, Saffron Walden for sale or to rent.
| Streets | Postcodes |
|---|---|
| Ash Green | CB10 1QR |
| Bartholomew Close | CB10 1QH |
| Carmel Street | CB10 1PH |
| Carmen Street | CB10 1NR |
| Church Street | CB10 1NP |
| Eastgate | CB10 1PA |
| Field Farm Drive | CB10 1RP |
| Four Acres | CB10 1QE |
| Granta Close | CB10 1QP |
| Haggers Close | CB10 1QN |
| High Street | CB10 1PL CB10 1PP CB10 1PR CB10 1TS CB10 1TZ |
| Hyll Close | CB10 1QF |
| Jacksons Lane | CB10 1PT CB10 1PU |
| Jacksons Square | CB10 1PY |
| Kings Mill | CB10 1PE |
| London Road | CB10 1NY CB10 1UB |
| Manor Cottages | CB10 1PJ |
| Meadow Road | CB10 1PX |
| Mill View | CB10 1PD |
| Newmarket Road | CB10 1NS |
| Park Road | CB10 1RL |
| Pepper Court | CB10 1NZ |
| Pilgrim Close | CB10 1QG |
| Rookery Close | CB10 1QA |
| Rose Lane | CB10 1PN |
| School Street | CB10 1NN |
| South Street | CB10 1NW |
| Spencer Road | CB10 1PZ |
| St Johns Close | CB10 1PB |
| Stanley Road | CB10 1QB |
| The Elms | CB10 1QD |
| The Willows | CB10 1QL |
| Wakefield Close | CB10 1QQ |
| Walden Road | CB10 1PS CB10 1UD CB10 1UE |
| Whiteways | CB10 1NX |
Transport near The Chesterfords
- FAQ
- Price Paid By Year
- Property Type Price
Frequently asked questions about The Chesterfords
What is the average price for a property for sale in The Chesterfords?
The average price for a property for sale in The Chesterfords is £533,436. This amount is 3% higher than the average price in Saffron Walden. There are 421 property listings for sale in The Chesterfords.
What streets have the most expensive properties for sale in The Chesterfords?
The streets with the most expensive properties for sale in The Chesterfords are Carmen Street at an average of £1,125,000, High Street at an average of £1,044,500 and School Street at an average of £790,000.
What streets have the most affordable properties for sale in The Chesterfords?
The streets with the most affordable properties for sale in The Chesterfords are Kings Mill at an average of £274,166, Hyll Close at an average of £310,000 and Pilgrim Close at an average of £327,055.
Which train stations are available in or near The Chesterfords?
Some of the train stations available in or near The Chesterfords are Great Chesterford, Whittlesford and Audley End.
Property Price Paid in The Chesterfords by Year
The average sold property price by year was:
| Year | Average Sold Price | Price Change |
Sold Properties
|
|---|---|---|---|
| 2025 | £581,696 | 10% |
13 Properties |
| 2024 | £523,361 | 2% |
18 Properties |
| 2023 | £514,043 | -10% |
23 Properties |
| 2022 | £566,650 | 4% |
30 Properties |
| 2021 | £543,407 | 11% |
38 Properties |
| 2020 | £482,080 | -1% |
25 Properties |
| 2019 | £486,631 | -31% |
19 Properties |
| 2018 | £639,312 | 10% |
24 Properties |
| 2017 | £576,033 | -15% |
30 Properties |
| 2016 | £660,693 | 38% |
34 Properties |
| 2015 | £409,777 | 19% |
59 Properties |
| 2014 | £330,159 | -1% |
27 Properties |
| 2013 | £334,329 | -20% |
24 Properties |
| 2012 | £399,600 | 12% |
25 Properties |
| 2011 | £351,687 | -9% |
16 Properties |
| 2010 | £382,522 | 22% |
31 Properties |
| 2009 | £297,502 | 0,2% |
22 Properties |
| 2008 | £296,869 | -7% |
23 Properties |
| 2007 | £318,044 | 4% |
42 Properties |
| 2006 | £306,352 | 13% |
34 Properties |
| 2005 | £265,913 | 7% |
32 Properties |
| 2004 | £248,560 | -19% |
36 Properties |
| 2003 | £294,974 | 16% |
33 Properties |
| 2002 | £246,393 | 25% |
36 Properties |
| 2001 | £185,650 | -0,4% |
58 Properties |
| 2000 | £186,477 | 14% |
38 Properties |
| 1999 | £160,129 | -9% |
36 Properties |
| 1998 | £173,953 | 33% |
45 Properties |
| 1997 | £116,744 | 16% |
45 Properties |
| 1996 | £98,078 | 2% |
33 Properties |
| 1995 | £95,712 | - |
30 Properties |
Property Price per Property Type in The Chesterfords
Here you can find historic sold price data in order to help with your property search.
The average Property Paid Price for specific property types in the last three years are:
| Property Type | Average Sold Price | Sold Properties |
|---|---|---|
| Semi Detached House | £457,333.00 | 9 Semi Detached Houses |
| Detached House | £711,051.00 | 29 Detached Houses |
| Terraced House | £311,578.00 | 7 Terraced Houses |
| Flat | £209,777.00 | 9 Flats |

