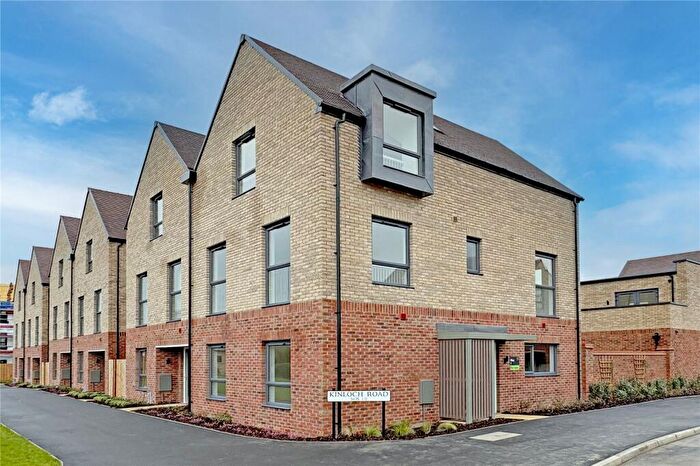
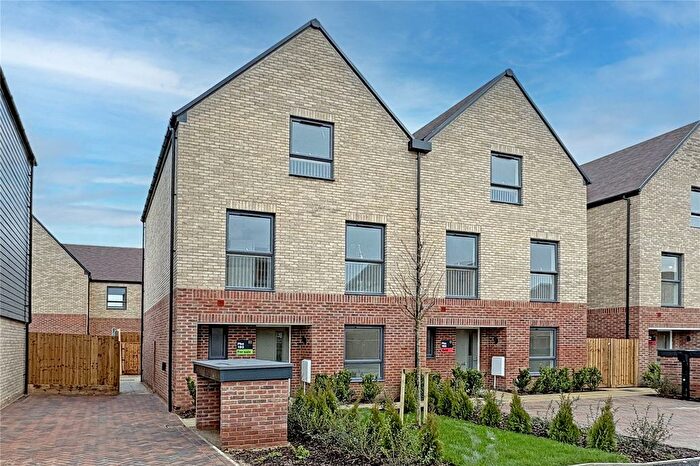
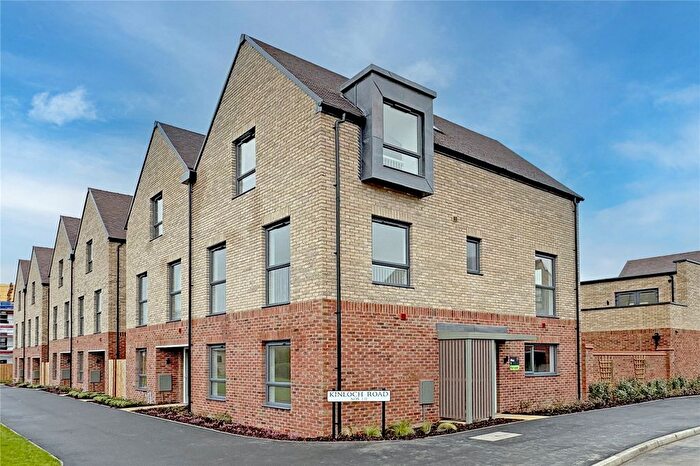
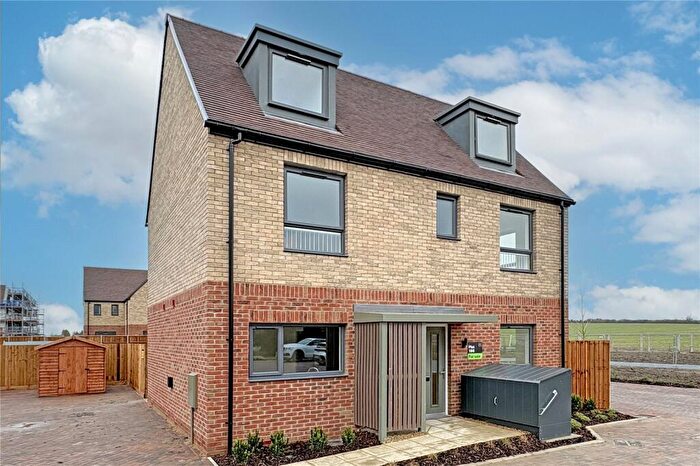
Houses for sale & to rent in Duxford, Cambridge
House Prices in Duxford
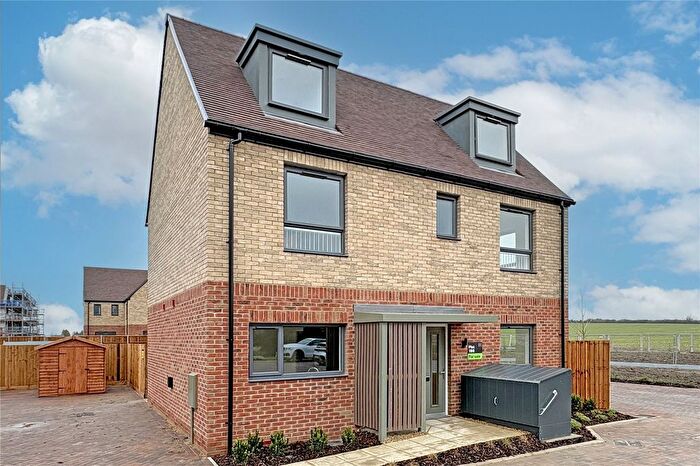
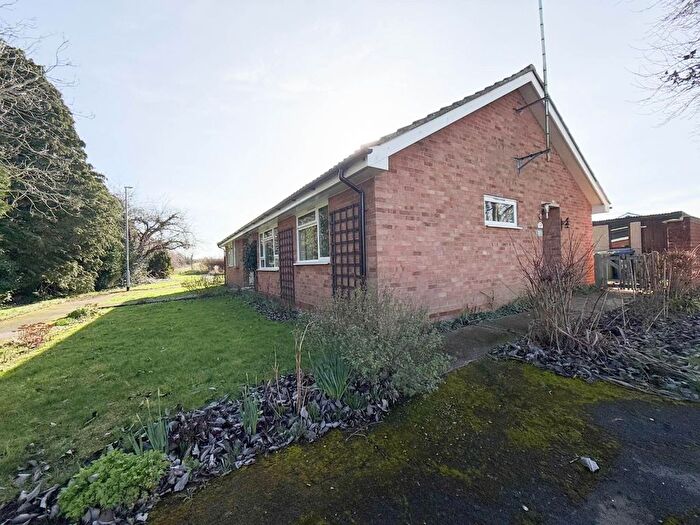
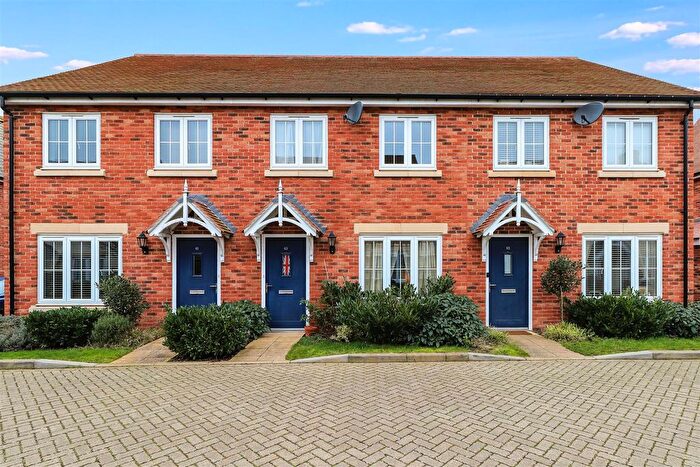
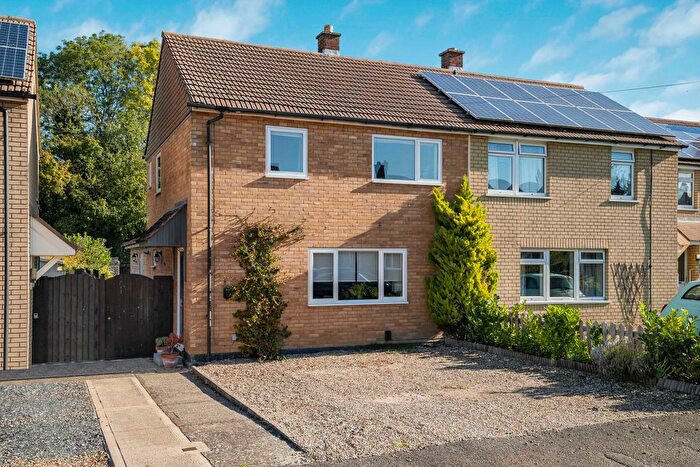
Properties in Duxford have an average house price of £513,424.00 and had 67 Property Transactions within the last 3 years¹.
Duxford is an area in Cambridge, Cambridgeshire with 884 households², where the most expensive property was sold for £1,300,000.00.
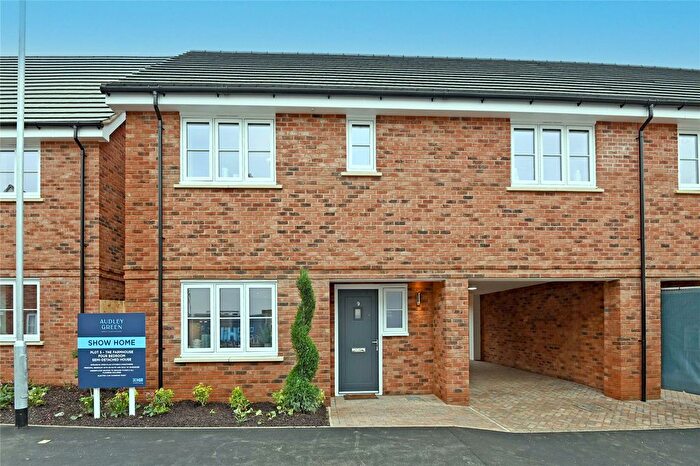
Properties for sale in Duxford
Roads and Postcodes in Duxford
Navigate through our locations to find the location of your next house in Duxford, Cambridge for sale or to rent.
| Streets | Postcodes |
|---|---|
| Adeane Road | CB22 3FN |
| Alms Cottages | CB22 3AN |
| Babraham Road | CB22 3FP |
| Bankes Mead | CB22 4FA |
| Bedell Road | CB22 4AP |
| Bennett Way | CB22 3FR |
| Blakeland Hill | CB22 4RX |
| Brentditch End | CB22 3EY |
| Brewery Road | CB22 3HG |
| Bustlers Rise | CB22 4QU |
| Cambridge Road | CB22 3AF CB22 3AT CB22 3GN |
| Carter Close | CB22 4SB |
| Chapel Street | CB22 4RJ |
| Duxford Airfield | CB22 4QR |
| Elms Close | CB22 4RD |
| Fairhaven Close | CB22 4US |
| Fisher Close | CB22 4XU |
| Glebe Crescent | CB22 3HF |
| Grange Road | CB22 4QE CB22 4WF CB22 4QF |
| Green Street | CB22 4RG |
| Greenacres | CB22 4RB |
| High Street | CB22 3AR CB22 3AZ |
| Highfield Close | CB22 4SA |
| Hinxton Road | CB22 4SD |
| Honeysuckle Lane | CB22 3AL |
| Hunts Road | CB22 4RE CB22 4RF |
| Ickleton Road | CB22 4RT CB22 4QB CB22 4XQ |
| Industrial Estate | CB22 3FX |
| Kintbury | CB22 4RR |
| Knight's Orchard | CB22 4AG |
| Laceys Way | CB22 4SE |
| London Hill | CB22 3AS |
| London Road | CB22 3EG CB22 3FJ |
| Long Lane | CB22 4RW |
| Maarnford Close | CB22 4AB |
| Mangers Lane | CB22 4RN |
| Markby Close | CB22 4RS |
| Martin Drive | CB22 4AQ |
| Marven Road | CB22 3GF |
| Mill Lane | CB22 4PT |
| Moorfield Road | CB22 4PP CB22 4PS |
| Newmarket Road | CB21 6AW CB22 3EZ |
| Oak Lane | CB22 3UY |
| Owls Close | CB22 4PL |
| Parsonage Close | CB22 4SJ |
| Petersfield Road | CB22 4SF |
| Railway Close | CB22 3FY CB22 3FZ |
| Rectory Road | CB22 4RY CB22 4RZ |
| Rowley Lane | CB22 3AW |
| Royston Road | CB22 4NW CB22 4QG |
| St Johns Street | CB22 4RA |
| St Peters Street | CB22 4RP |
| Station Road | CB22 3FF CB22 3HB |
| Temple Close | CB22 4PX |
| The Biggen | CB22 4SQ |
| The Causeway | CB22 3EX |
| The Firs | CB22 4PY |
| The Green | CB22 4RH |
| The Moraine | CB22 4AH |
| The Old Nursery | CB22 4PJ |
| The Rustons | CB22 4SG |
| CB22 3FH CB22 3HD CB22 4QX |
Transport near Duxford
- FAQ
- Price Paid By Year
- Property Type Price
Frequently asked questions about Duxford
What is the average price for a property for sale in Duxford?
The average price for a property for sale in Duxford is £513,424. This amount is 0.31% lower than the average price in Cambridge. There are 1,126 property listings for sale in Duxford.
What streets have the most expensive properties for sale in Duxford?
The streets with the most expensive properties for sale in Duxford are Mangers Lane at an average of £1,300,000, The Green at an average of £1,105,000 and Royston Road at an average of £707,666.
What streets have the most affordable properties for sale in Duxford?
The streets with the most affordable properties for sale in Duxford are Knight's Orchard at an average of £105,000, Laceys Way at an average of £201,248 and Rectory Road at an average of £331,250.
Which train stations are available in or near Duxford?
Some of the train stations available in or near Duxford are Whittlesford, Great Chesterford and Shelford.
Property Price Paid in Duxford by Year
The average sold property price by year was:
| Year | Average Sold Price | Price Change |
Sold Properties
|
|---|---|---|---|
| 2025 | £586,808 | 15% |
25 Properties |
| 2024 | £496,770 | 13% |
24 Properties |
| 2023 | £433,708 | -40% |
18 Properties |
| 2022 | £608,261 | 17% |
16 Properties |
| 2021 | £504,829 | 9% |
44 Properties |
| 2020 | £459,263 | -6% |
19 Properties |
| 2019 | £487,226 | 4% |
30 Properties |
| 2018 | £466,124 | -1% |
43 Properties |
| 2017 | £472,625 | 15% |
32 Properties |
| 2016 | £401,836 | -17% |
29 Properties |
| 2015 | £469,942 | 27% |
26 Properties |
| 2014 | £344,470 | -1% |
34 Properties |
| 2013 | £346,193 | 2% |
30 Properties |
| 2012 | £338,319 | 10% |
28 Properties |
| 2011 | £303,352 | 4% |
34 Properties |
| 2010 | £291,483 | 7% |
52 Properties |
| 2009 | £272,500 | -32% |
20 Properties |
| 2008 | £360,747 | 20% |
19 Properties |
| 2007 | £287,065 | 9% |
28 Properties |
| 2006 | £262,428 | -5% |
46 Properties |
| 2005 | £274,958 | -5% |
30 Properties |
| 2004 | £289,501 | 17% |
27 Properties |
| 2003 | £239,413 | 23% |
54 Properties |
| 2002 | £183,314 | -26% |
34 Properties |
| 2001 | £231,782 | 26% |
42 Properties |
| 2000 | £171,858 | 12% |
26 Properties |
| 1999 | £150,557 | 21% |
41 Properties |
| 1998 | £119,440 | -4% |
25 Properties |
| 1997 | £124,541 | 25% |
50 Properties |
| 1996 | £93,569 | -6% |
36 Properties |
| 1995 | £99,043 | - |
23 Properties |
Property Price per Property Type in Duxford
Here you can find historic sold price data in order to help with your property search.
The average Property Paid Price for specific property types in the last three years are:
| Property Type | Average Sold Price | Sold Properties |
|---|---|---|
| Semi Detached House | £450,193.00 | 24 Semi Detached Houses |
| Detached House | £653,526.00 | 31 Detached Houses |
| Terraced House | £302,332.00 | 9 Terraced Houses |
| Flat | £204,833.00 | 3 Flats |

