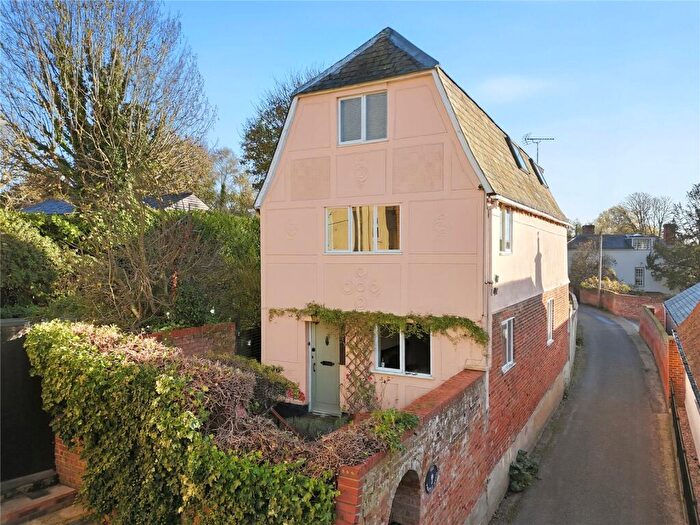
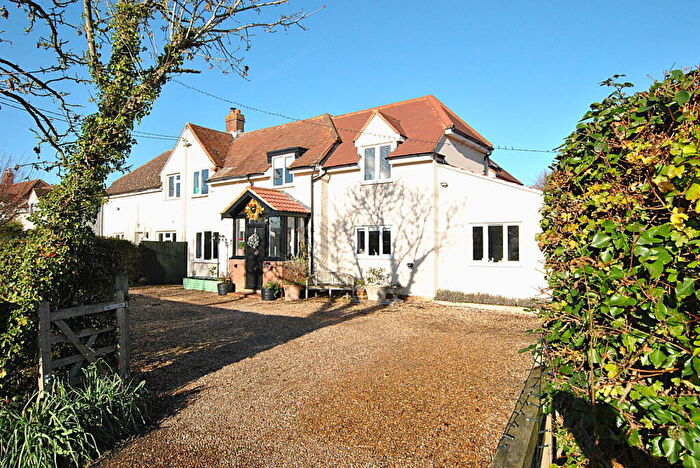
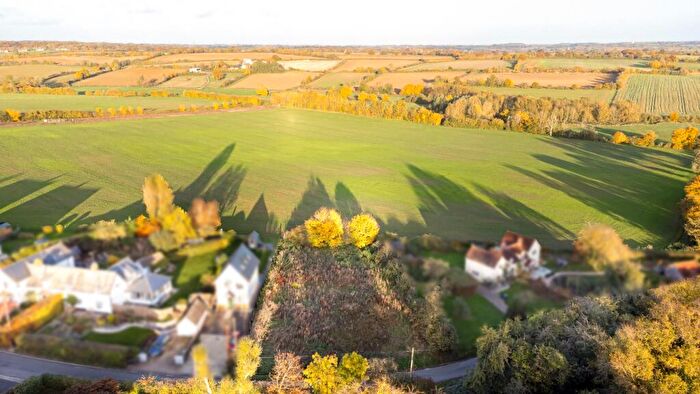
Houses for sale & to rent in The Sampfords, Saffron Walden
House Prices in The Sampfords
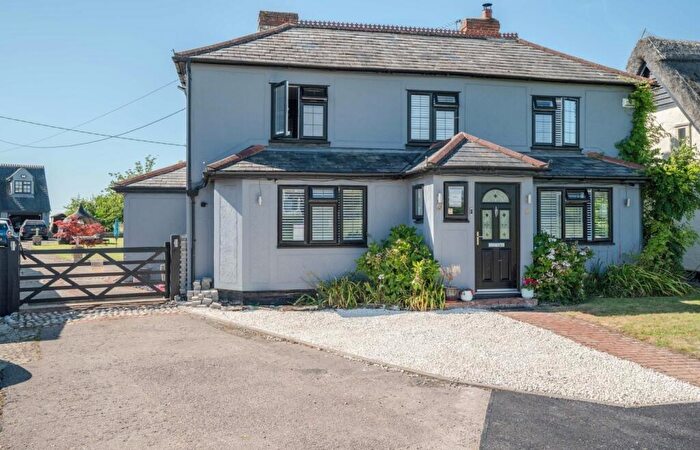
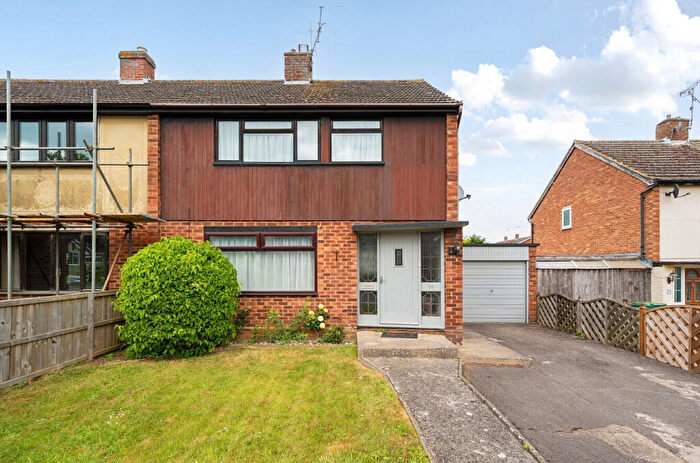
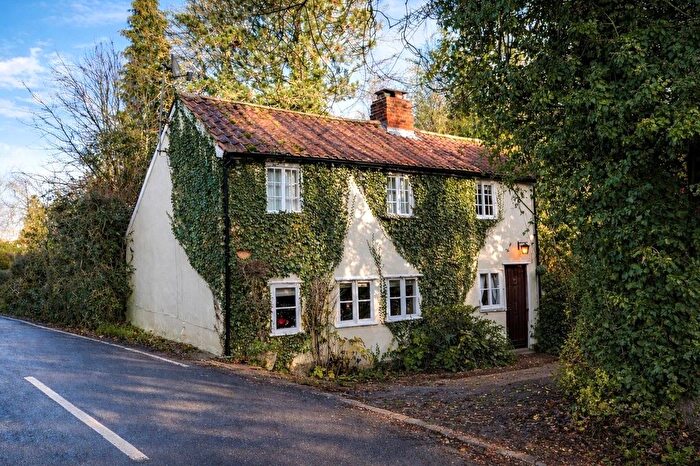
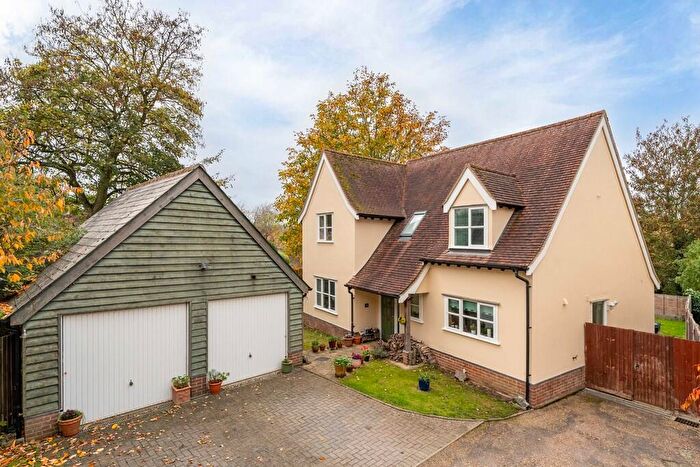
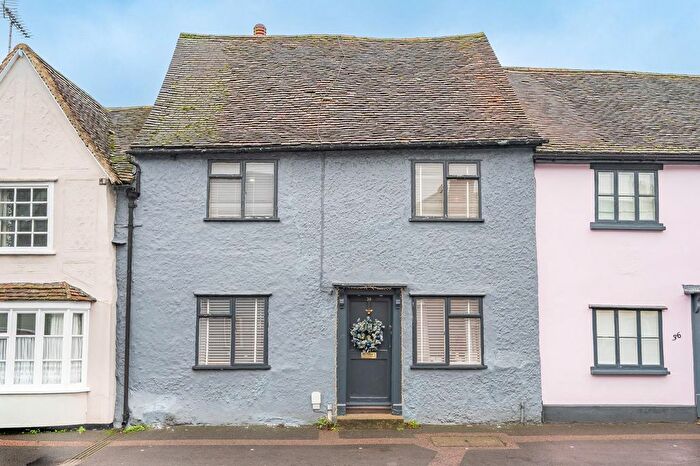
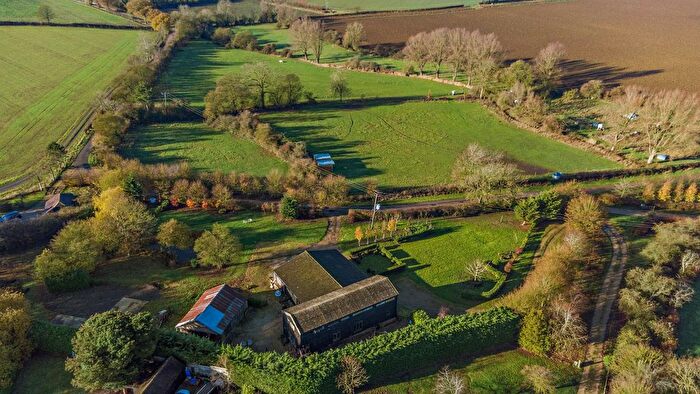
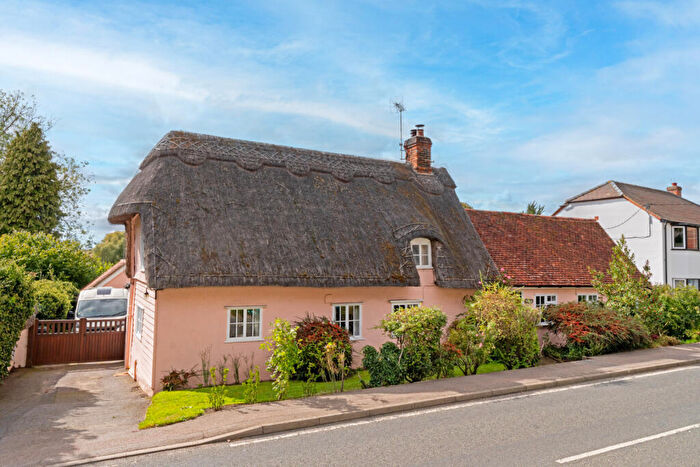
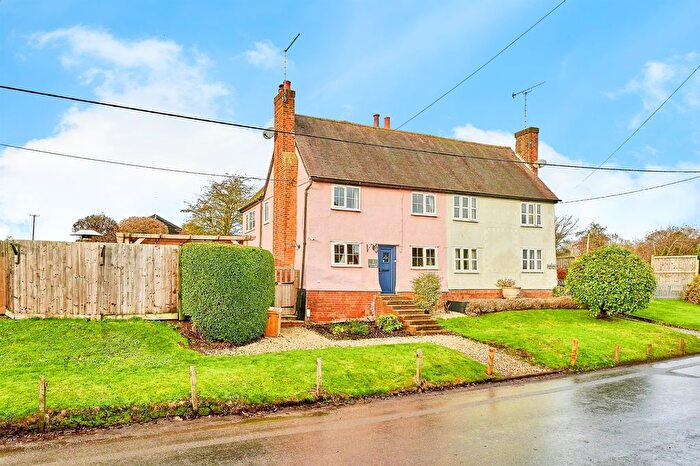
Properties in The Sampfords have an average house price of £692,800.00 and had 78 Property Transactions within the last 3 years¹.
The Sampfords is an area in Saffron Walden, Essex with 726 households², where the most expensive property was sold for £2,100,000.00.
Properties for sale in The Sampfords
Roads and Postcodes in The Sampfords
Navigate through our locations to find the location of your next house in The Sampfords, Saffron Walden for sale or to rent.
| Streets | Postcodes |
|---|---|
| Anso Corner | CB10 2NU |
| Anso Road | CB10 2PQ |
| Ashdon Road | CB10 2UA |
| Beech Cottages | CB10 2SN |
| Bumpstead Road | CB10 2PP CB10 2PW |
| Bush Road | CB10 2RY |
| Church Hill | CB10 2PA CB10 2SX CB10 2PB |
| East View Close | CB10 2TZ |
| Everitt Road | CB10 2RF |
| Finchingfield Road | CB10 2PR CB10 2QN CB10 2QT |
| Gillon Way | CB10 2FU |
| Golden Lane | CB10 2UB |
| Hall Road | CB10 2FN |
| Harvey Way | CB10 2PL |
| Hawkins Hill | CB10 2QW |
| Hempstead Road | CB10 2TH CB10 2TQ |
| High Street | CB10 2PD CB10 2PE CB10 2RG |
| High Tree Bungalow | CB10 2QQ |
| Hill Road | CB10 2PH CB10 2RT |
| Homebridge | CB10 2SB |
| Howe Lane | CB10 2NY CB10 2NZ |
| Hydes Gate Cottages | CM6 3QB |
| Longcroft | CB10 2PU |
| Maple Lane | CB10 2SR |
| Maynards Lane | CB10 2QP |
| Mill End | CB10 2TJ |
| Monks Corner | CB10 2RW |
| Moor End | CB10 2RQ |
| Oxen End | CM7 4PS |
| Parsonage Farm Lane | CB10 2RR |
| Princes Well | CB10 2TE |
| Radwinter End | CB10 2UD CB10 2UE |
| Robletts Villas | CB10 2RN |
| Sampford Hall Lane | CB10 2QG CB10 2QF |
| Sampford Road | CB10 2TL |
| South View | CB10 2TG |
| Sparepenny Lane | CB10 2RJ |
| Sparepenny Lane North | CB10 2RH |
| Stambourne Road | CB10 2QS |
| Stocking Green | CB10 2SS |
| Thaxted Road | CB10 2RZ CB10 2SA |
| Tindon End | CB10 2RU CB10 2RX CB10 2XT |
| Walden Road | CB10 2SP CB10 2SW |
| Water Lane | CB10 2TX |
| Watson Close | CB10 2RP |
| Well Yard | CB10 2PF |
| West View | CB10 2TY |
| Willetts Field | CB10 2SE |
| Wincelow Hall Road | CB10 2PJ |
| Witchtree Lane | CB10 2PN |
| CB10 2NX CB10 2RL CB10 2RS CB10 2TF CB10 2QE CB10 2QH CB10 2QJ CB10 2QL CB10 2QR CM7 4TL CM7 4TY |
Transport near The Sampfords
-
Newport (Essex) Station
-
Audley End Station
-
Elsenham Station
-
Great Chesterford Station
-
Stansted Airport Station
- FAQ
- Price Paid By Year
- Property Type Price
Frequently asked questions about The Sampfords
What is the average price for a property for sale in The Sampfords?
The average price for a property for sale in The Sampfords is £692,800. This amount is 31% higher than the average price in Saffron Walden. There are 1,401 property listings for sale in The Sampfords.
What streets have the most expensive properties for sale in The Sampfords?
The streets with the most expensive properties for sale in The Sampfords are Tindon End at an average of £1,387,500, Howe Lane at an average of £1,251,666 and Bumpstead Road at an average of £1,070,710.
What streets have the most affordable properties for sale in The Sampfords?
The streets with the most affordable properties for sale in The Sampfords are Willetts Field at an average of £303,300, Harvey Way at an average of £330,000 and Witchtree Lane at an average of £430,000.
Which train stations are available in or near The Sampfords?
Some of the train stations available in or near The Sampfords are Newport (Essex), Audley End and Elsenham.
Property Price Paid in The Sampfords by Year
The average sold property price by year was:
| Year | Average Sold Price | Price Change |
Sold Properties
|
|---|---|---|---|
| 2025 | £668,833 | -10% |
12 Properties |
| 2024 | £736,755 | 4% |
26 Properties |
| 2023 | £706,044 | 9% |
18 Properties |
| 2022 | £643,090 | -12% |
22 Properties |
| 2021 | £718,442 | 5% |
26 Properties |
| 2020 | £683,375 | 11% |
28 Properties |
| 2019 | £607,649 | 17% |
30 Properties |
| 2018 | £502,727 | 5% |
33 Properties |
| 2017 | £476,532 | -21% |
38 Properties |
| 2016 | £574,539 | 16% |
25 Properties |
| 2015 | £480,705 | -13% |
38 Properties |
| 2014 | £541,270 | 24% |
24 Properties |
| 2013 | £410,522 | -19% |
22 Properties |
| 2012 | £487,467 | -8% |
31 Properties |
| 2011 | £525,218 | 10% |
19 Properties |
| 2010 | £473,090 | -7% |
11 Properties |
| 2009 | £506,245 | 16% |
12 Properties |
| 2008 | £426,850 | 13% |
10 Properties |
| 2007 | £369,482 | -1% |
29 Properties |
| 2006 | £372,834 | 21% |
39 Properties |
| 2005 | £294,644 | 2% |
19 Properties |
| 2004 | £288,073 | -20% |
26 Properties |
| 2003 | £346,412 | 20% |
35 Properties |
| 2002 | £277,851 | -16% |
34 Properties |
| 2001 | £321,196 | 25% |
25 Properties |
| 2000 | £240,938 | 17% |
25 Properties |
| 1999 | £200,334 | 14% |
33 Properties |
| 1998 | £173,104 | -0,5% |
31 Properties |
| 1997 | £173,912 | 24% |
28 Properties |
| 1996 | £132,436 | 3% |
32 Properties |
| 1995 | £127,891 | - |
19 Properties |
Property Price per Property Type in The Sampfords
Here you can find historic sold price data in order to help with your property search.
The average Property Paid Price for specific property types in the last three years are:
| Property Type | Average Sold Price | Sold Properties |
|---|---|---|
| Semi Detached House | £527,694.00 | 17 Semi Detached Houses |
| Detached House | £796,906.00 | 52 Detached Houses |
| Terraced House | £403,166.00 | 9 Terraced Houses |

