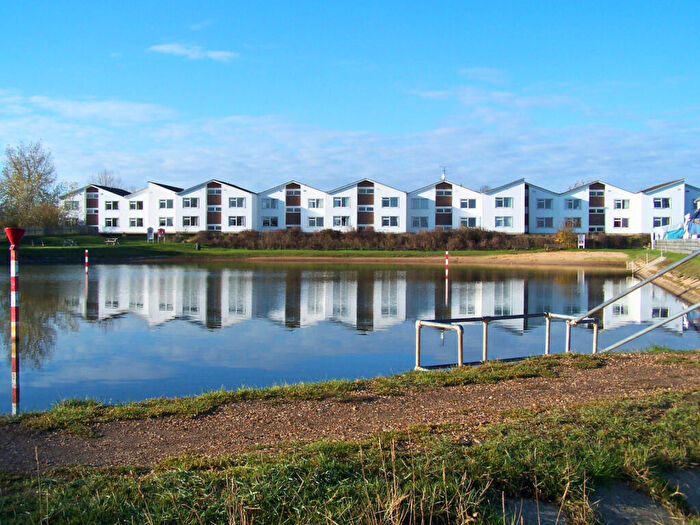
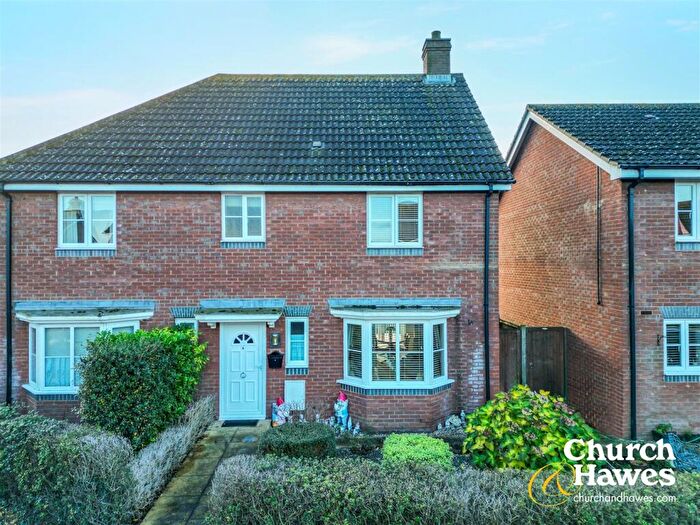
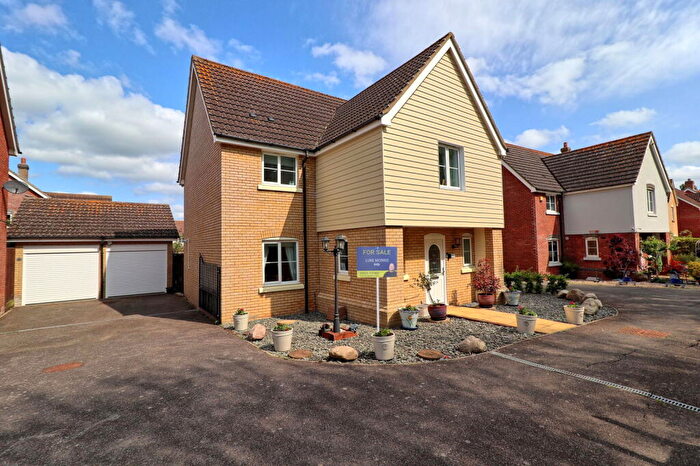
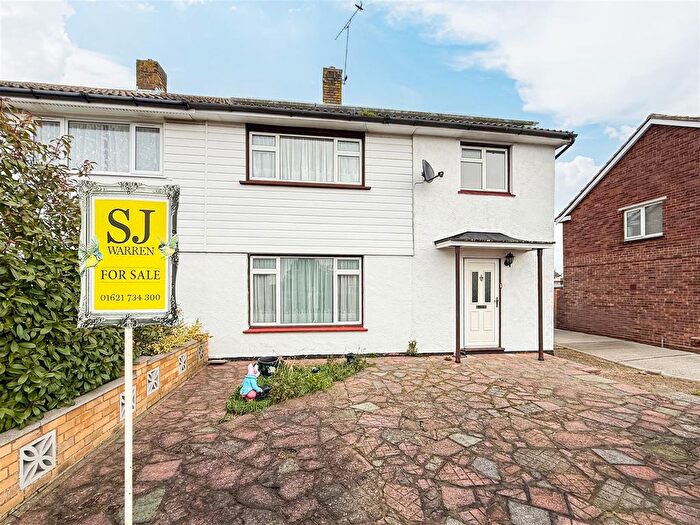
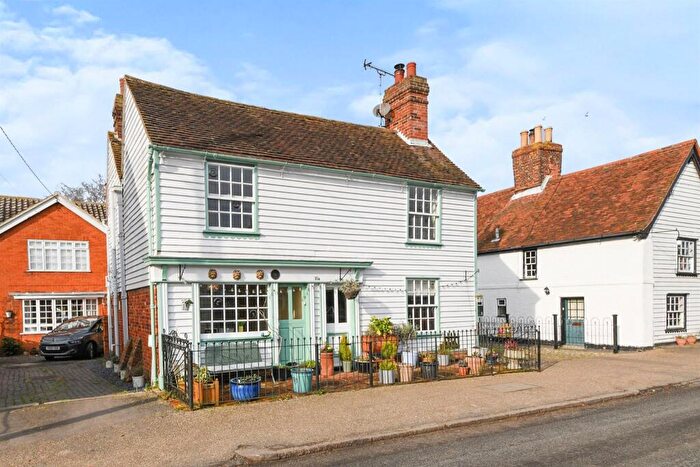
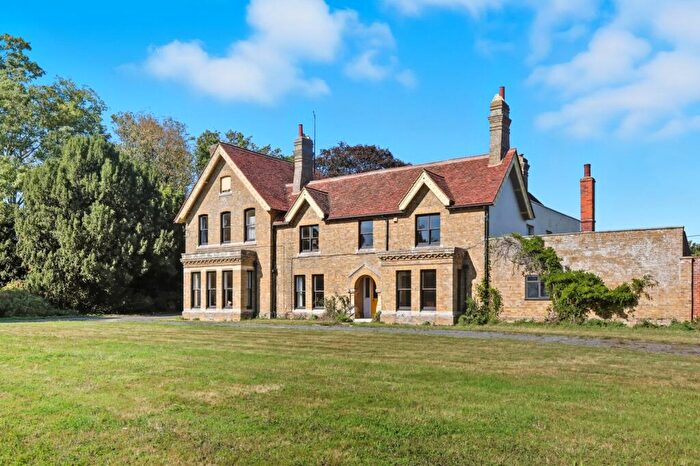
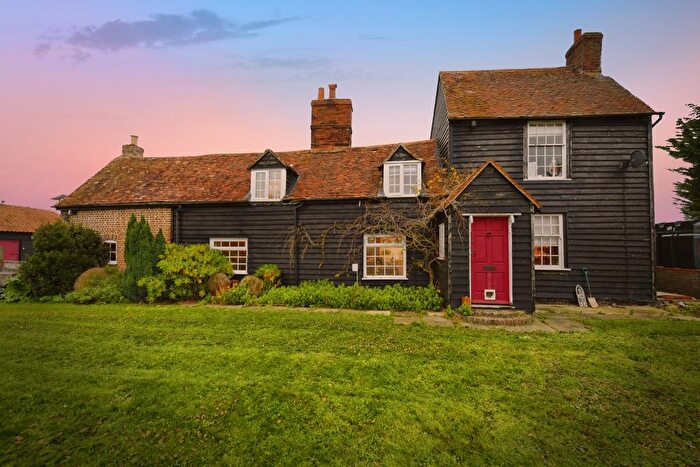
Houses for sale & to rent in Tillingham, Southminster
House Prices in Tillingham
Properties in Tillingham have an average house price of £468,248.00 and had 91 Property Transactions within the last 3 years¹.
Tillingham is an area in Southminster, Essex with 882 households², where the most expensive property was sold for £1,950,000.00.
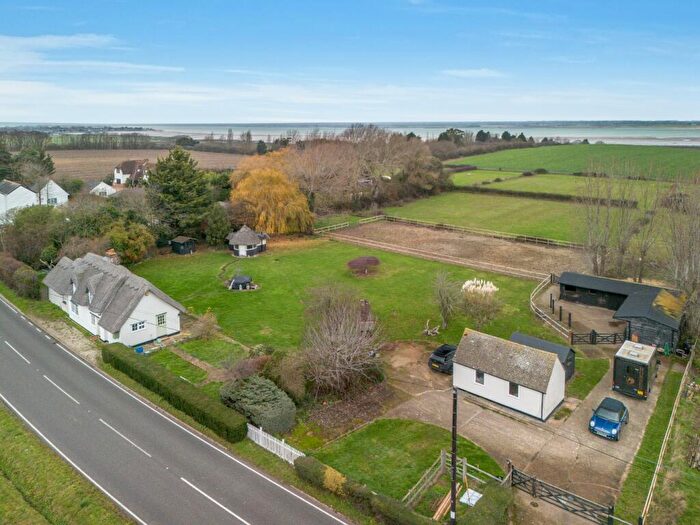
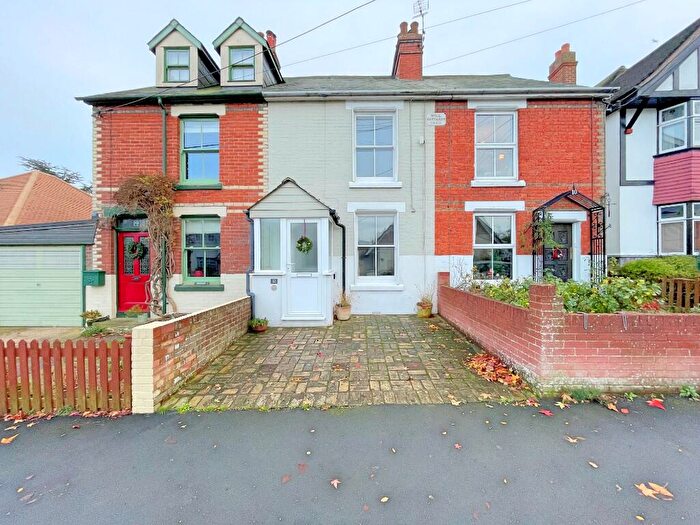
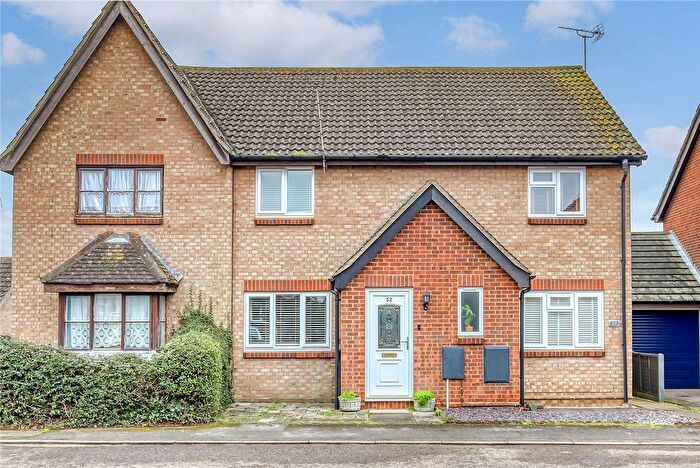
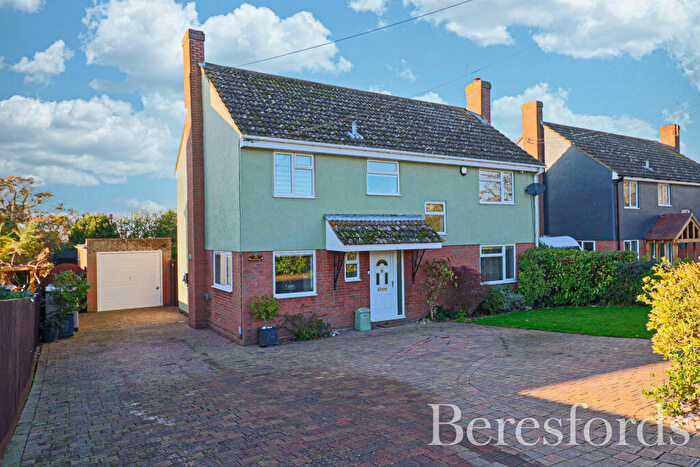
Properties for sale in Tillingham
Roads and Postcodes in Tillingham
Navigate through our locations to find the location of your next house in Tillingham, Southminster for sale or to rent.
| Streets | Postcodes |
|---|---|
| Bacons Chase | CM0 7PH |
| Badnocks Cottages | CM0 7LD |
| Bakery Close | CM0 7TT |
| Bate Dudley Drive | CM0 7QG |
| Birch Gardens | CM0 7TE |
| Birch Road | CM0 7SX |
| Blackberry Grove | CM0 7QE |
| Bradwell Airfield | CM0 7QF |
| Bradwell Road | CM0 7SP CM0 7SR CM0 7SS |
| Brook Lane | CM0 7DY CM0 7DX |
| Brook Road | CM0 7SG CM0 7TS |
| Buckeridge Way | CM0 7QQ |
| Caidge Row | CM0 7PY |
| Casey Lane | CM0 7TD |
| Chancel Close | CM0 7SA |
| Chapel Lane | CM0 7TL |
| Downhall Beach | CM0 7HW |
| Downhall Road | CM0 7QP |
| East End Road | CM0 7PP CM0 7PR CM0 7PS CM0 7PT CM0 7PU CM0 7PW CM0 7PX CM0 7PN |
| East Ware Cottages | CM0 7UN |
| Englefields | CM0 7AT |
| Forge Cottages | CM0 7QW |
| Glebe Lane | CM0 7UE |
| Grange Road | CM0 7UA CM0 7UB CM0 7UR CM0 7UT |
| Green Lane | CM0 7DU |
| Hall Road | CM0 7EA CM0 7JD CM0 7JF |
| High Street | CM0 7QL CM0 7QN |
| Hockley Close | CM0 7QD |
| Hockley Lane | CM0 7PZ CM0 7QA CM0 7QB |
| Keelings Lane | CM0 7JL |
| Keelings Road | CM0 7FG CM0 7US |
| Kings Farm Meadow | CM0 7GY |
| Kingswood Court | CM0 7QH |
| Maldon Road | CM0 7HR CM0 7HS CM0 7HU CM0 7HY CM0 7HZ CM0 7PJ |
| Manor Road | CM0 7UG CM0 7UH CM0 7UQ |
| Manyweathers Houses | CM0 7HT |
| Marlborough Avenue | CM0 7TN |
| Marsh Road | CM0 7JU CM0 7SJ CM0 7SW CM0 7SZ CM0 7SL CM0 7SN |
| Mill Close | CM0 7TF |
| Mill End | CM0 7HH CM0 7HJ CM0 7HL CM0 7HN |
| Mill Road | CM0 7SY |
| North Street | CM0 7ST CM0 7TR |
| Prospect Villas | CM0 7QX |
| Rushes Lane | CM0 7NY |
| Shoemenders Lane | CM0 7GQ |
| South Street | CM0 7QJ CM0 7TB CM0 7TH CM0 7TJ |
| Southfields | CM0 7FY |
| Southminster Road | CM0 7DZ CM0 7UF |
| St Lawrence Road | CM0 7SD CM0 7SB CM0 7SE |
| St Nicholas Road | CM0 7SH CM0 7SQ |
| St Peters Court | CM0 7JE |
| Stowe's Lane | CM0 7XB |
| The Marshes | CM0 7JG |
| The Square | CM0 7SU CM0 7TA CM0 7TP |
| Tillingham Road | CM0 7UD CM0 7YJ |
| Trusses Road | CM0 7QS |
| Vicarage Lane | CM0 7TW |
| Waterside Road | CM0 7QT CM0 7QZ CM0 7QU CM0 7QY CM0 7RA CM0 7RB |
| Wessley Close | CM0 7TG |
| CM0 7HX CM0 7NX CM0 7PL CM0 7UP CM0 7HP CM0 7JB CM0 7UJ CM0 7UL |
Transport near Tillingham
- FAQ
- Price Paid By Year
- Property Type Price
Frequently asked questions about Tillingham
What is the average price for a property for sale in Tillingham?
The average price for a property for sale in Tillingham is £468,248. This amount is 21% higher than the average price in Southminster. There are 557 property listings for sale in Tillingham.
What streets have the most expensive properties for sale in Tillingham?
The streets with the most expensive properties for sale in Tillingham are Grange Road at an average of £975,000, St Peters Court at an average of £750,000 and Caidge Row at an average of £675,000.
What streets have the most affordable properties for sale in Tillingham?
The streets with the most affordable properties for sale in Tillingham are High Street at an average of £256,416, Birch Gardens at an average of £287,333 and The Square at an average of £303,500.
Which train stations are available in or near Tillingham?
Some of the train stations available in or near Tillingham are Southminster, Burnham-On-Crouch and Althorne.
Property Price Paid in Tillingham by Year
The average sold property price by year was:
| Year | Average Sold Price | Price Change |
Sold Properties
|
|---|---|---|---|
| 2025 | £441,428 | -21% |
14 Properties |
| 2024 | £532,823 | 25% |
23 Properties |
| 2023 | £399,642 | -16% |
14 Properties |
| 2022 | £464,517 | 19% |
40 Properties |
| 2021 | £377,582 | 7% |
52 Properties |
| 2020 | £349,609 | -6% |
32 Properties |
| 2019 | £370,218 | 7% |
32 Properties |
| 2018 | £343,225 | -3% |
33 Properties |
| 2017 | £352,852 | 15% |
40 Properties |
| 2016 | £298,760 | 1% |
48 Properties |
| 2015 | £294,746 | 6% |
46 Properties |
| 2014 | £276,048 | 16% |
41 Properties |
| 2013 | £230,848 | -3% |
33 Properties |
| 2012 | £238,066 | -0,3% |
15 Properties |
| 2011 | £238,747 | -17% |
18 Properties |
| 2010 | £279,529 | 33% |
17 Properties |
| 2009 | £187,050 | -34% |
19 Properties |
| 2008 | £250,083 | 12% |
18 Properties |
| 2007 | £219,616 | -0,3% |
47 Properties |
| 2006 | £220,183 | -22% |
54 Properties |
| 2005 | £267,776 | 10% |
34 Properties |
| 2004 | £241,838 | 2% |
22 Properties |
| 2003 | £236,426 | 27% |
31 Properties |
| 2002 | £173,275 | 30% |
47 Properties |
| 2001 | £122,151 | -9% |
34 Properties |
| 2000 | £133,260 | 16% |
40 Properties |
| 1999 | £111,273 | 16% |
31 Properties |
| 1998 | £93,889 | 22% |
46 Properties |
| 1997 | £73,666 | -14% |
34 Properties |
| 1996 | £83,929 | 16% |
40 Properties |
| 1995 | £70,144 | - |
37 Properties |
Property Price per Property Type in Tillingham
Here you can find historic sold price data in order to help with your property search.
The average Property Paid Price for specific property types in the last three years are:
| Property Type | Average Sold Price | Sold Properties |
|---|---|---|
| Semi Detached House | £329,978.00 | 26 Semi Detached Houses |
| Detached House | £583,153.00 | 50 Detached Houses |
| Terraced House | £321,321.00 | 14 Terraced Houses |
| Flat | £375,000.00 | 1 Flat |

