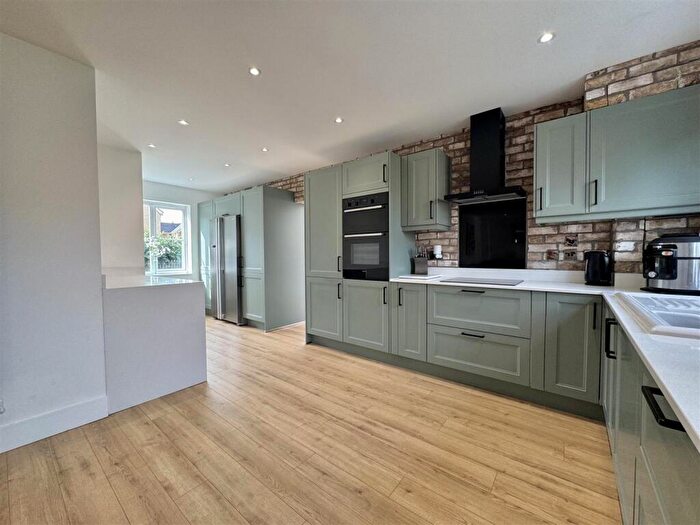
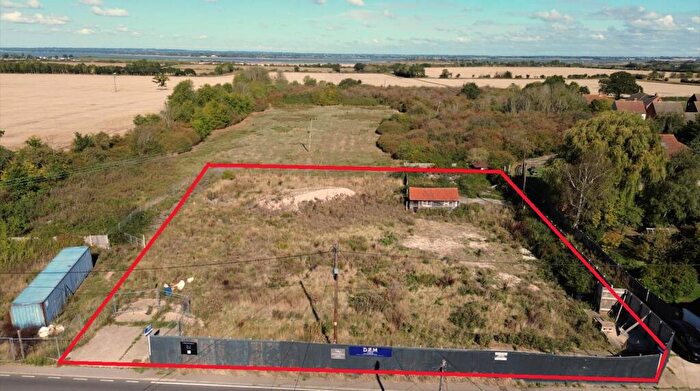
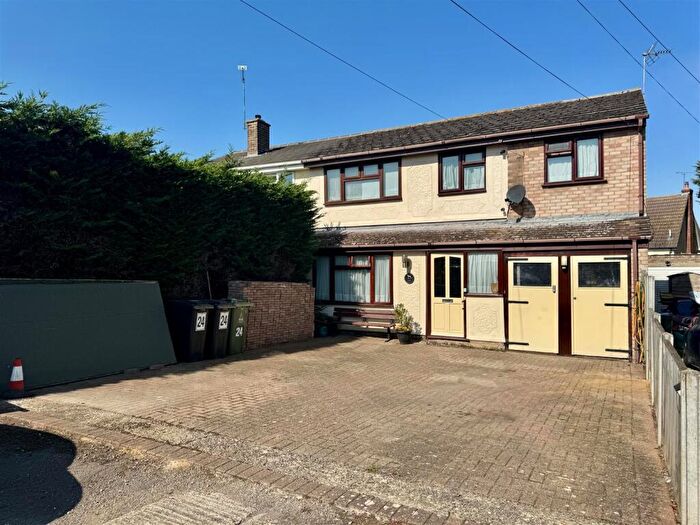
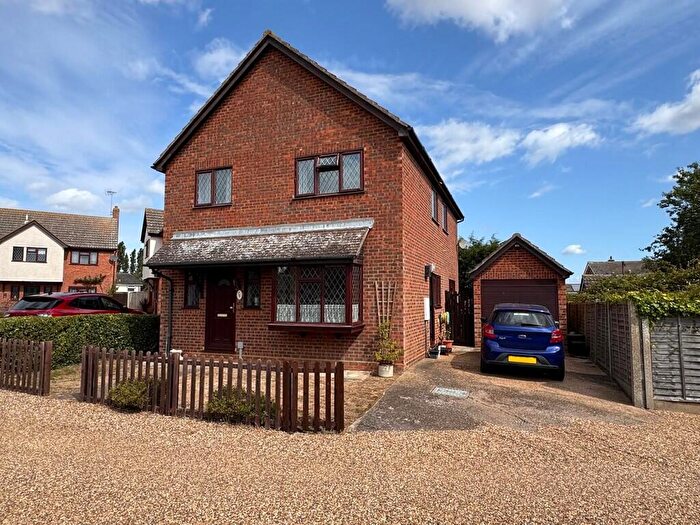
Houses for sale & to rent in Mayland, Southminster
House Prices in Mayland
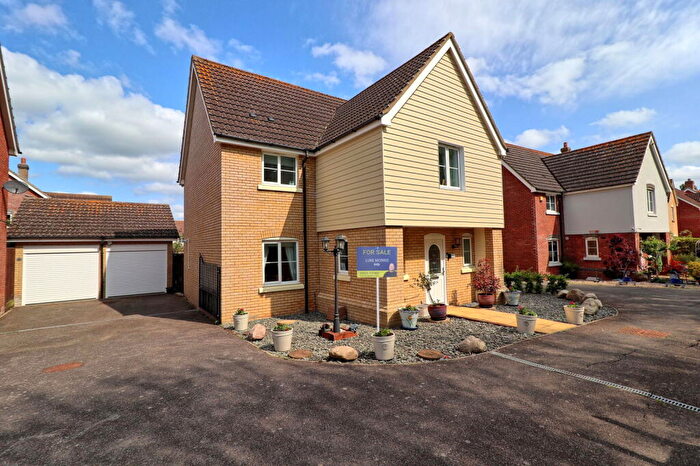
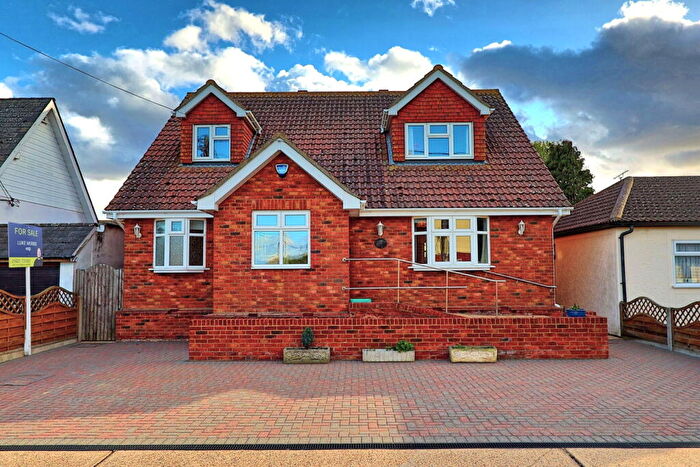
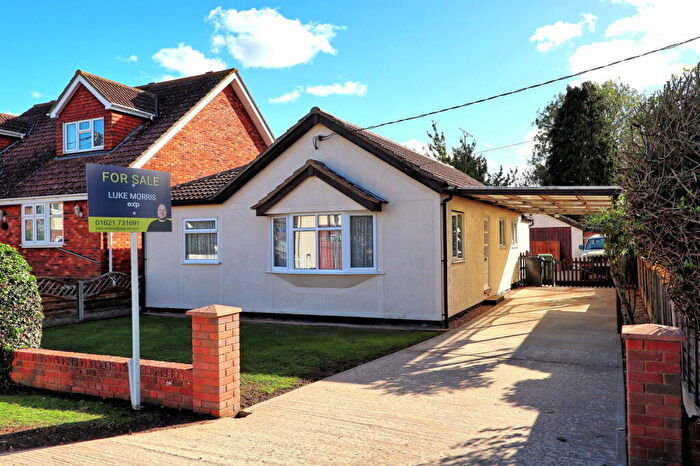
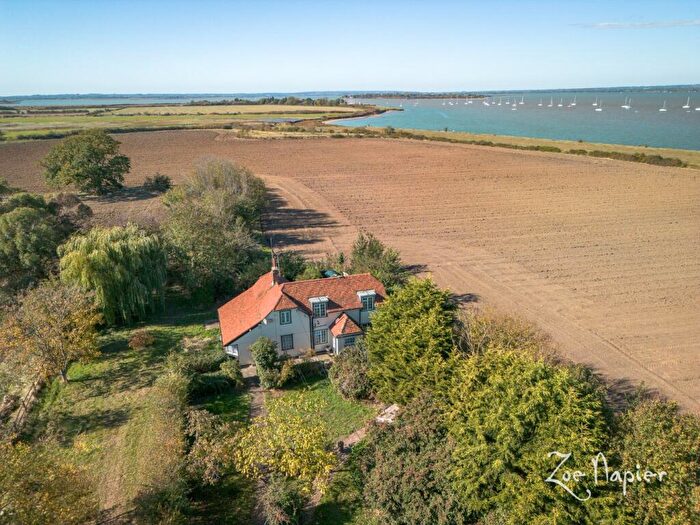
Properties in Mayland have an average house price of £434,646.00 and had 65 Property Transactions within the last 3 years¹.
Mayland is an area in Southminster, Essex with 783 households², where the most expensive property was sold for £1,530,000.00.
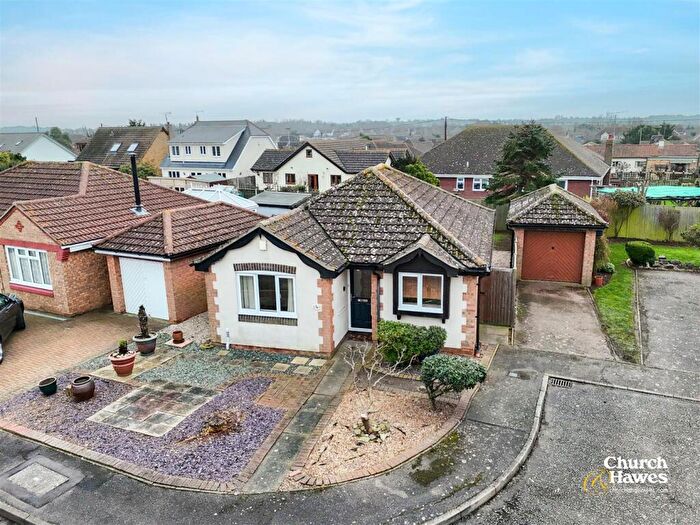
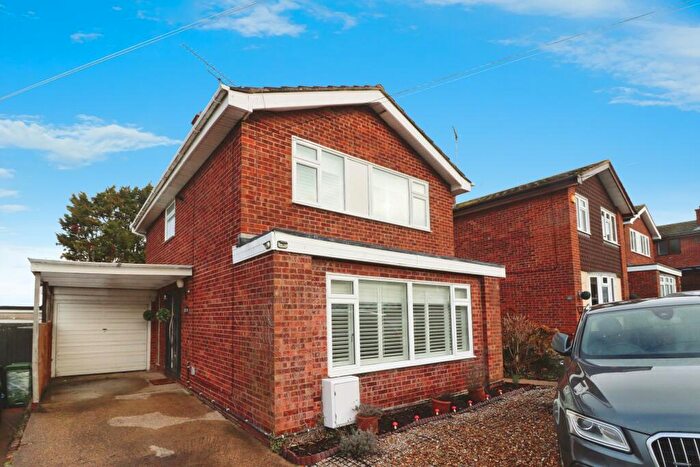
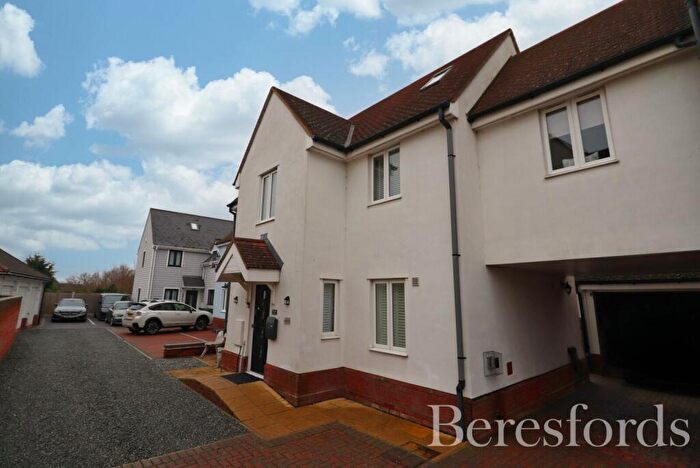
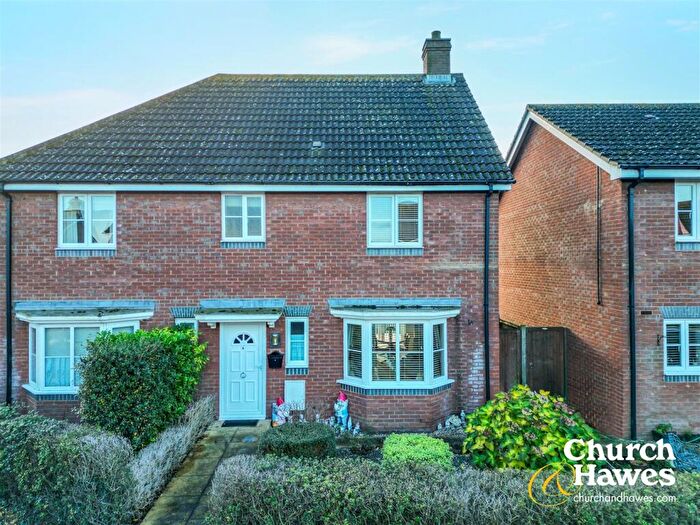
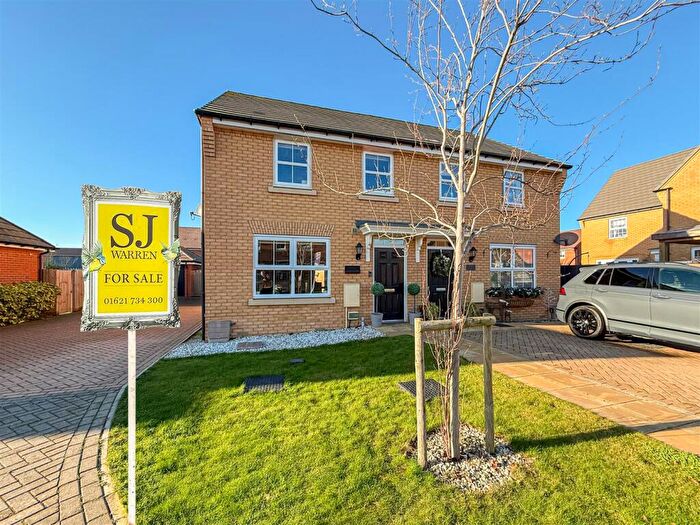
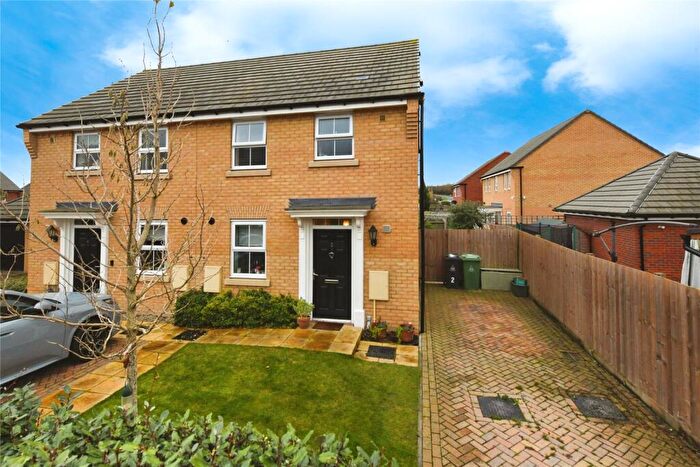
Properties for sale in Mayland
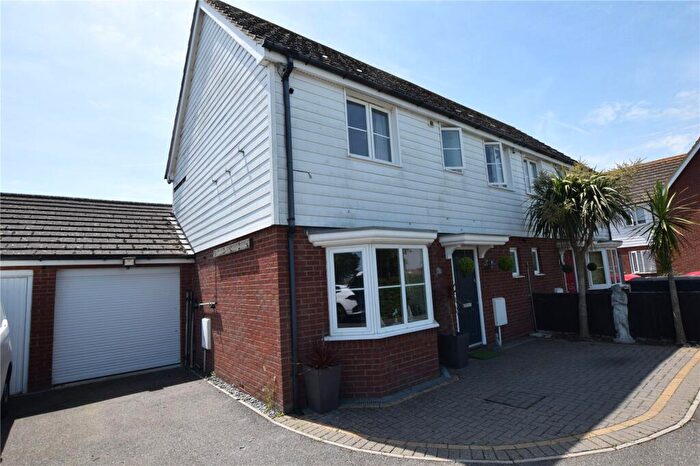
Previously listed properties in Mayland
Roads and Postcodes in Mayland
Navigate through our locations to find the location of your next house in Mayland, Southminster for sale or to rent.
| Streets | Postcodes |
|---|---|
| Anchorage View | CM0 7JH |
| Batts Road | CM0 7LE |
| Bay View | CM0 7RF |
| Beachy Drive | CM0 7NB |
| Blackwater Mews | CM0 7LX |
| Bradwell Road | CM0 7LH CM0 7LL CM0 7LP CM0 7LW CM0 7LJ |
| Canney Road | CM0 7RS |
| Garden Close | CM0 7LG |
| Garden Fields | CM0 7JY |
| High View | CM0 7NP |
| Main Road | CM0 7LY CM0 7NA CM0 7LR |
| Maldon Road | CM0 7RN CM0 7RP CM0 7RR CM0 7RT |
| Medley Way | CM0 7JZ |
| Moorhen Avenue | CM0 7LT CM0 7LU |
| Mountview Crescent | CM0 7NR CM0 7NS CM0 7NT |
| Riverton Drive | CM0 7NG CM0 7NQ |
| Scarletts | CM0 7NJ |
| Sea View Parade | CM0 7PB |
| Sea View Promenade | CM0 7NE |
| Seaway | CM0 7ND |
| Southminster Road | CM0 7NZ |
| Spa Drive | CM0 7NN |
| St Lawrence Drive | CM0 7NH CM0 7NL |
| St Lawrence Hill | CM0 7LN |
| Stansgate Road | CM0 7LQ CM0 7NU |
| Sunnyway | CM0 7PA |
| The Plovers | CM0 7PE |
| The Spinnaker | CM0 7GR |
| The Street | CM0 7LF CM0 7RH CM0 7RJ CM0 7RL CM0 7RU |
| Tinnocks Lane | CM0 7NF |
| Wick Farm Road | CM0 7PF |
| CM0 7RW |
Transport near Mayland
-
Southminster Station
-
Althorne Station
-
Burnham-On-Crouch Station
-
North Fambridge Station
-
Hockley Station
-
South Woodham Ferrers Station
-
Rochford Station
- FAQ
- Price Paid By Year
- Property Type Price
Frequently asked questions about Mayland
What is the average price for a property for sale in Mayland?
The average price for a property for sale in Mayland is £434,646. This amount is 13% higher than the average price in Southminster. There are 614 property listings for sale in Mayland.
What streets have the most expensive properties for sale in Mayland?
The streets with the most expensive properties for sale in Mayland are Canney Road at an average of £1,165,000, Batts Road at an average of £827,500 and Tinnocks Lane at an average of £599,000.
What streets have the most affordable properties for sale in Mayland?
The streets with the most affordable properties for sale in Mayland are The Plovers at an average of £202,500, St Lawrence Drive at an average of £256,666 and Blackwater Mews at an average of £325,000.
Which train stations are available in or near Mayland?
Some of the train stations available in or near Mayland are Southminster, Althorne and Burnham-On-Crouch.
Property Price Paid in Mayland by Year
The average sold property price by year was:
| Year | Average Sold Price | Price Change |
Sold Properties
|
|---|---|---|---|
| 2025 | £472,086 | 14% |
23 Properties |
| 2024 | £404,772 | -5% |
22 Properties |
| 2023 | £424,450 | 4% |
20 Properties |
| 2022 | £407,307 | 5% |
26 Properties |
| 2021 | £385,308 | 15% |
60 Properties |
| 2020 | £328,978 | 1% |
23 Properties |
| 2019 | £324,400 | 1% |
28 Properties |
| 2018 | £321,904 | -7% |
42 Properties |
| 2017 | £343,312 | 23% |
32 Properties |
| 2016 | £263,835 | -9% |
43 Properties |
| 2015 | £287,023 | 22% |
42 Properties |
| 2014 | £225,014 | -19% |
66 Properties |
| 2013 | £268,240 | 18% |
25 Properties |
| 2012 | £219,533 | 7% |
30 Properties |
| 2011 | £204,724 | -16% |
20 Properties |
| 2010 | £237,841 | 12% |
38 Properties |
| 2009 | £208,380 | -16% |
21 Properties |
| 2008 | £241,529 | 14% |
34 Properties |
| 2007 | £207,871 | 1% |
63 Properties |
| 2006 | £206,586 | 4% |
72 Properties |
| 2005 | £198,032 | 0,3% |
65 Properties |
| 2004 | £197,455 | 9% |
58 Properties |
| 2003 | £179,595 | 22% |
34 Properties |
| 2002 | £140,499 | 16% |
41 Properties |
| 2001 | £118,155 | 16% |
45 Properties |
| 2000 | £99,687 | 6% |
37 Properties |
| 1999 | £94,020 | 9% |
50 Properties |
| 1998 | £86,027 | 13% |
52 Properties |
| 1997 | £75,111 | 2% |
48 Properties |
| 1996 | £73,689 | 33% |
25 Properties |
| 1995 | £49,235 | - |
21 Properties |
Property Price per Property Type in Mayland
Here you can find historic sold price data in order to help with your property search.
The average Property Paid Price for specific property types in the last three years are:
| Property Type | Average Sold Price | Sold Properties |
|---|---|---|
| Semi Detached House | £341,750.00 | 8 Semi Detached Houses |
| Detached House | £449,160.00 | 56 Detached Houses |
| Terraced House | £365,000.00 | 1 Terraced House |

