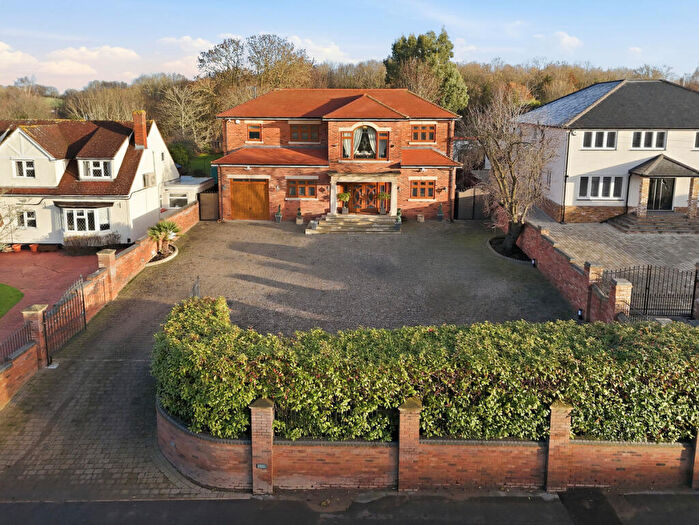
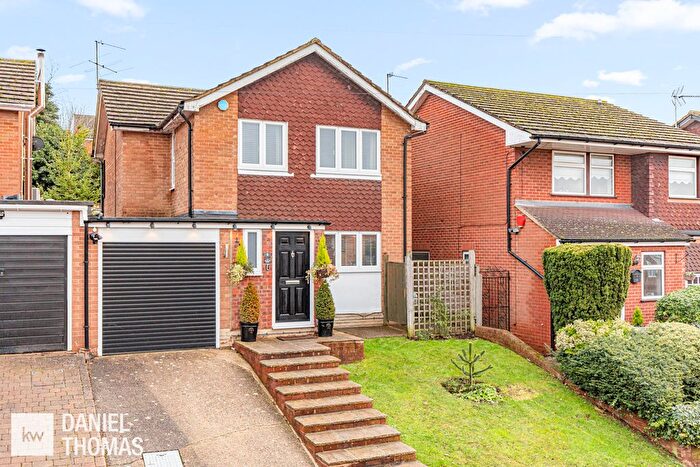
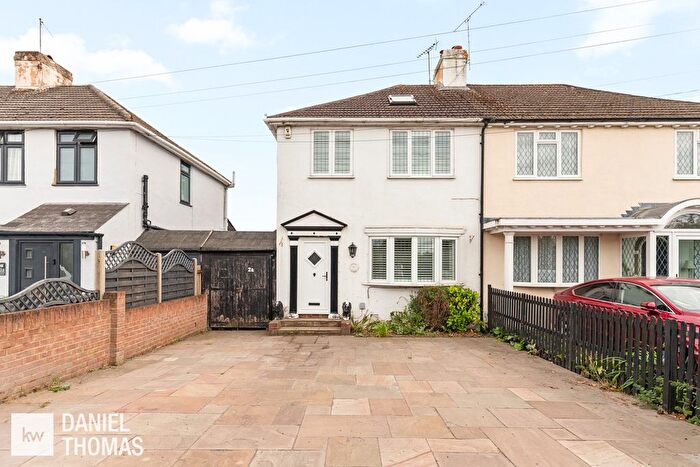
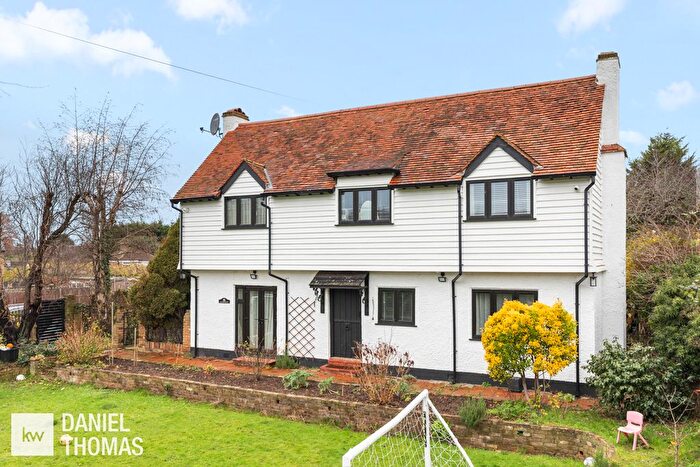
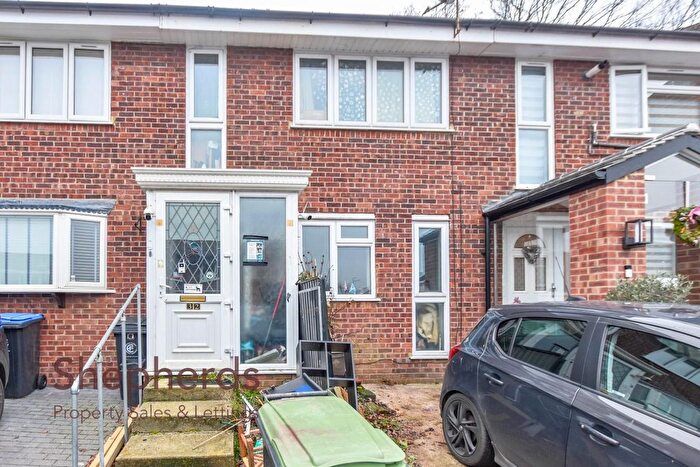
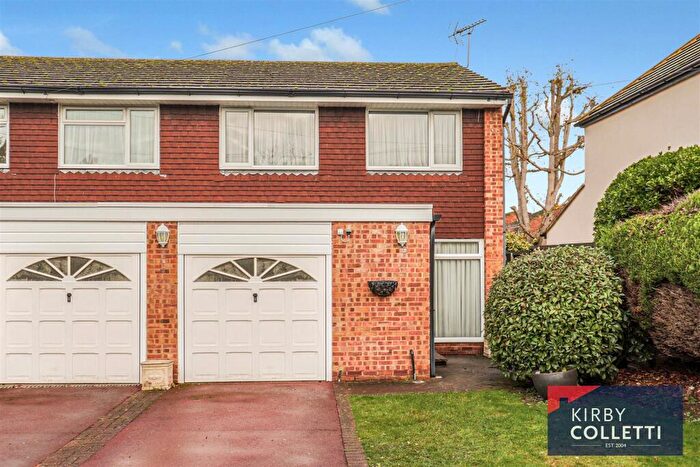
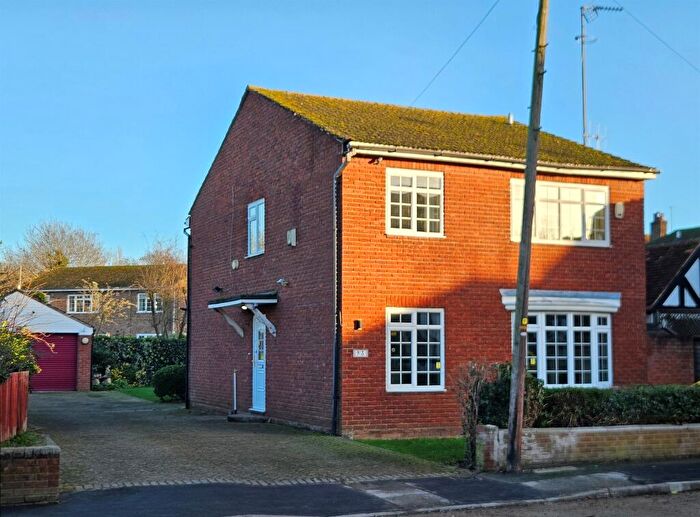
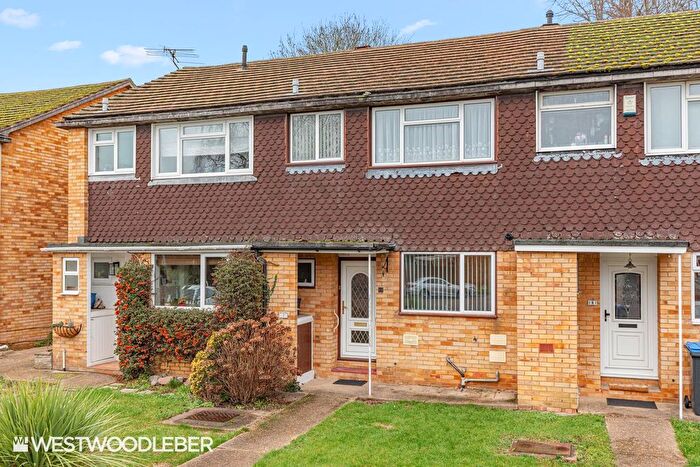
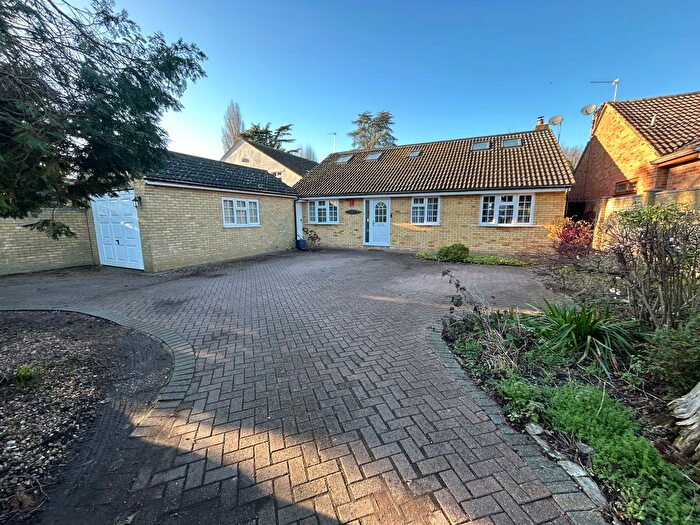
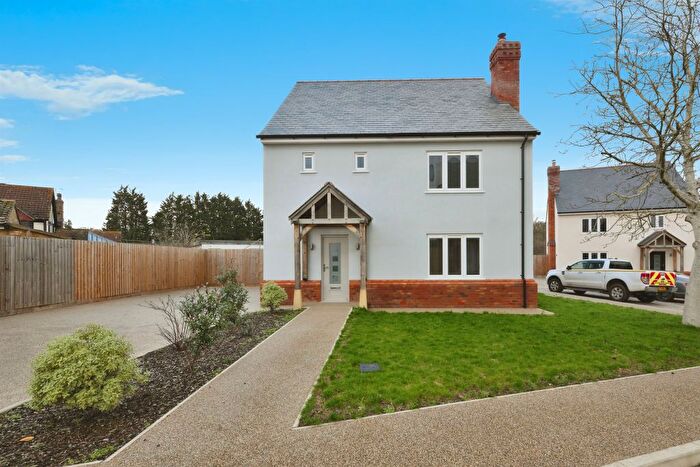
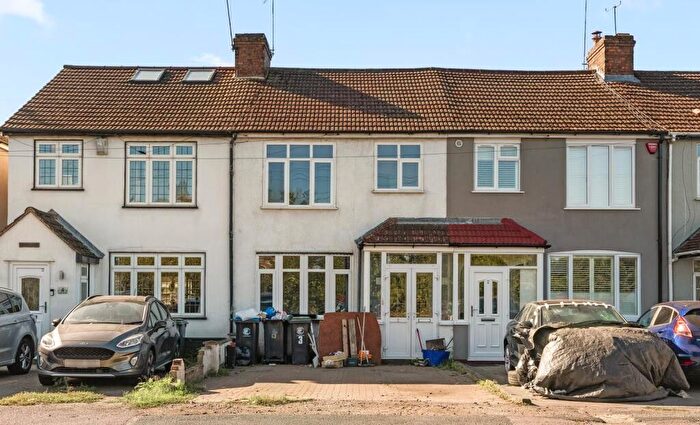
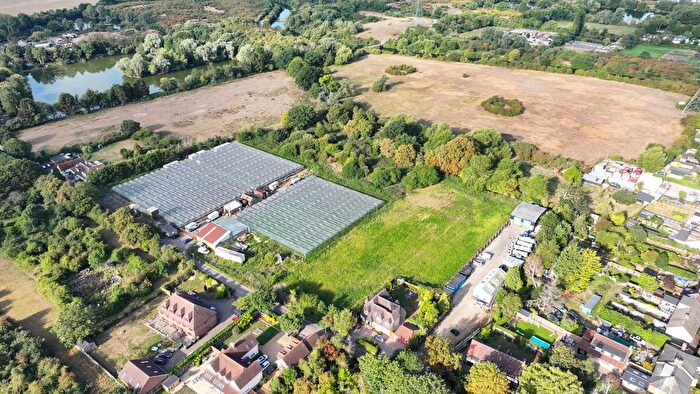
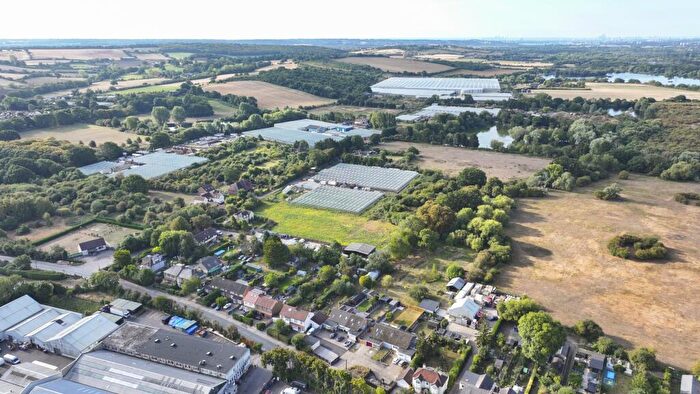
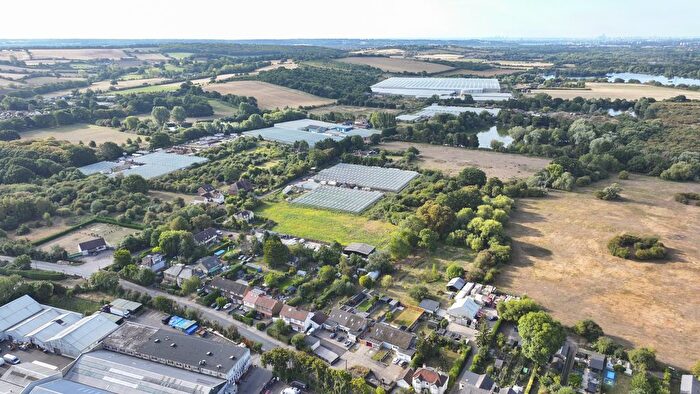
Houses for sale & to rent in Lower Nazeing, Waltham Abbey
House Prices in Lower Nazeing
Properties in Lower Nazeing have an average house price of £579,758.00 and had 164 Property Transactions within the last 3 years¹.
Lower Nazeing is an area in Waltham Abbey, Essex with 1,244 households², where the most expensive property was sold for £2,150,000.00.
Properties for sale in Lower Nazeing
Roads and Postcodes in Lower Nazeing
Navigate through our locations to find the location of your next house in Lower Nazeing, Waltham Abbey for sale or to rent.
| Streets | Postcodes |
|---|---|
| Banes Down | EN9 2NU |
| Barnard Acres | EN9 2LZ |
| Barnfield Close | EN9 2RE |
| Betts Lane | EN9 2DB |
| Blackadder Cottages | EN9 2HX |
| Churchmead | EN9 2HZ |
| Colemans Lane | EN9 2EA |
| Crooked Way | EN9 2LE |
| Elizabeth Close | EN9 2HF |
| Highland Road | EN9 2PR EN9 2PS EN9 2PT EN9 2PU EN9 2PX |
| Hillgrove Business Park | EN9 2HB |
| Hoe Lane | EN9 2RB EN9 2RG EN9 2RJ EN9 2RL EN9 2RN EN9 2RQ EN9 2RW EN9 2RZ |
| Hoecroft | EN9 2RD |
| Hyde Mead | EN9 2HP EN9 2HS EN9 2HT |
| John Eliot Close | EN9 2NZ |
| Kingsmead | EN9 2JA |
| Lake Road | EN9 2NP |
| Langfield Close | EN9 2QL |
| Langley Green | EN9 2JJ |
| Laundry Lane | EN9 2DY |
| Maplecroft Lane | EN9 2NR EN9 2NS EN9 2NT |
| Mayflower Close | EN9 2LA |
| Meadgate Road | EN9 2PB EN9 2PD |
| Meadow View | EN9 2BT |
| Middle Street | EN9 2LB EN9 2LD EN9 2LG EN9 2LH EN9 2LQ |
| Nazeing Road | EN9 2HU EN9 2HY EN9 2JN EN9 2BH EN9 2JD EN9 2BQ |
| Nazeingbury Close | EN9 2JT |
| Nazeingbury Parade | EN9 2JL |
| North Street | EN9 2NH EN9 2NJ EN9 2NL EN9 2NN EN9 2NW |
| Nursery Road | EN9 2JE EN9 2JF EN9 2JQ |
| Old House Lane | EN9 2LJ |
| Palmers Grove | EN9 2QE EN9 2QF EN9 2QG |
| Paynes Lane | EN9 2EU EN9 2EY EN9 2EZ EN9 2EX |
| Pecks Hill | EN9 2NX EN9 2NY |
| Pound Close | EN9 2HR |
| Sedge Green | EN9 2PA EN9 2BF |
| Shooters Drive | EN9 2QA EN9 2QB EN9 2QD |
| St Leonards Road | EN9 2HG EN9 2HJ EN9 2HN EN9 2HQ EN9 2HW EN9 2BE |
| Sunnyside | EN9 2RH |
| Tatsfield Avenue | EN9 2HH |
| Tatsfield Houses | EN9 2HL |
| Tatsford Villas | EN9 2JB |
| Tovey Close | EN9 2LY |
| Waltham Road | EN9 2EB |
| Western Road | EN9 2QH EN9 2QJ EN9 2QN EN9 2QQ |
| Wheelers Close | EN9 2RA |
| Wheelers Green | EN9 2LF |
| Whitehall Close | EN9 2PY |
Transport near Lower Nazeing
- FAQ
- Price Paid By Year
- Property Type Price
Frequently asked questions about Lower Nazeing
What is the average price for a property for sale in Lower Nazeing?
The average price for a property for sale in Lower Nazeing is £579,758. This amount is 36% higher than the average price in Waltham Abbey. There are 837 property listings for sale in Lower Nazeing.
What streets have the most expensive properties for sale in Lower Nazeing?
The streets with the most expensive properties for sale in Lower Nazeing are Hoe Lane at an average of £840,620, Middle Street at an average of £833,750 and John Eliot Close at an average of £720,000.
What streets have the most affordable properties for sale in Lower Nazeing?
The streets with the most affordable properties for sale in Lower Nazeing are Tovey Close at an average of £368,333, Barnard Acres at an average of £374,000 and Nazeingbury Parade at an average of £375,000.
Which train stations are available in or near Lower Nazeing?
Some of the train stations available in or near Lower Nazeing are Broxbourne, Rye House and Cheshunt.
Property Price Paid in Lower Nazeing by Year
The average sold property price by year was:
| Year | Average Sold Price | Price Change |
Sold Properties
|
|---|---|---|---|
| 2025 | £580,785 | -5% |
34 Properties |
| 2024 | £611,920 | 10% |
44 Properties |
| 2023 | £550,423 | -4% |
36 Properties |
| 2022 | £571,877 | -2% |
50 Properties |
| 2021 | £580,775 | 3% |
58 Properties |
| 2020 | £564,891 | 0,1% |
37 Properties |
| 2019 | £564,169 | 15% |
38 Properties |
| 2018 | £480,453 | -16% |
54 Properties |
| 2017 | £555,779 | 19% |
50 Properties |
| 2016 | £451,901 | -3% |
59 Properties |
| 2015 | £465,480 | 1% |
56 Properties |
| 2014 | £462,728 | 19% |
52 Properties |
| 2013 | £376,024 | 7% |
41 Properties |
| 2012 | £347,999 | 3% |
36 Properties |
| 2011 | £339,144 | 4% |
31 Properties |
| 2010 | £326,985 | 6% |
32 Properties |
| 2009 | £307,500 | -24% |
30 Properties |
| 2008 | £381,679 | 3% |
40 Properties |
| 2007 | £370,546 | 23% |
70 Properties |
| 2006 | £283,721 | -18% |
70 Properties |
| 2005 | £334,917 | 9% |
46 Properties |
| 2004 | £304,304 | 7% |
52 Properties |
| 2003 | £281,489 | 10% |
65 Properties |
| 2002 | £253,909 | 13% |
67 Properties |
| 2001 | £221,071 | 16% |
67 Properties |
| 2000 | £186,804 | 9% |
51 Properties |
| 1999 | £169,564 | 14% |
53 Properties |
| 1998 | £145,544 | 3% |
44 Properties |
| 1997 | £141,727 | 27% |
48 Properties |
| 1996 | £104,081 | -25% |
67 Properties |
| 1995 | £130,095 | - |
47 Properties |
Property Price per Property Type in Lower Nazeing
Here you can find historic sold price data in order to help with your property search.
The average Property Paid Price for specific property types in the last three years are:
| Property Type | Average Sold Price | Sold Properties |
|---|---|---|
| Semi Detached House | £491,680.00 | 77 Semi Detached Houses |
| Detached House | £756,339.00 | 63 Detached Houses |
| Terraced House | £405,391.00 | 23 Terraced Houses |
| Flat | £247,500.00 | 1 Flat |

