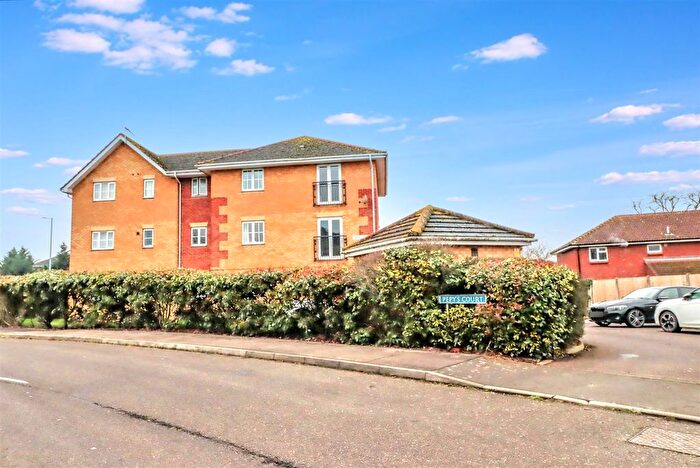
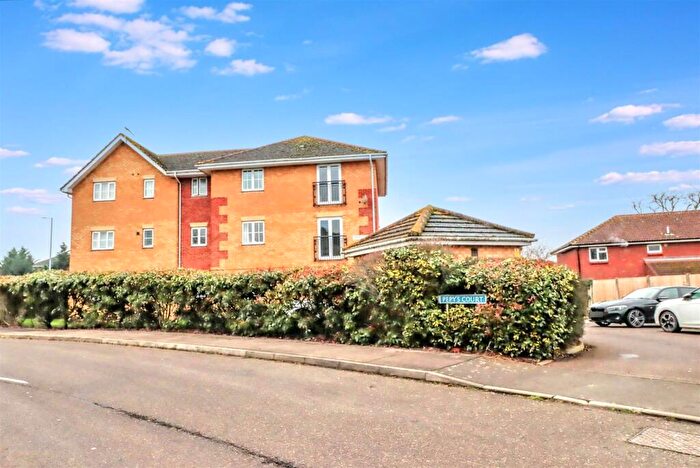
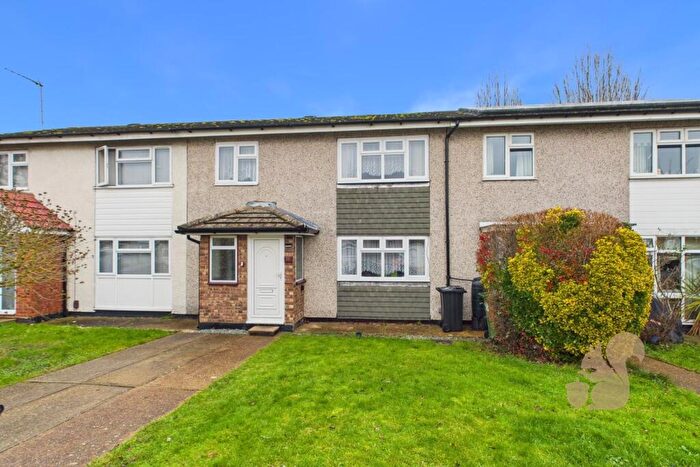
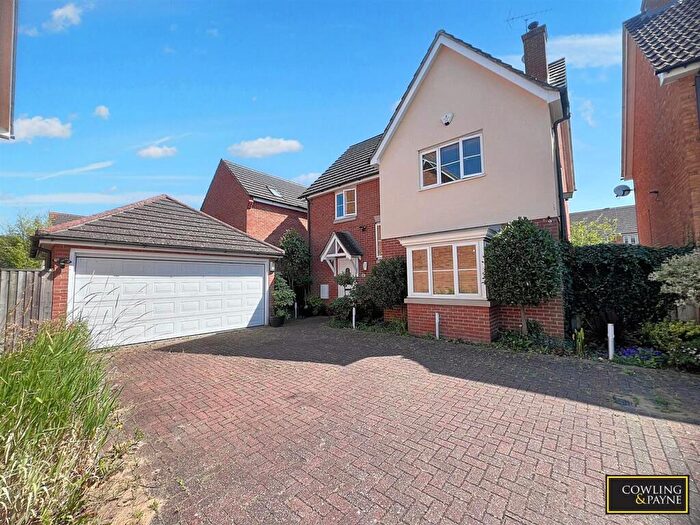
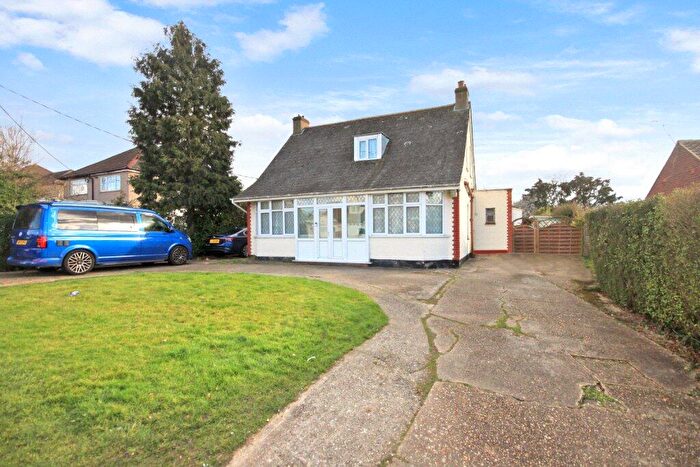
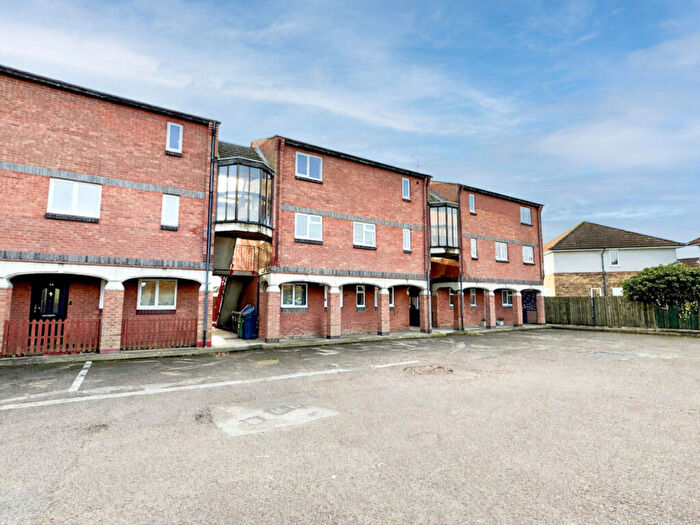
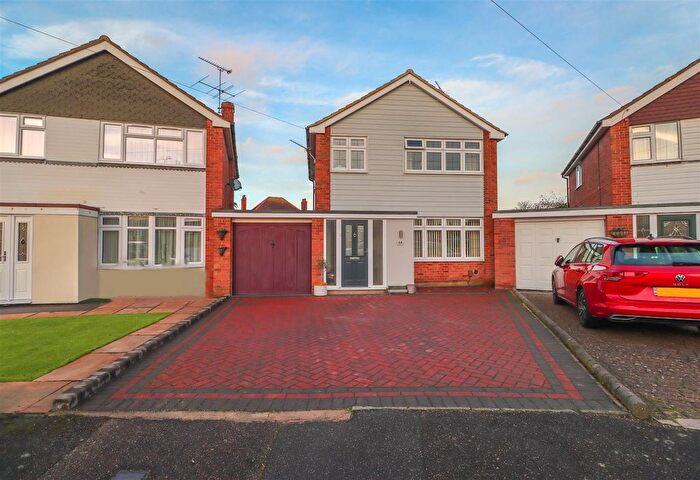
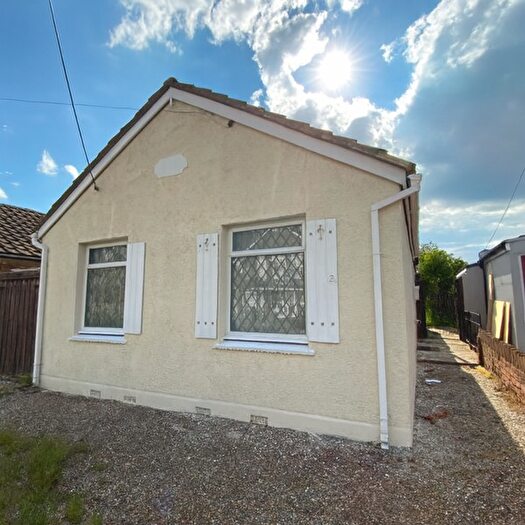
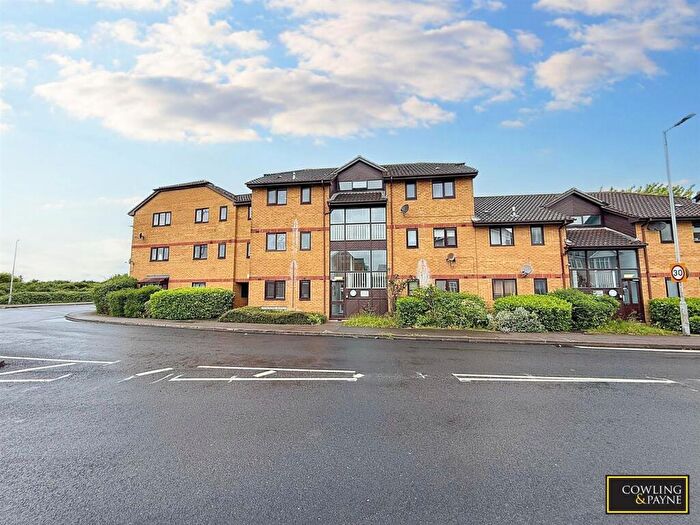
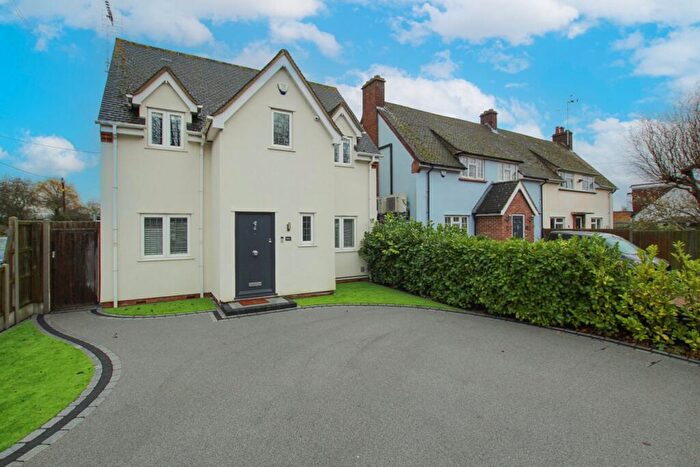
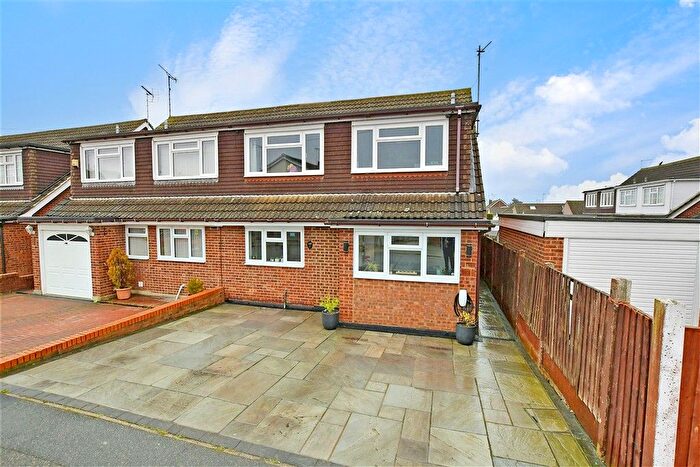
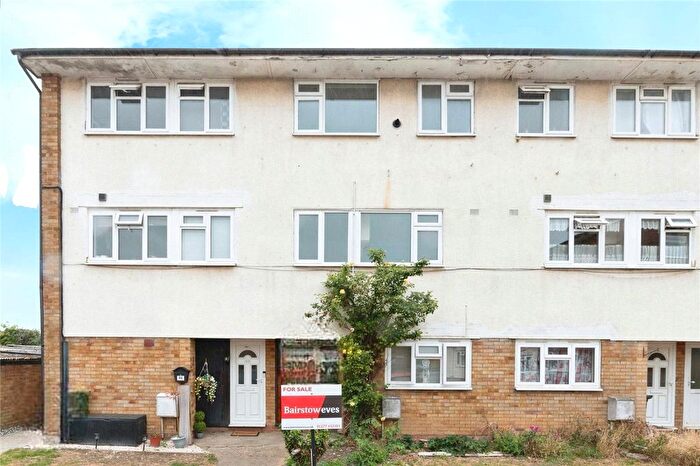
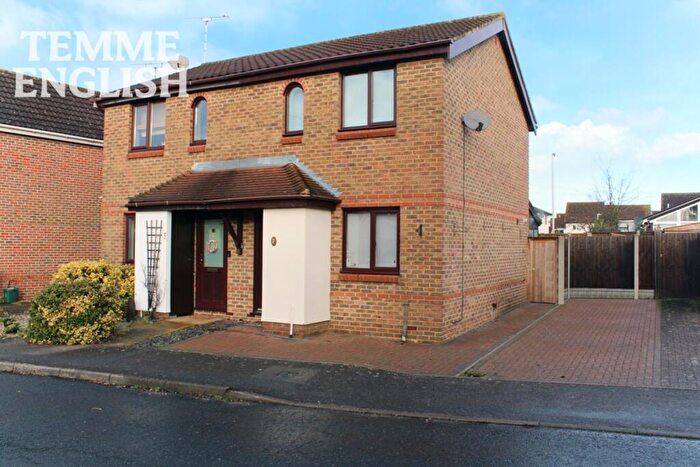
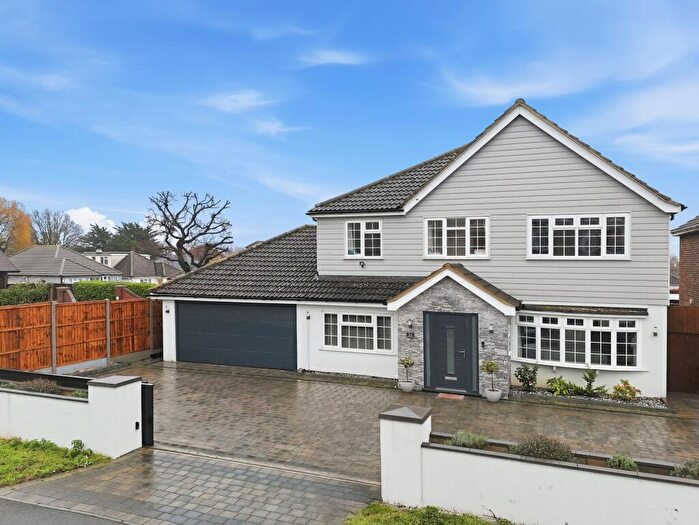
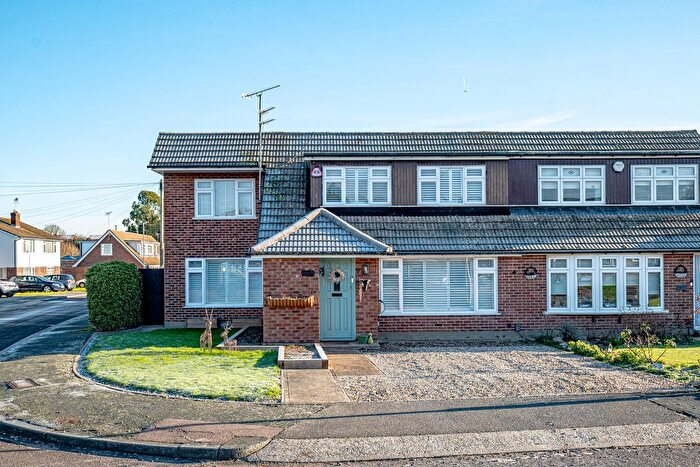
Houses for sale & to rent in Wickford Castledon, Wickford
House Prices in Wickford Castledon
Properties in Wickford Castledon have an average house price of £382,330.00 and had 447 Property Transactions within the last 3 years¹.
Wickford Castledon is an area in Wickford, Essex with 3,253 households², where the most expensive property was sold for £1,250,000.00.
Properties for sale in Wickford Castledon
Roads and Postcodes in Wickford Castledon
Navigate through our locations to find the location of your next house in Wickford Castledon, Wickford for sale or to rent.
| Streets | Postcodes |
|---|---|
| Albany Road | SS12 9BP SS12 9BU |
| Alma Close | SS12 0HJ |
| Almond Avenue | SS12 0BN |
| Arterial Road | SS14 3JH |
| Azalea Avenue | SS12 0BD SS12 0BQ |
| Belmont Avenue | SS12 0HG SS12 0HP |
| Belmont Close | SS12 0HR |
| Berry Close | SS12 0LS |
| Borwick Lane | SS12 0QA |
| Bridge House Close | SS12 0BE |
| Brockwell Walk | SS12 9DB |
| Bromfords Close | SS12 0PN |
| Bromfords Drive | SS12 0NZ SS12 0PE SS12 0PW |
| Brooklands | SS12 0DT |
| Browning Drive | SS12 0PR SS12 0PS |
| Burne Avenue | SS12 0HH |
| Castledon Road | SS12 0EF SS12 0EG SS12 0EJ SS12 0EL |
| Champion Close | SS12 9DW |
| Charlotte Avenue | SS12 0DX SS12 0DZ |
| Cross Avenue | SS12 0NA |
| Deirdre Avenue | SS12 0AX SS12 0AY |
| Deirdre Close | SS12 0AZ |
| Donald Thorn Close | SS12 9DN |
| Durants Walk | SS12 9DD |
| Elder Avenue | SS12 0LP SS12 0LR SS12 0LT SS12 0LU |
| Elder Way | SS12 0LX |
| Eleanor Chase | SS12 0DY |
| Elizabeth Drive | SS12 0DN SS12 0DS SS12 0DW |
| Evergreen Court | SS12 0NQ |
| Farnes Avenue | SS12 0BX |
| Finchingfield Way | SS12 0PA |
| Friern Gardens | SS12 0HA SS12 0HD |
| Friern Place | SS12 0JA |
| Friern Walk | SS12 0HZ |
| Fyfield Avenue | SS12 0PD |
| Gateway Service Road | SS12 9FW |
| Gibraltar Walk | SS12 9AX |
| Golden Jubilee Way | SS12 9FT |
| Goodmayes Walk | SS12 9BL |
| Grange Avenue | SS12 0LY SS12 0LZ SS12 0ND SS12 0NG |
| Grovelands Road | SS12 9BX SS12 9DG |
| Hendon Close | SS12 9BZ |
| High Street | SS12 0RD SS12 9AQ SS12 9AE SS12 9AH SS12 9AT SS12 9AY SS12 9AZ |
| Hyde Way | SS12 9BH SS12 9BJ SS12 9BS |
| Irvon Hill Road | SS12 0AQ SS12 0RH |
| Karen Close | SS12 0NR |
| Keats Way | SS12 0BU SS12 0BP |
| Kingley Close | SS12 0EN SS12 0EW |
| Kingley Drive | SS12 0EP |
| Laburnum Avenue | SS12 0BY SS12 0DA SS12 0DB SS12 0DD |
| Laburnum Close | SS12 0BZ |
| Ladygate Centre | SS12 9AJ |
| Larkswood Walk | SS12 9BY |
| Laurel Avenue | SS12 0BH SS12 0BJ |
| Lavender Way | SS12 0BG |
| Leasway | SS12 0HE SS12 0HF |
| Lilac Avenue | SS12 0BL SS12 0BW |
| London Mews | SS12 0AJ |
| London Road | SS12 0AN SS12 0AR SS12 0AT SS12 0AU SS12 0AW SS12 0ET SS12 0EX SS12 0AS |
| Louvaine Avenue | SS12 0DP SS12 0DR |
| Mapleleaf Gardens | SS12 0NB |
| Margarite Way | SS12 0ER SS12 0ES |
| Market Avenue | SS12 0AB SS12 0AD SS12 0AE SS12 0FF SS12 0HW SS12 0RG |
| Market Road | SS12 0AA SS12 0AG SS12 0BA SS12 0BB SS12 0FA SS12 0FD |
| Nesbit Close | SS12 0PT |
| Nevendon Road | SS12 0LN SS12 0LW SS12 0NE SS12 0NF SS12 0NH SS12 0NJ SS12 0NS SS12 0NX SS12 0PU SS12 0PY SS12 0PZ SS12 0QB SS12 0QG SS12 0QQ SS12 0FH SS12 0QH SS12 9RZ |
| North Crescent | SS12 9AP |
| Oak Chase | SS12 0EU |
| Oakhurst Close | SS12 0NP |
| Oakhurst Drive | SS12 0NN SS12 0NW |
| Old Nevendon Road | SS12 0QD |
| Ozonia Avenue | SS12 0PF SS12 0PJ |
| Ozonia Close | SS12 0PL |
| Ozonia Walk | SS12 0PH |
| Ozonia Way | SS12 0PG SS12 0PQ |
| Park Drive | SS12 9DJ |
| Reeds Way | SS12 0EA |
| River View | SS12 0FE |
| Riverside Walk | SS12 0DU |
| St Marys Road | SS12 0PP |
| St Peters Terrace | SS12 0AP |
| Sudbrook Close | SS12 9BN |
| Sutcliffe Close | SS12 9DE |
| The Briary | SS12 0HT |
| The Chase | SS12 0HL |
| The Orchard | SS12 0HB |
| The Tithe | SS12 0HN |
| Toppesfield Avenue | SS12 0PB |
| Trent Close | SS12 9BW |
| Trinder Way | SS12 0HQ |
| Tudor Walk | SS12 0HU |
| Tudor Way | SS12 0HS |
| Valentines | SS12 9DA |
| Victoria Avenue | SS12 0DH SS12 0DL |
| Victoria Crescent | SS12 0DJ |
| Wick Drive | SS12 9AS |
| Willowdale Centre | SS12 0RA SS12 0FJ |
| Woodfield | SS12 9BT |
| Woodlands Road | SS12 0AL |
Transport near Wickford Castledon
-
Wickford Station
-
Battlesbridge Station
-
Pitsea Station
-
Basildon Station
-
Rayleigh Station
-
Billericay Station
-
Laindon Station
-
South Woodham Ferrers Station
-
Benfleet Station
- FAQ
- Price Paid By Year
- Property Type Price
Frequently asked questions about Wickford Castledon
What is the average price for a property for sale in Wickford Castledon?
The average price for a property for sale in Wickford Castledon is £382,330. This amount is 3% lower than the average price in Wickford. There are 2,712 property listings for sale in Wickford Castledon.
What streets have the most expensive properties for sale in Wickford Castledon?
The streets with the most expensive properties for sale in Wickford Castledon are Castledon Road at an average of £788,571, Riverside Walk at an average of £628,500 and Louvaine Avenue at an average of £576,500.
What streets have the most affordable properties for sale in Wickford Castledon?
The streets with the most affordable properties for sale in Wickford Castledon are Golden Jubilee Way at an average of £195,245, Market Avenue at an average of £207,000 and High Street at an average of £214,687.
Which train stations are available in or near Wickford Castledon?
Some of the train stations available in or near Wickford Castledon are Wickford, Battlesbridge and Pitsea.
Property Price Paid in Wickford Castledon by Year
The average sold property price by year was:
| Year | Average Sold Price | Price Change |
Sold Properties
|
|---|---|---|---|
| 2025 | £375,322 | -5% |
76 Properties |
| 2024 | £395,291 | 6% |
114 Properties |
| 2023 | £370,804 | -4% |
118 Properties |
| 2022 | £385,316 | 6% |
139 Properties |
| 2021 | £363,913 | 4% |
186 Properties |
| 2020 | £349,866 | 6% |
112 Properties |
| 2019 | £329,828 | 4% |
130 Properties |
| 2018 | £315,253 | -0,5% |
152 Properties |
| 2017 | £316,818 | 3% |
142 Properties |
| 2016 | £308,740 | 23% |
172 Properties |
| 2015 | £237,346 | -5% |
204 Properties |
| 2014 | £248,323 | 6% |
155 Properties |
| 2013 | £232,840 | 3% |
114 Properties |
| 2012 | £226,810 | 5% |
87 Properties |
| 2011 | £216,033 | 0,2% |
109 Properties |
| 2010 | £215,648 | 20% |
97 Properties |
| 2009 | £172,801 | -31% |
118 Properties |
| 2008 | £226,511 | -2% |
84 Properties |
| 2007 | £230,355 | 8% |
169 Properties |
| 2006 | £212,669 | 12% |
181 Properties |
| 2005 | £186,674 | -1% |
153 Properties |
| 2004 | £188,012 | 3% |
154 Properties |
| 2003 | £183,063 | 15% |
168 Properties |
| 2002 | £155,127 | 20% |
167 Properties |
| 2001 | £124,219 | 10% |
146 Properties |
| 2000 | £111,298 | 18% |
132 Properties |
| 1999 | £91,106 | 6% |
166 Properties |
| 1998 | £85,993 | 7% |
188 Properties |
| 1997 | £79,775 | 15% |
179 Properties |
| 1996 | £67,786 | 2% |
120 Properties |
| 1995 | £66,685 | - |
118 Properties |
Property Price per Property Type in Wickford Castledon
Here you can find historic sold price data in order to help with your property search.
The average Property Paid Price for specific property types in the last three years are:
| Property Type | Average Sold Price | Sold Properties |
|---|---|---|
| Flat | £211,623.00 | 72 Flats |
| Semi Detached House | £392,468.00 | 250 Semi Detached Houses |
| Detached House | £532,948.00 | 78 Detached Houses |
| Terraced House | £339,946.00 | 47 Terraced Houses |

