
Houses for sale & to rent in Whickham South And Sunniside, Gateshead
House Prices in Whickham South And Sunniside
Properties in Whickham South And Sunniside have an average house price of £232,293.00 and had 8 Property Transactions within the last 3 years¹.
Whickham South And Sunniside is an area in Gateshead, Gateshead with 114 households², where the most expensive property was sold for £367,350.00.
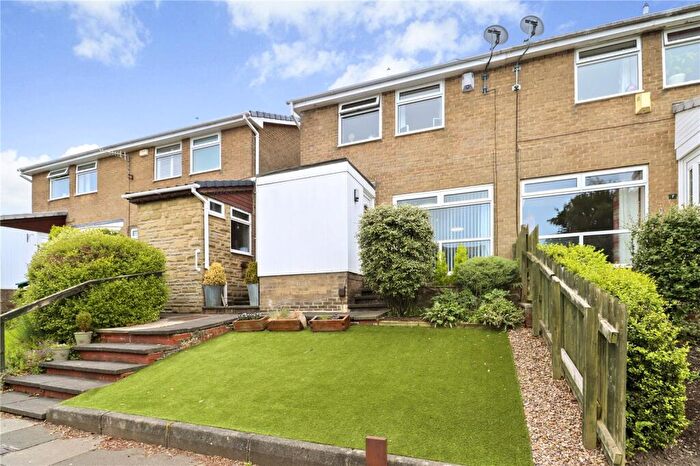
Properties for sale in Whickham South And Sunniside


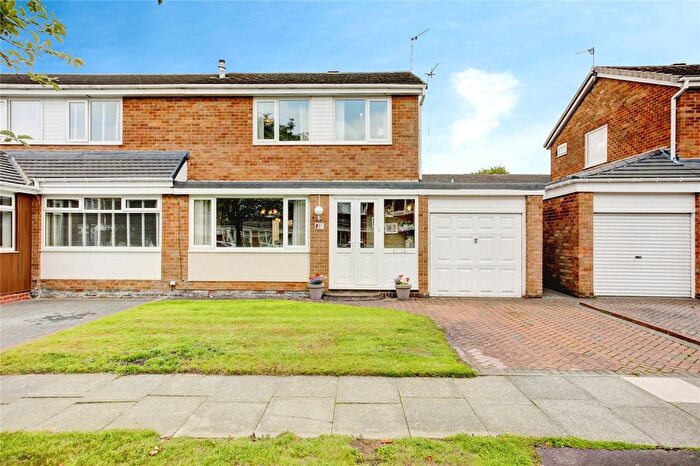

![]()
If you are looking to sell your house, let it out, or receive a property valuation, an expert can help you.
Click the button below to get started.


Roads and Postcodes in Whickham South And Sunniside
Navigate through our locations to find the location of your next house in Whickham South And Sunniside, Gateshead for sale or to rent.
| Streets | Postcodes |
|---|---|
| Briarsyde Close | NE16 5UG NE16 5UH NE16 5UJ NE16 5UQ |
| Harewood Close | NE16 5SZ |
| Ravensworth Park Estate | NE11 0HQ |
| NE11 0HR |
Transport near Whickham South And Sunniside

- FAQ
- Price Paid By Year
- Property Type Price
Frequently asked questions about Whickham South And Sunniside
What is the average price for a property for sale in Whickham South And Sunniside?
The average price for a property for sale in Whickham South And Sunniside is £232,293. This amount is 52% higher than the average price in Gateshead. There are 532 property listings for sale in Whickham South And Sunniside.
What streets have the most expensive properties for sale in Whickham South And Sunniside?
The street with the most expensive properties for sale in Whickham South And Sunniside is Harewood Close at an average of £250,000.
What streets have the most affordable properties for sale in Whickham South And Sunniside?
The street with the most affordable properties for sale in Whickham South And Sunniside is Briarsyde Close at an average of £226,391.
Which train stations are available in or near Whickham South And Sunniside?
Some of the train stations available in or near Whickham South And Sunniside are MetroCentre, Dunston and Blaydon.
Property Price Paid in Whickham South And Sunniside by Year
The average sold property price by year was:
| Year | Average Sold Price | Price Change |
Sold Properties
|
|---|---|---|---|
| 2024 | £190,000 | -6% |
3 Properties |
| 2023 | £201,666 | -69% |
3 Properties |
| 2022 | £341,675 | 31% |
2 Properties |
| 2021 | £235,833 | 10% |
3 Properties |
| 2020 | £211,733 | 20% |
3 Properties |
| 2019 | £169,950 | -13% |
1 Property |
| 2018 | £192,475 | -14% |
2 Properties |
| 2017 | £220,000 | 31% |
1 Property |
| 2016 | £151,510 | -34% |
5 Properties |
| 2015 | £203,075 | 4% |
6 Properties |
| 2014 | £194,062 | -12% |
4 Properties |
| 2013 | £217,133 | 19% |
3 Properties |
| 2012 | £176,225 | 21% |
2 Properties |
| 2011 | £139,500 | -29% |
6 Properties |
| 2009 | £180,000 | 30% |
1 Property |
| 2008 | £126,333 | -74% |
3 Properties |
| 2007 | £219,325 | 21% |
6 Properties |
| 2006 | £173,970 | 7% |
5 Properties |
| 2005 | £162,500 | 11% |
2 Properties |
| 2004 | £144,605 | 7% |
9 Properties |
| 2003 | £135,125 | 33% |
6 Properties |
| 2002 | £90,800 | -0,1% |
5 Properties |
| 2001 | £90,914 | 17% |
7 Properties |
| 2000 | £75,375 | 26% |
4 Properties |
| 1999 | £55,750 | -0,4% |
4 Properties |
| 1998 | £56,000 | -11% |
1 Property |
| 1997 | £62,208 | 7% |
6 Properties |
| 1996 | £58,016 | -22% |
6 Properties |
| 1995 | £71,000 | - |
5 Properties |
Property Price per Property Type in Whickham South And Sunniside
Here you can find historic sold price data in order to help with your property search.
The average Property Paid Price for specific property types in the last three years are:
| Property Type | Average Sold Price | Sold Properties |
|---|---|---|
| Semi Detached House | £229,200.00 | 5 Semi Detached Houses |
| Detached House | £367,350.00 | 1 Detached House |
| Terraced House | £220,000.00 | 1 Terraced House |
| Flat | £125,000.00 | 1 Flat |