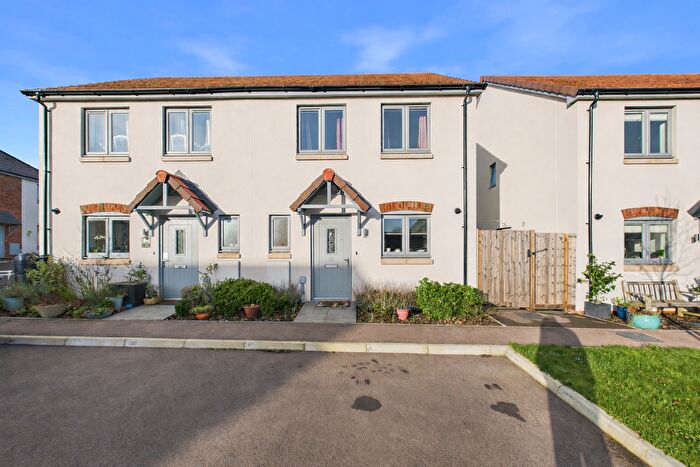
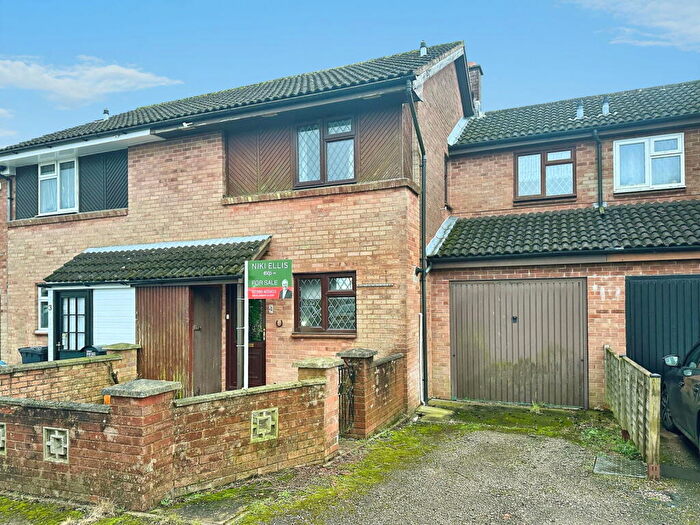
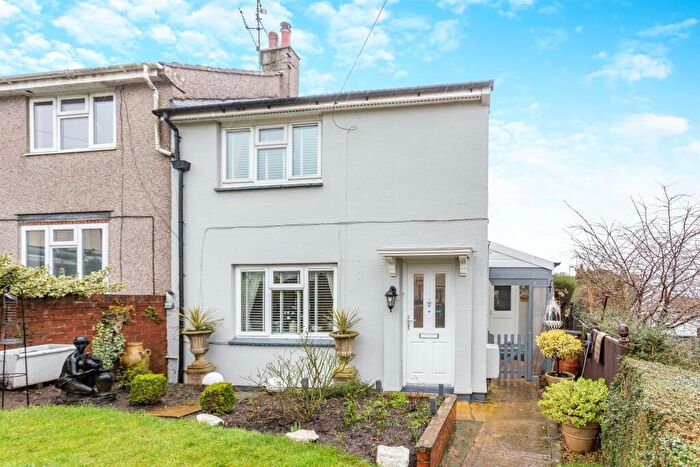
Houses for sale & to rent in Newnham, Blakeney
House Prices in Newnham
Properties in Newnham have an average house price of £327,500.00 and had 2 Property Transactions within the last 3 years¹.
Newnham is an area in Blakeney, Gloucestershire with 96 households², where the most expensive property was sold for £430,000.00.
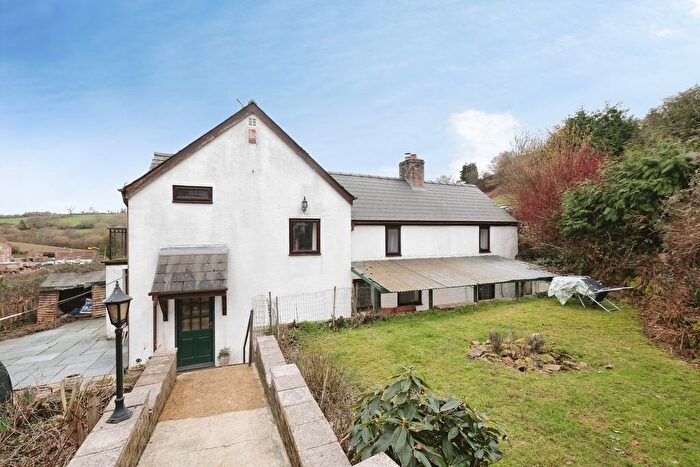
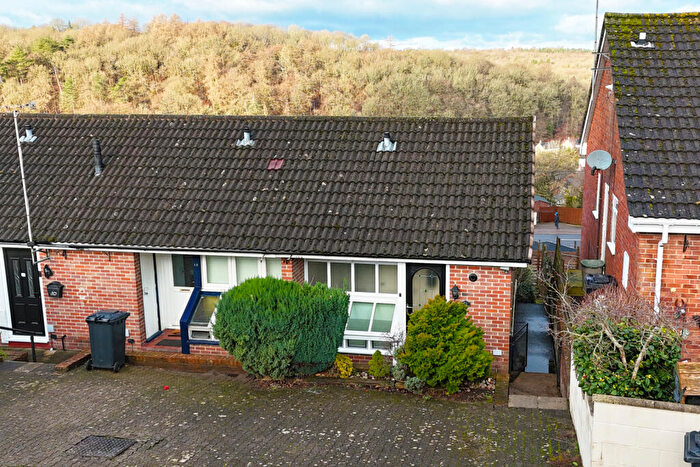
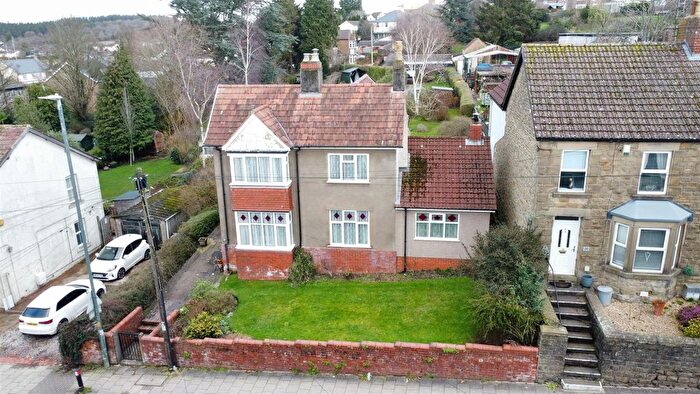
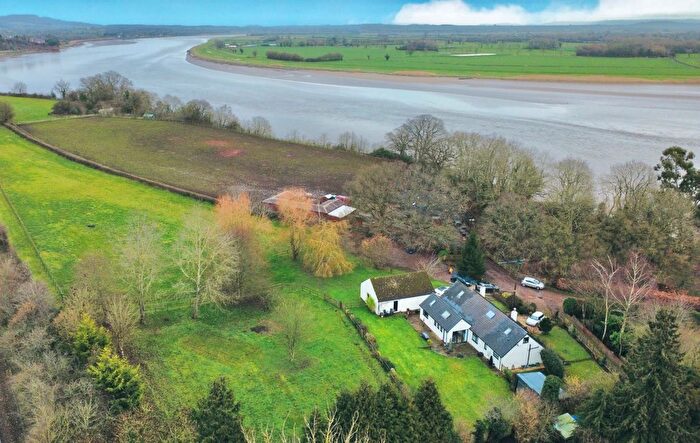
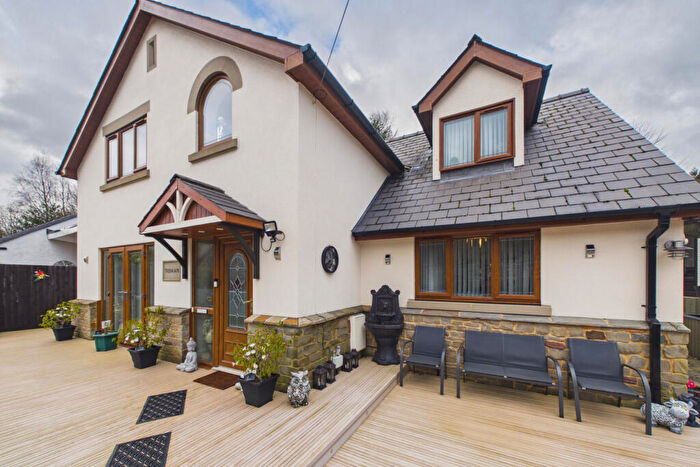
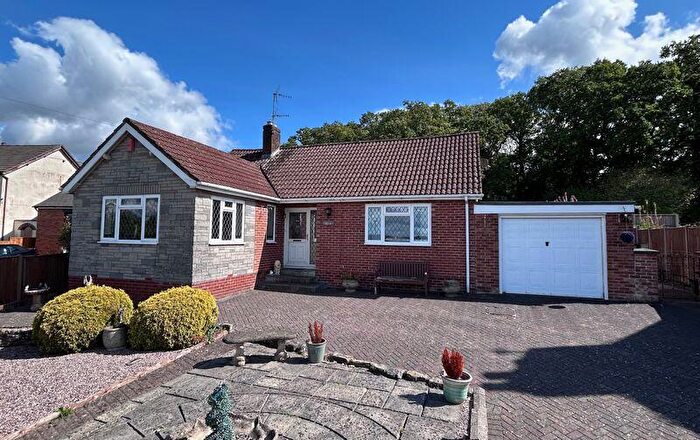
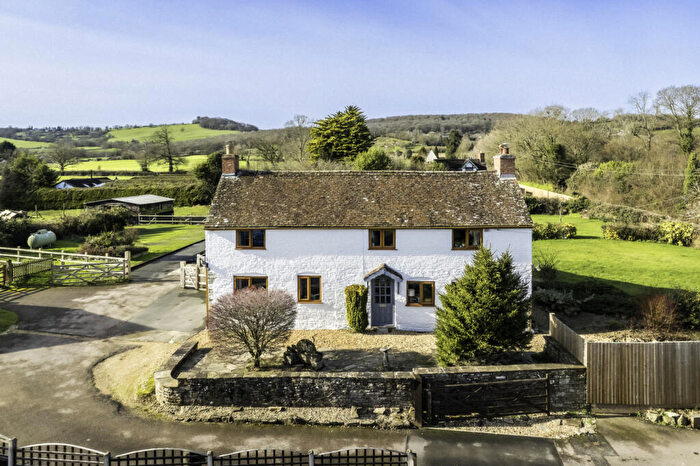
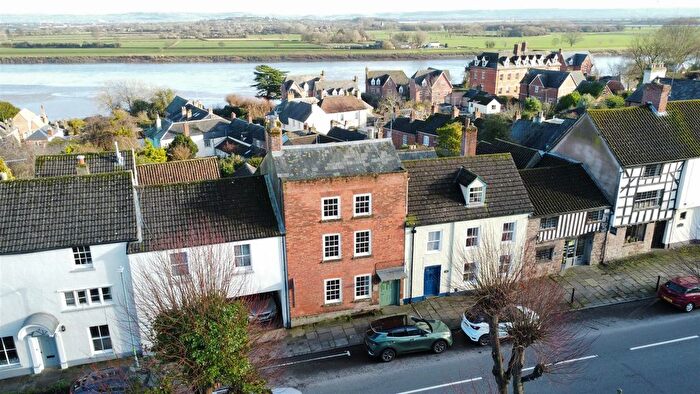
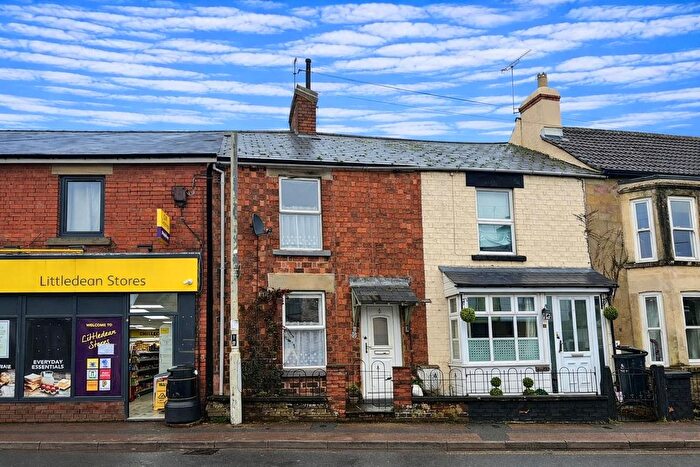
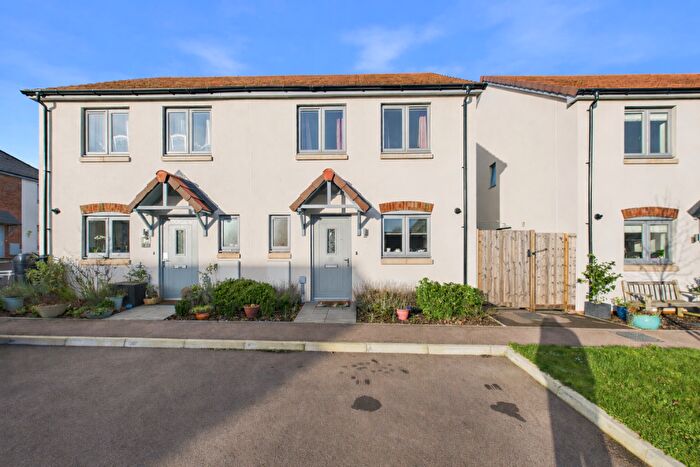
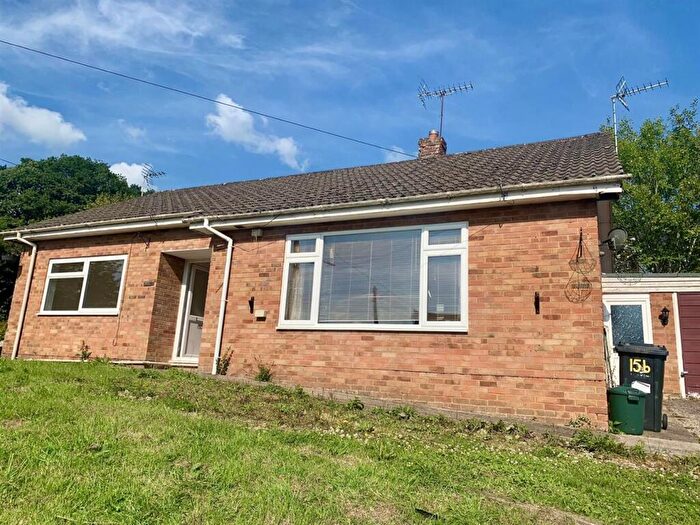
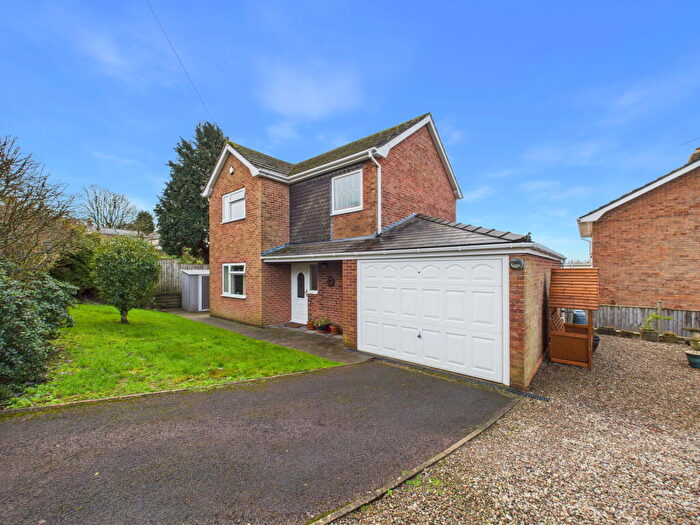
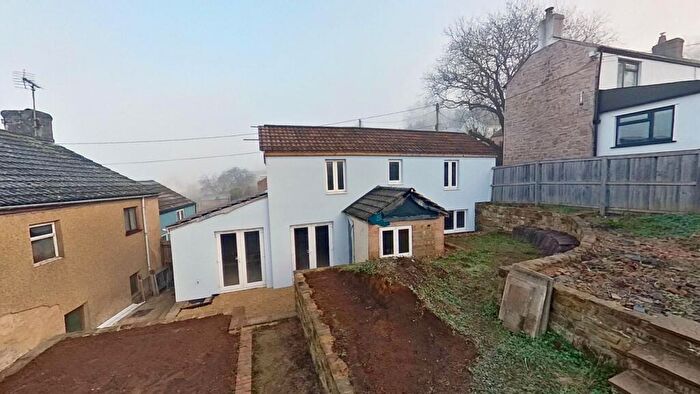
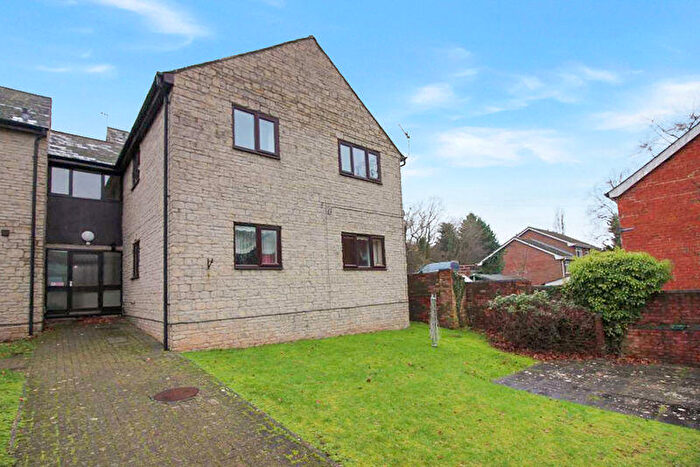
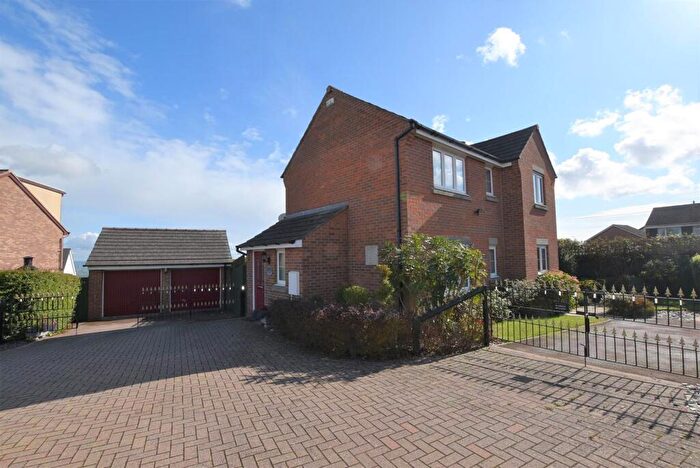
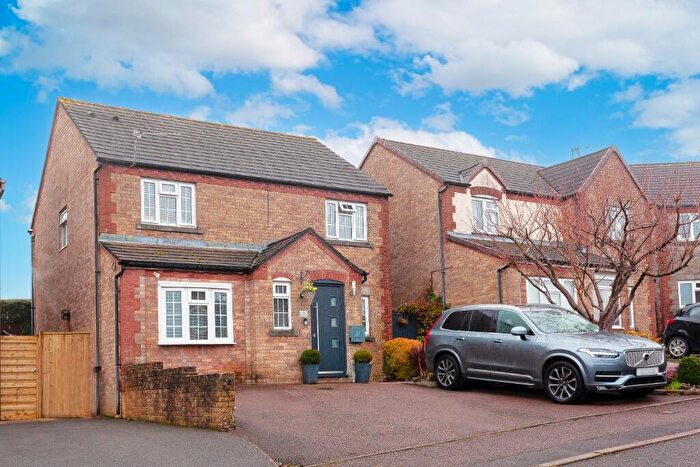
Properties for sale in Newnham
Roads and Postcodes in Newnham
Navigate through our locations to find the location of your next house in Newnham, Blakeney for sale or to rent.
| Streets | Postcodes |
|---|---|
| Beech Way | GL14 3NB |
| Callamore | GL14 3LE |
| Church Square | GL15 4DS |
| Clayhill | GL14 1HG |
| Dean Road | GL14 1AH |
| High Street | GL14 1AE GL14 1BX GL15 4EE |
| Hyde Road | GL14 1DE |
| Newnham Road | GL15 4AD |
| Oak Way | GL14 3NF |
| Old Station Close | GL15 4BE |
| Pleasant Stile | GL14 3NZ |
| Roman Way | GL14 3LN |
| Station Road | GL14 1AT |
| Temple Lane | GL14 3NY |
| The Haie | GL14 1HN |
| Three Trees Way | GL14 3PH |
| Unlawater Lane | GL14 1BN |
| West View | GL14 1DQ |
| GL14 1AQ GL14 1DL GL14 1DX GL14 1DY GL14 1EE GL14 1EQ GL14 1HP GL14 3NS GL14 3NU GL15 4AQ GL15 4AY GL15 4LS |
Transport near Newnham
- FAQ
- Price Paid By Year
- Property Type Price
Frequently asked questions about Newnham
What is the average price for a property for sale in Newnham?
The average price for a property for sale in Newnham is £327,500. This amount is 0.55% lower than the average price in Blakeney. There are 1,580 property listings for sale in Newnham.
Which train stations are available in or near Newnham?
Some of the train stations available in or near Newnham are Lydney, Cam and Dursley and Stonehouse.
Property Price Paid in Newnham by Year
The average sold property price by year was:
| Year | Average Sold Price | Price Change |
Sold Properties
|
|---|---|---|---|
| 2023 | £327,500 | -132% |
2 Properties |
| 2022 | £760,000 | 41% |
1 Property |
| 2021 | £445,000 | 10% |
1 Property |
| 2020 | £400,000 | -33% |
1 Property |
| 2019 | £531,250 | 13% |
2 Properties |
| 2018 | £462,500 | -10% |
1 Property |
| 2016 | £510,000 | - |
1 Property |
Property Price per Property Type in Newnham
Here you can find historic sold price data in order to help with your property search.
The average Property Paid Price for specific property types in the last three years are:
| Property Type | Average Sold Price | Sold Properties |
|---|---|---|
| Semi Detached House | £225,000.00 | 1 Semi Detached House |
| Detached House | £430,000.00 | 1 Detached House |

